
Learn the logical way to trade cryptocurrencies

The Chart Logic Handbook and educational website would not be possible without TradingView – the premier and globally recognized charting and trading application. The technical tools and cutting edge charts are essential for all traders, and I encourage new traders to learn and utilize TradingView at an early stage. The Chart Logic Handbook uses TradingView exclusively for charting, and my trading strategy requires fluency with the application. Don’t worry, I teach readers the TradingView essentials and how to apply it to technical analysis and trading.
I’d like to thank TradingView for their collaboration and product. Without it, the Chart Logic Handbook and educational website would be unimaginable. Together, we provide cryptocurrency traders with an unrivaled educational resource. This collaboration marks an important step in Chart Logic’s mission to drive crypto-centric trading forward.

The Chart Logic Technical Analysis Handbook Second Edition is available NOW!
The comprehensive guide to trading cryptocurrencies:
Learn all procedure, technical analysis, and essential trade strategies necessary to trade the crypto markets with confidence and discipline!
The only resource for statistical performance of commonly occurring chart patterns in the cryptocurrency markets.
Access advanced performance statistics and related insights beyond those offered free on Chartlogic.io.
Study strategies and theory and adopt an evidence-based approach to tackling each trade!
About the Author: R.S. Varnes holds a Juris Doctor and Master of Arts from the American University in Washington, DC. In 2016, he passed the esteemed California Bar Examination and was admitted to practice law; however, in 2020, he chose to switch from active attorney status to voluntary inactive status. R.S. has been mining and profitably trading cryptocurrencies since 2015. What started as a law school hobby turned into a passion and full-time career. He credits his success in the cryptocurrency markets to his methodical trade approach formed from the groundwork of his legal training. As you will see, he takes an evidence-based approach using multiple indicators to corroborate or dispel trade theories.
Chart pattern performance analysis of the top 100 cryptocurrencies
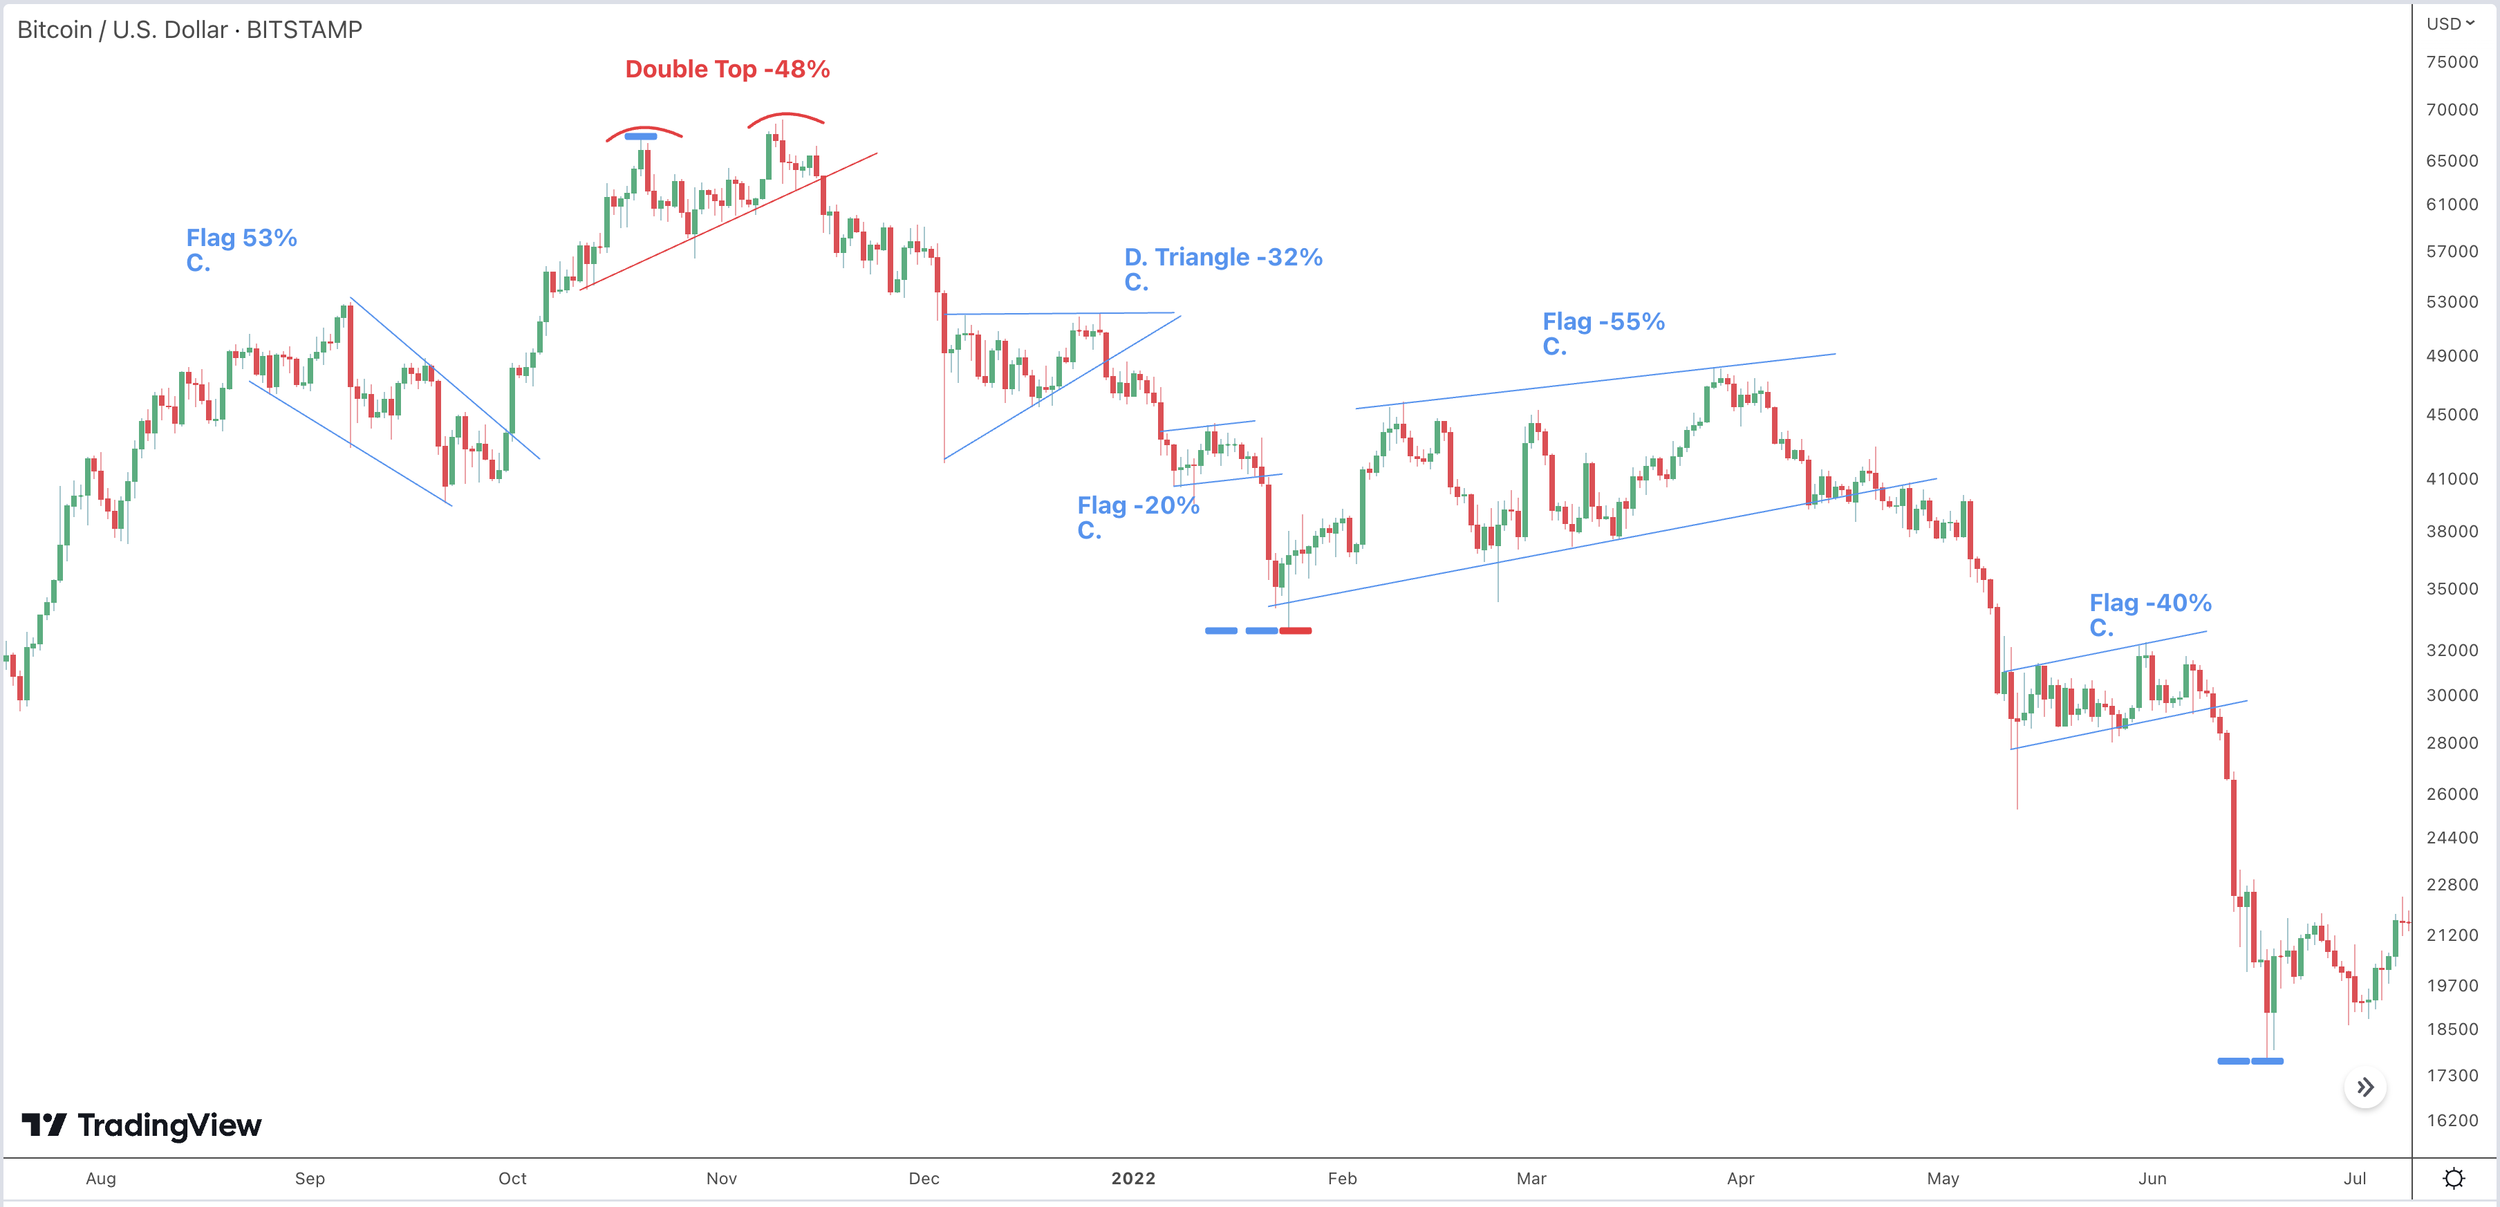
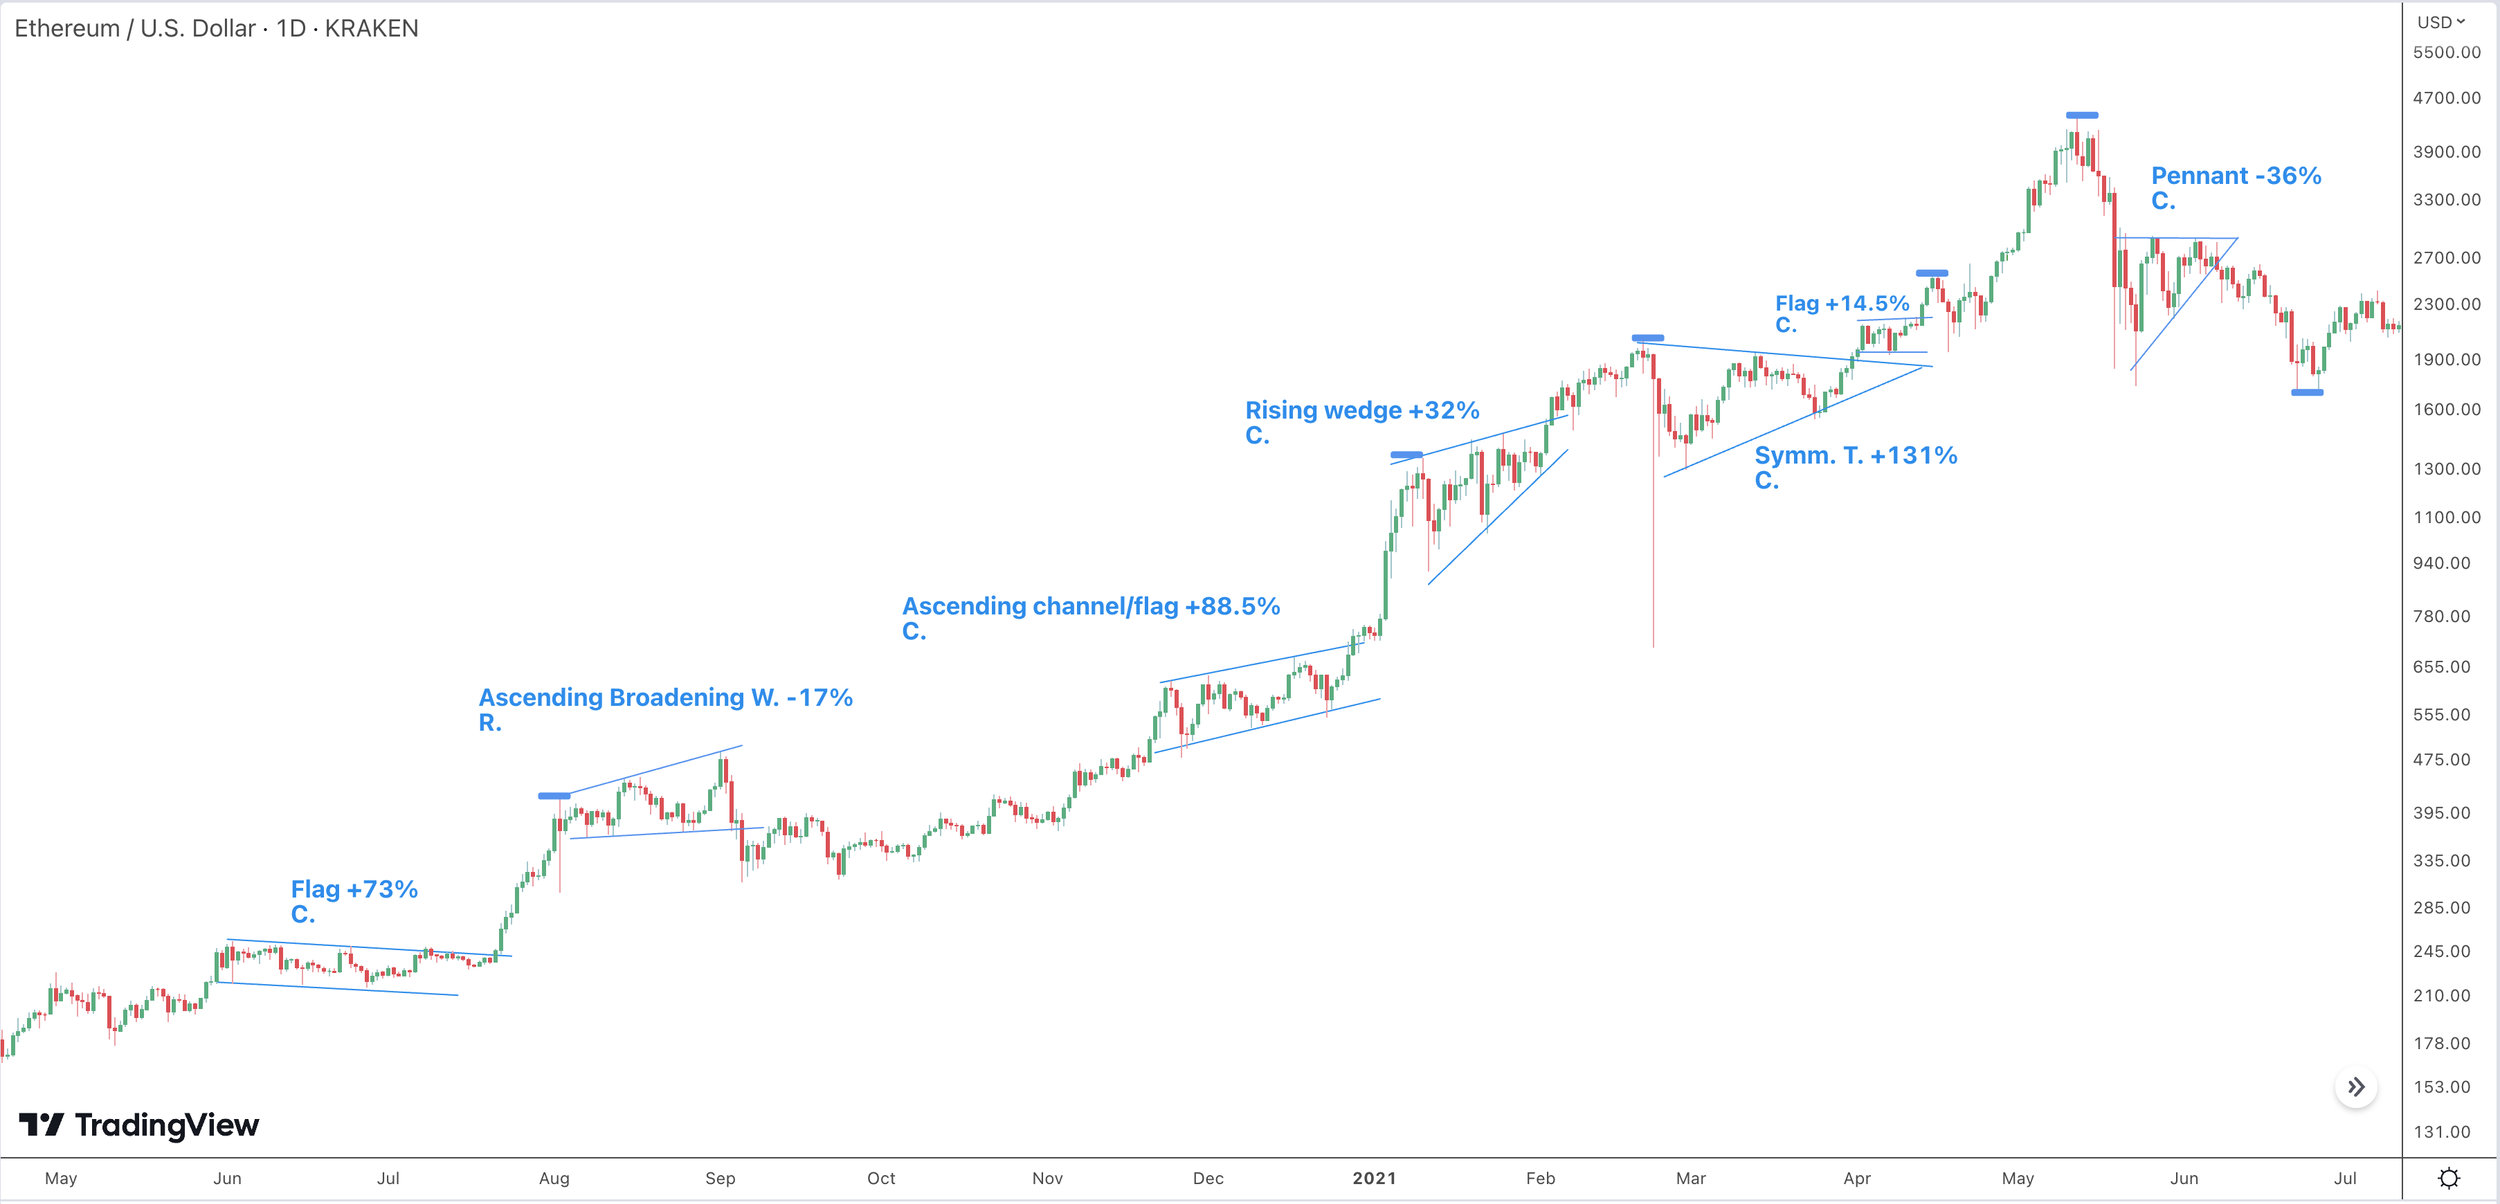
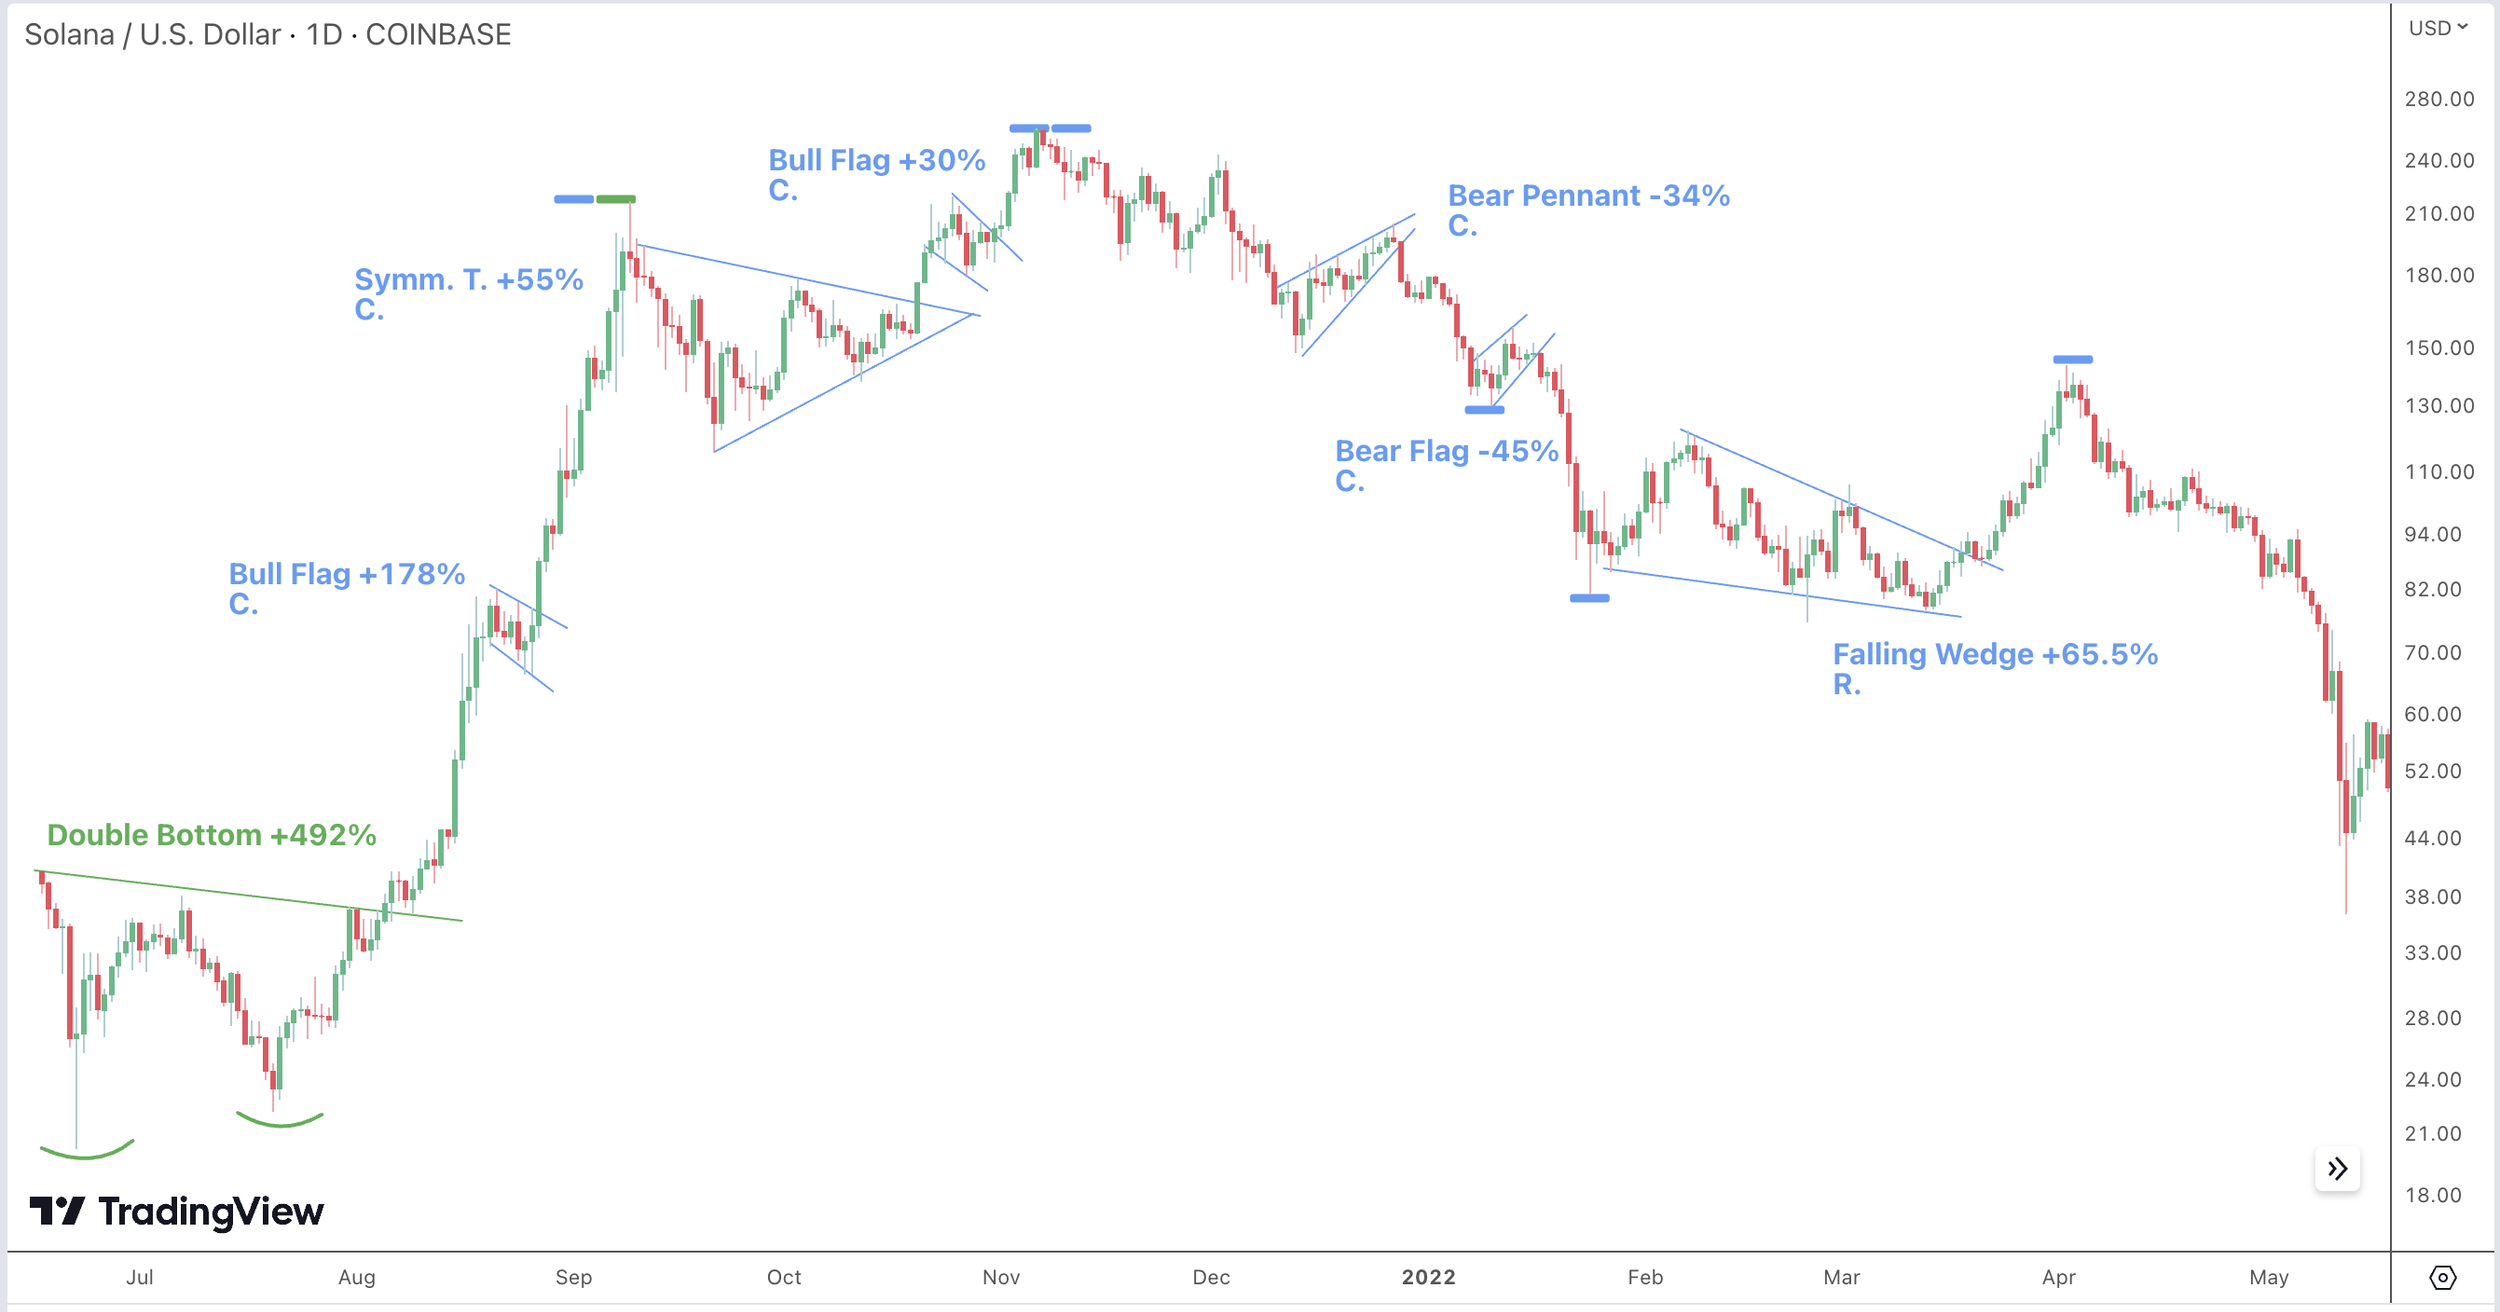
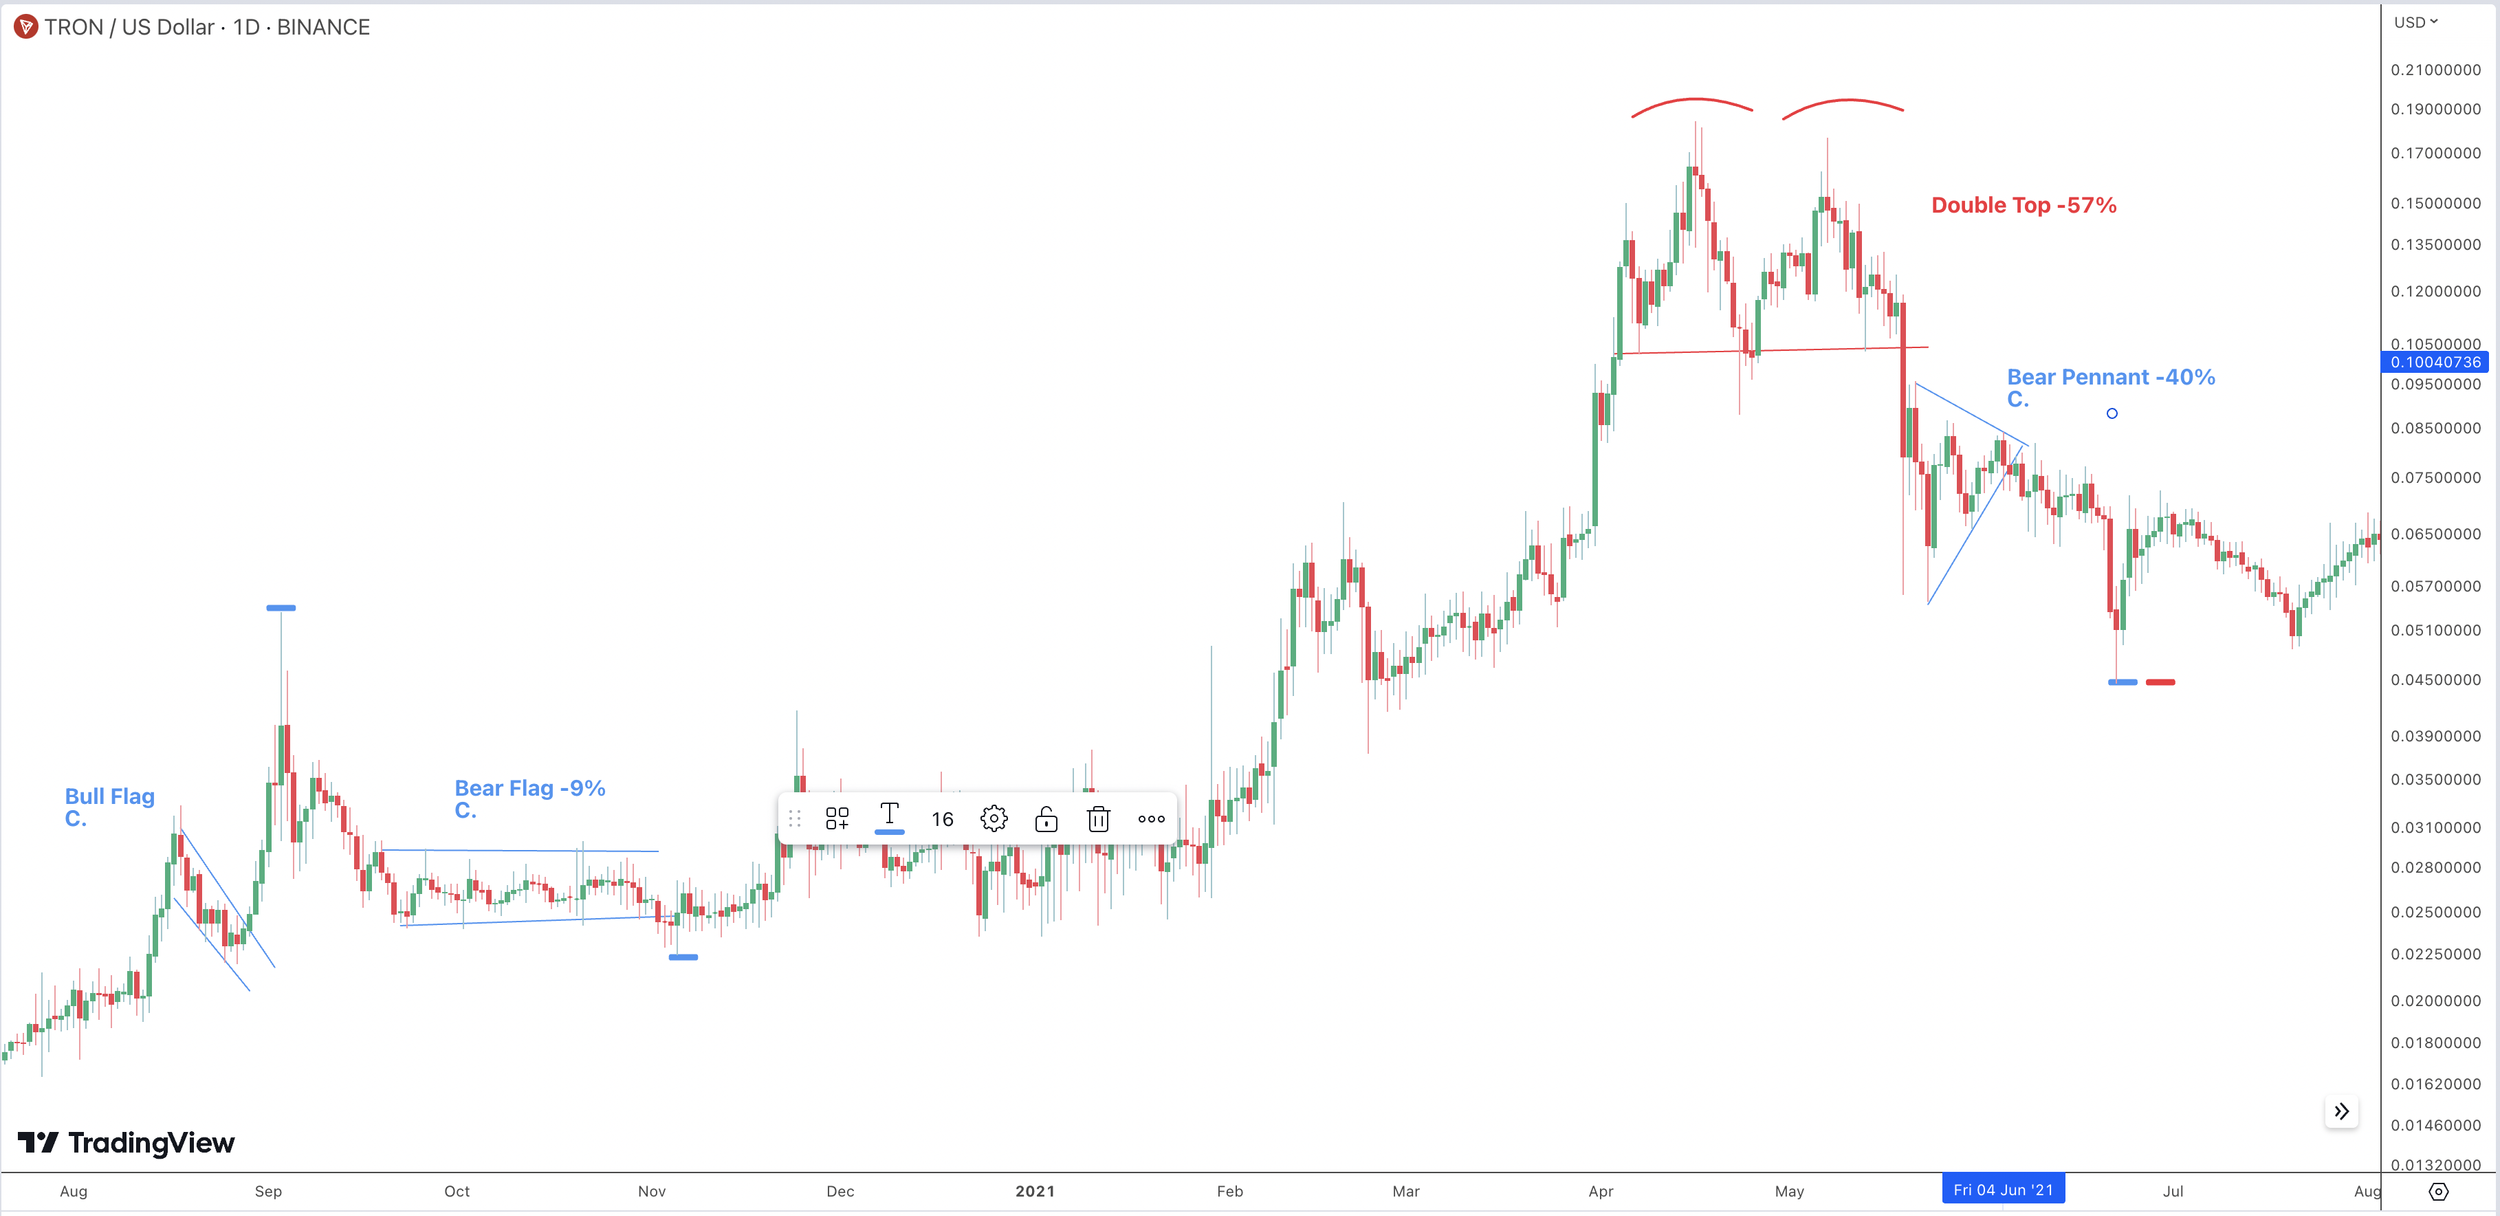
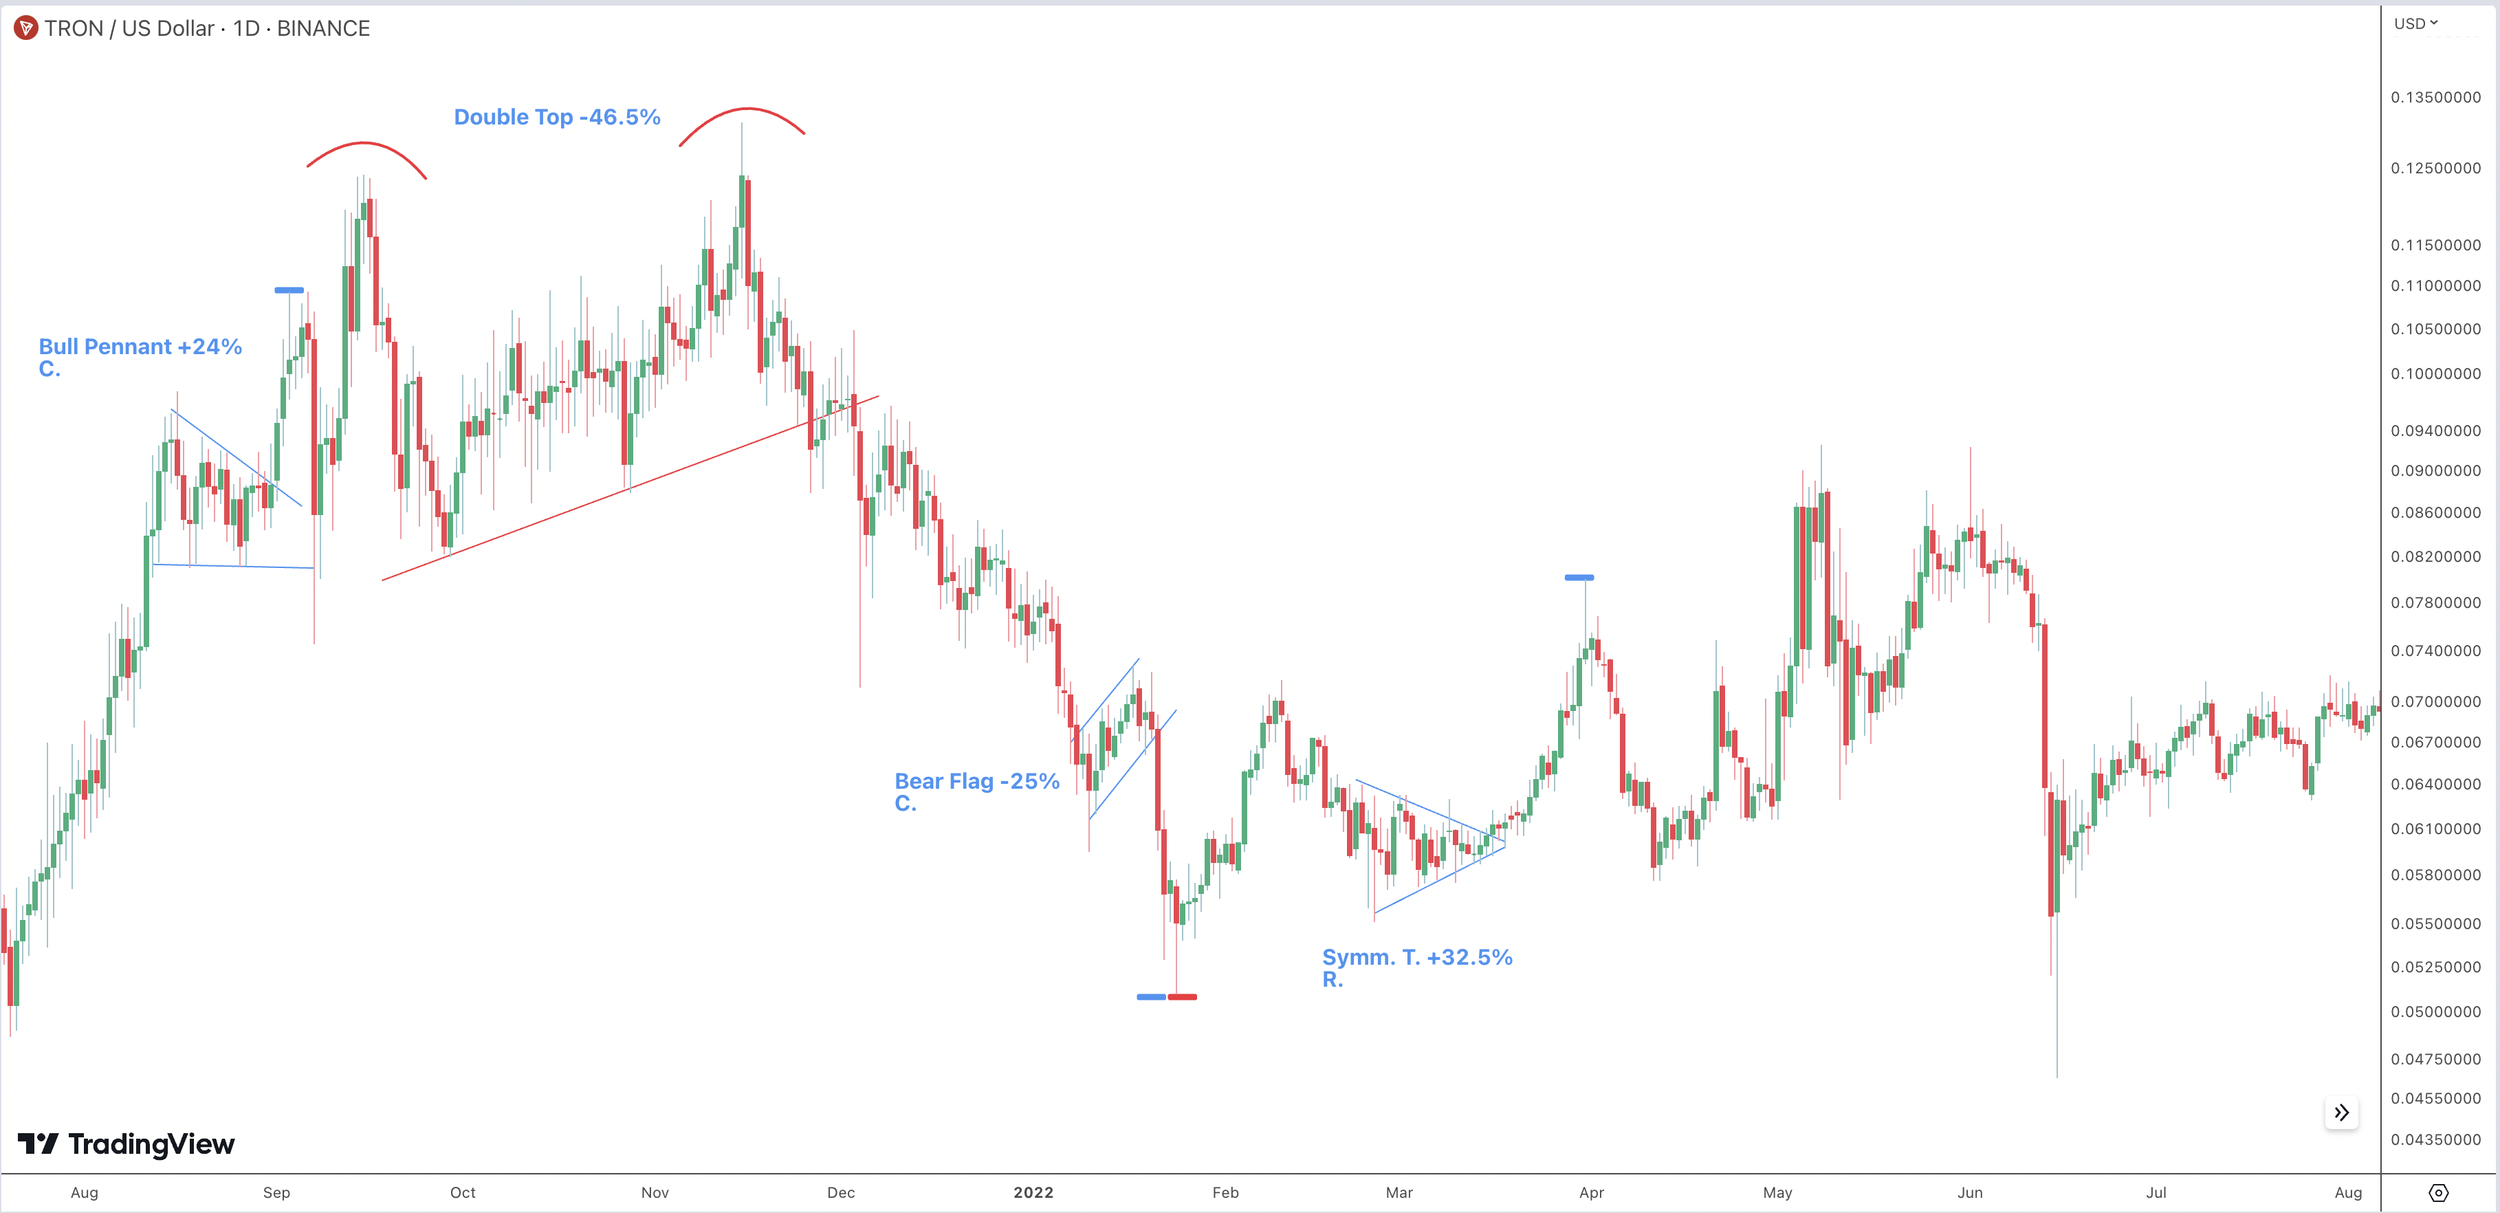
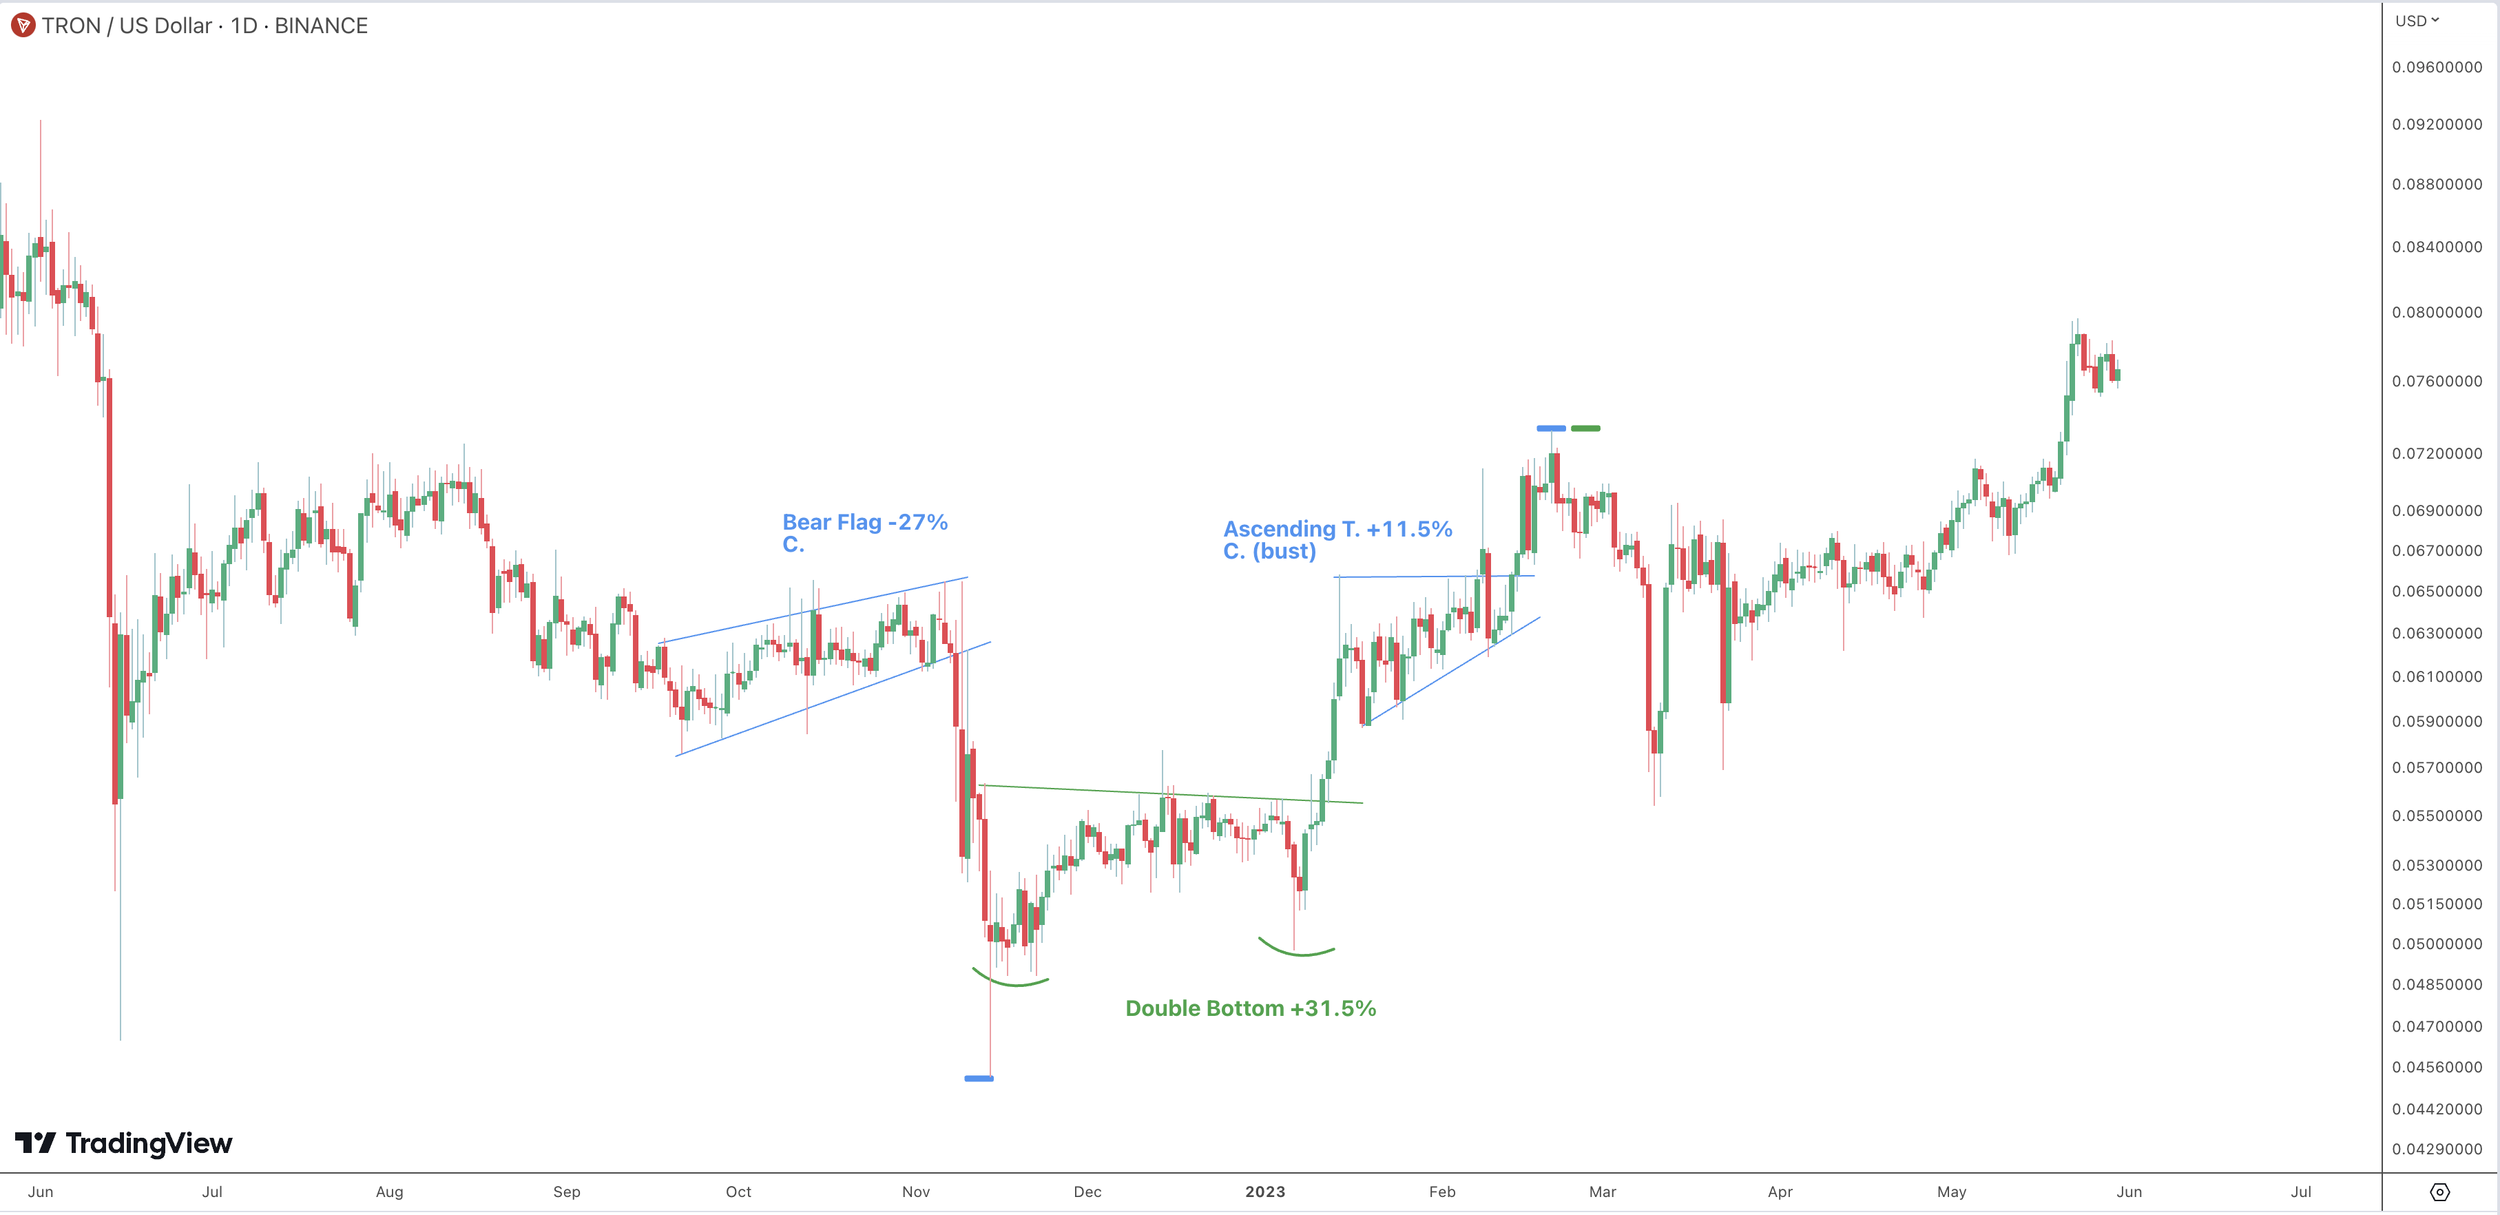
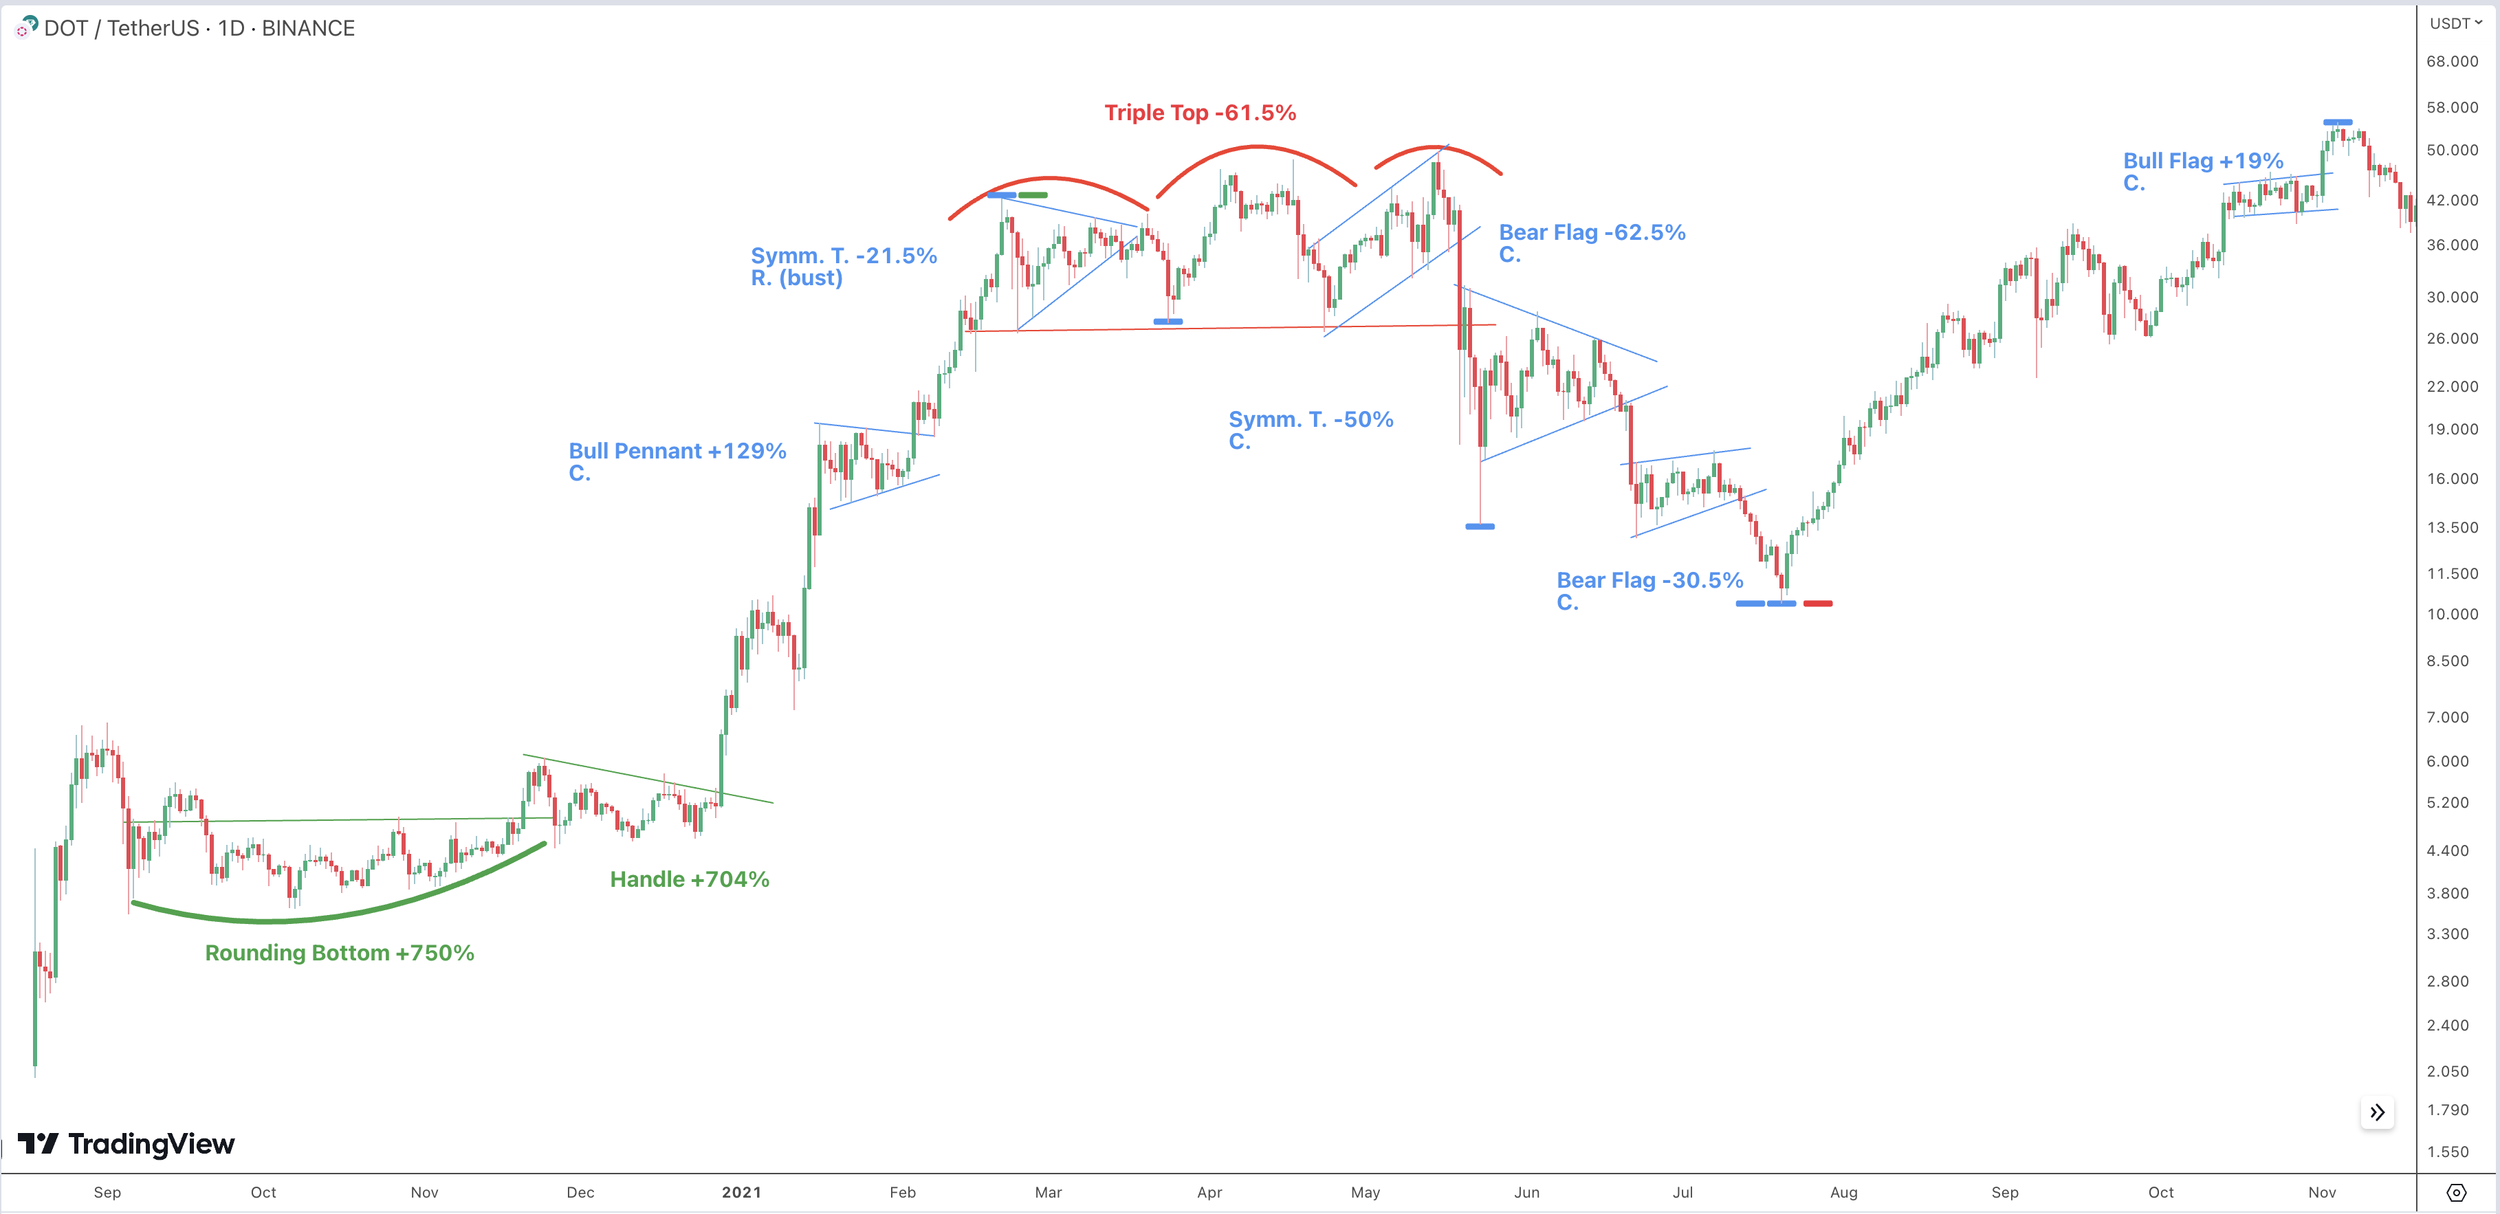
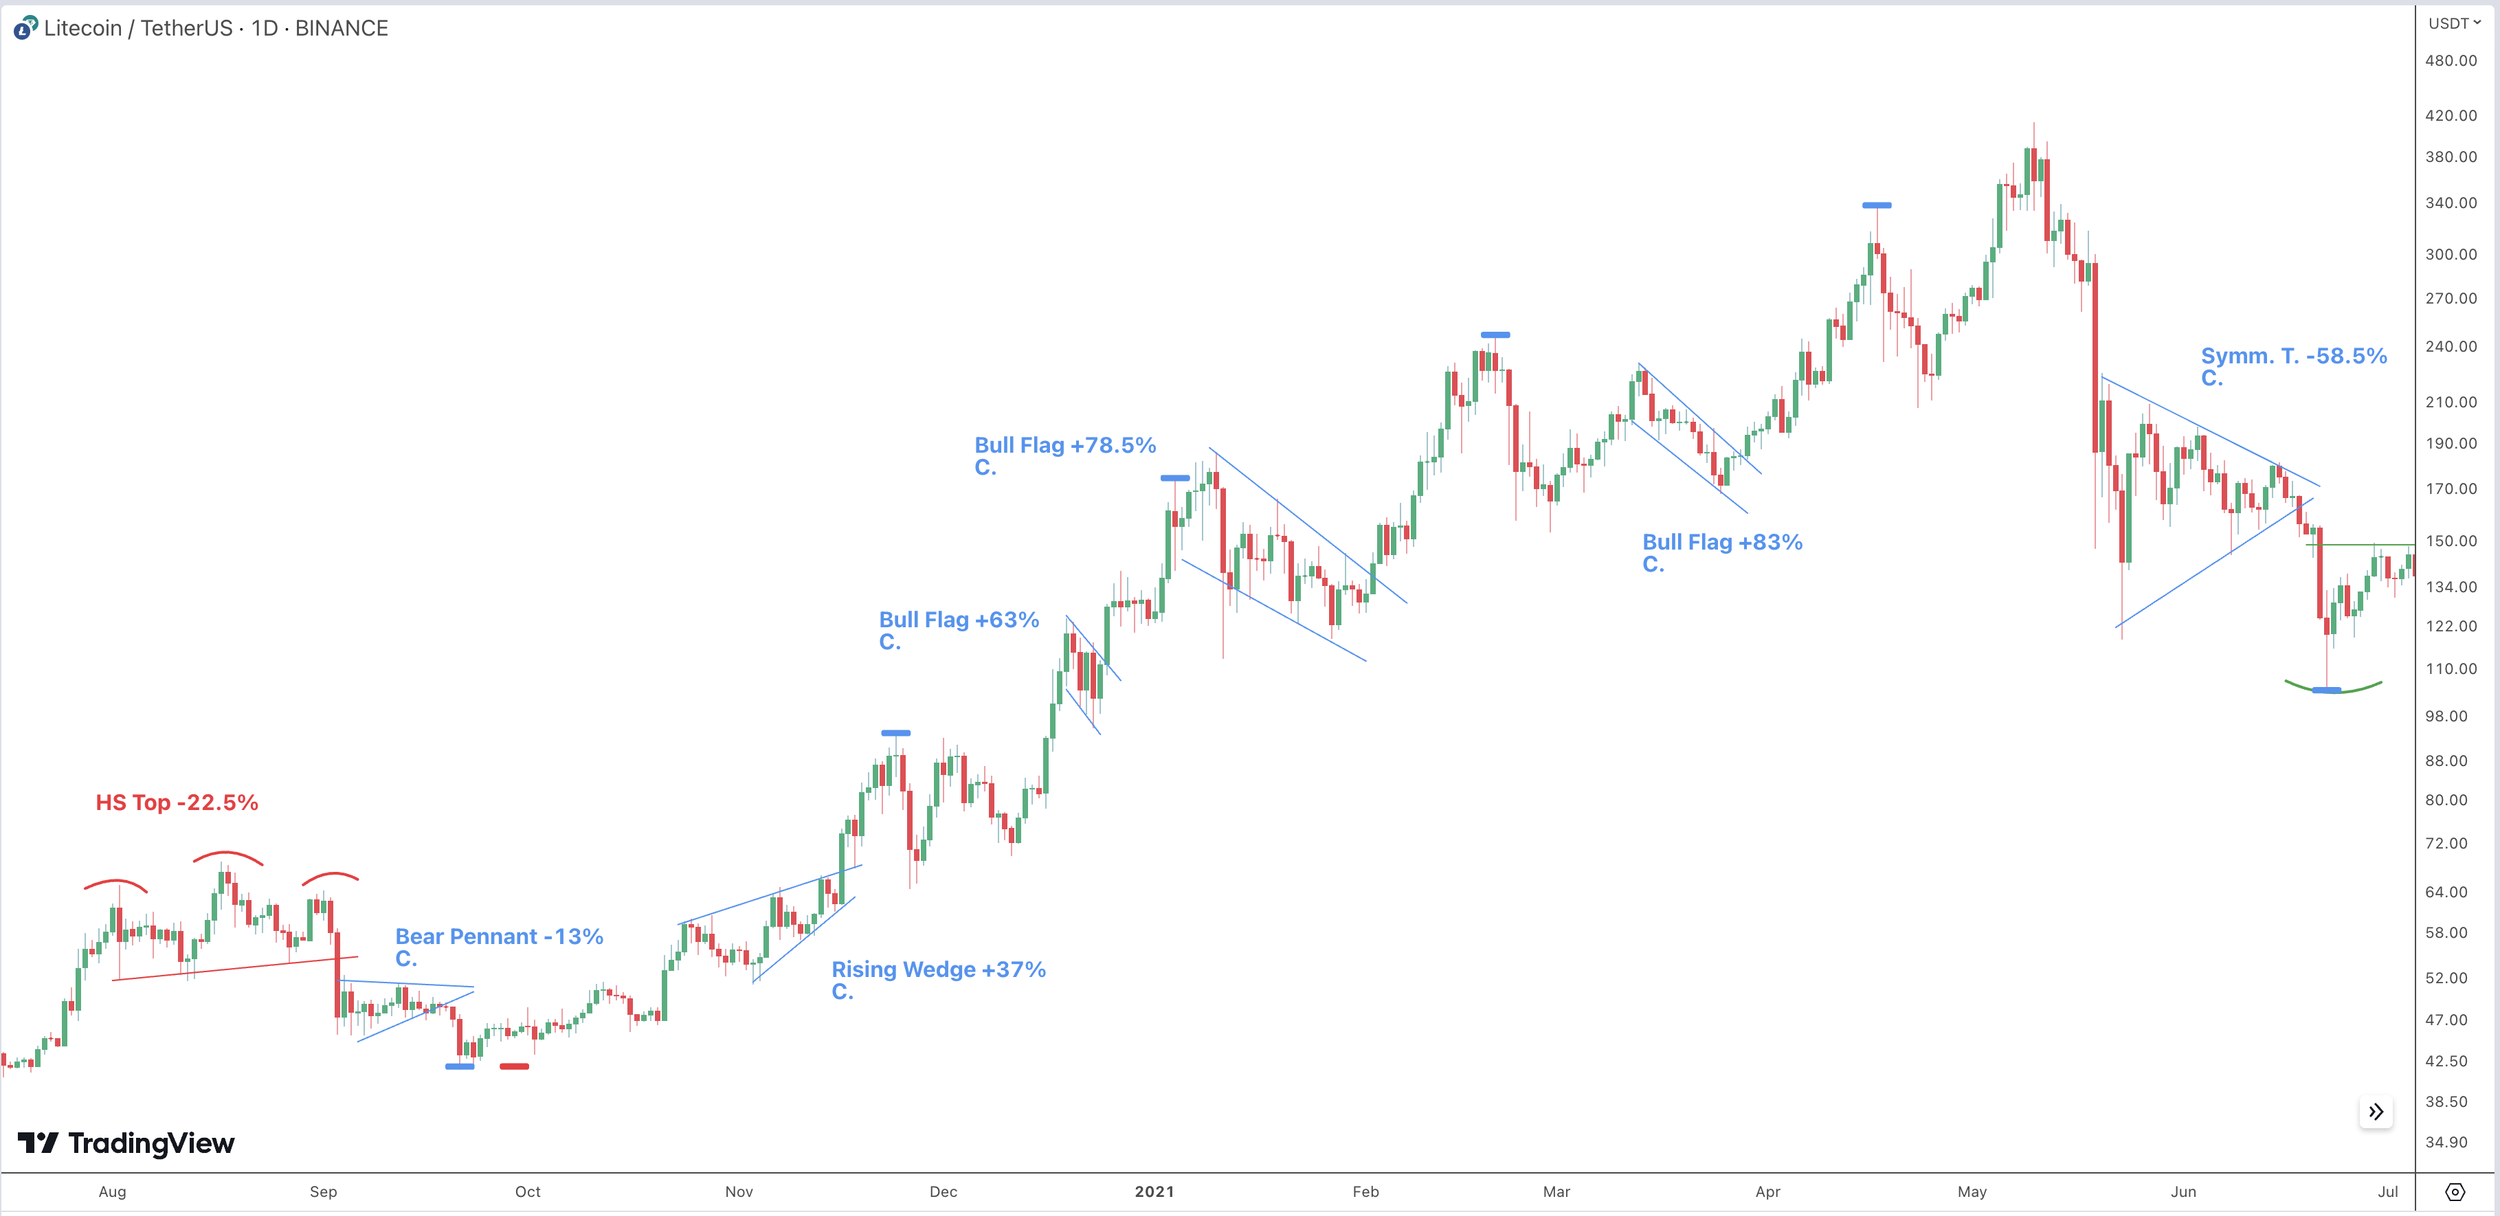
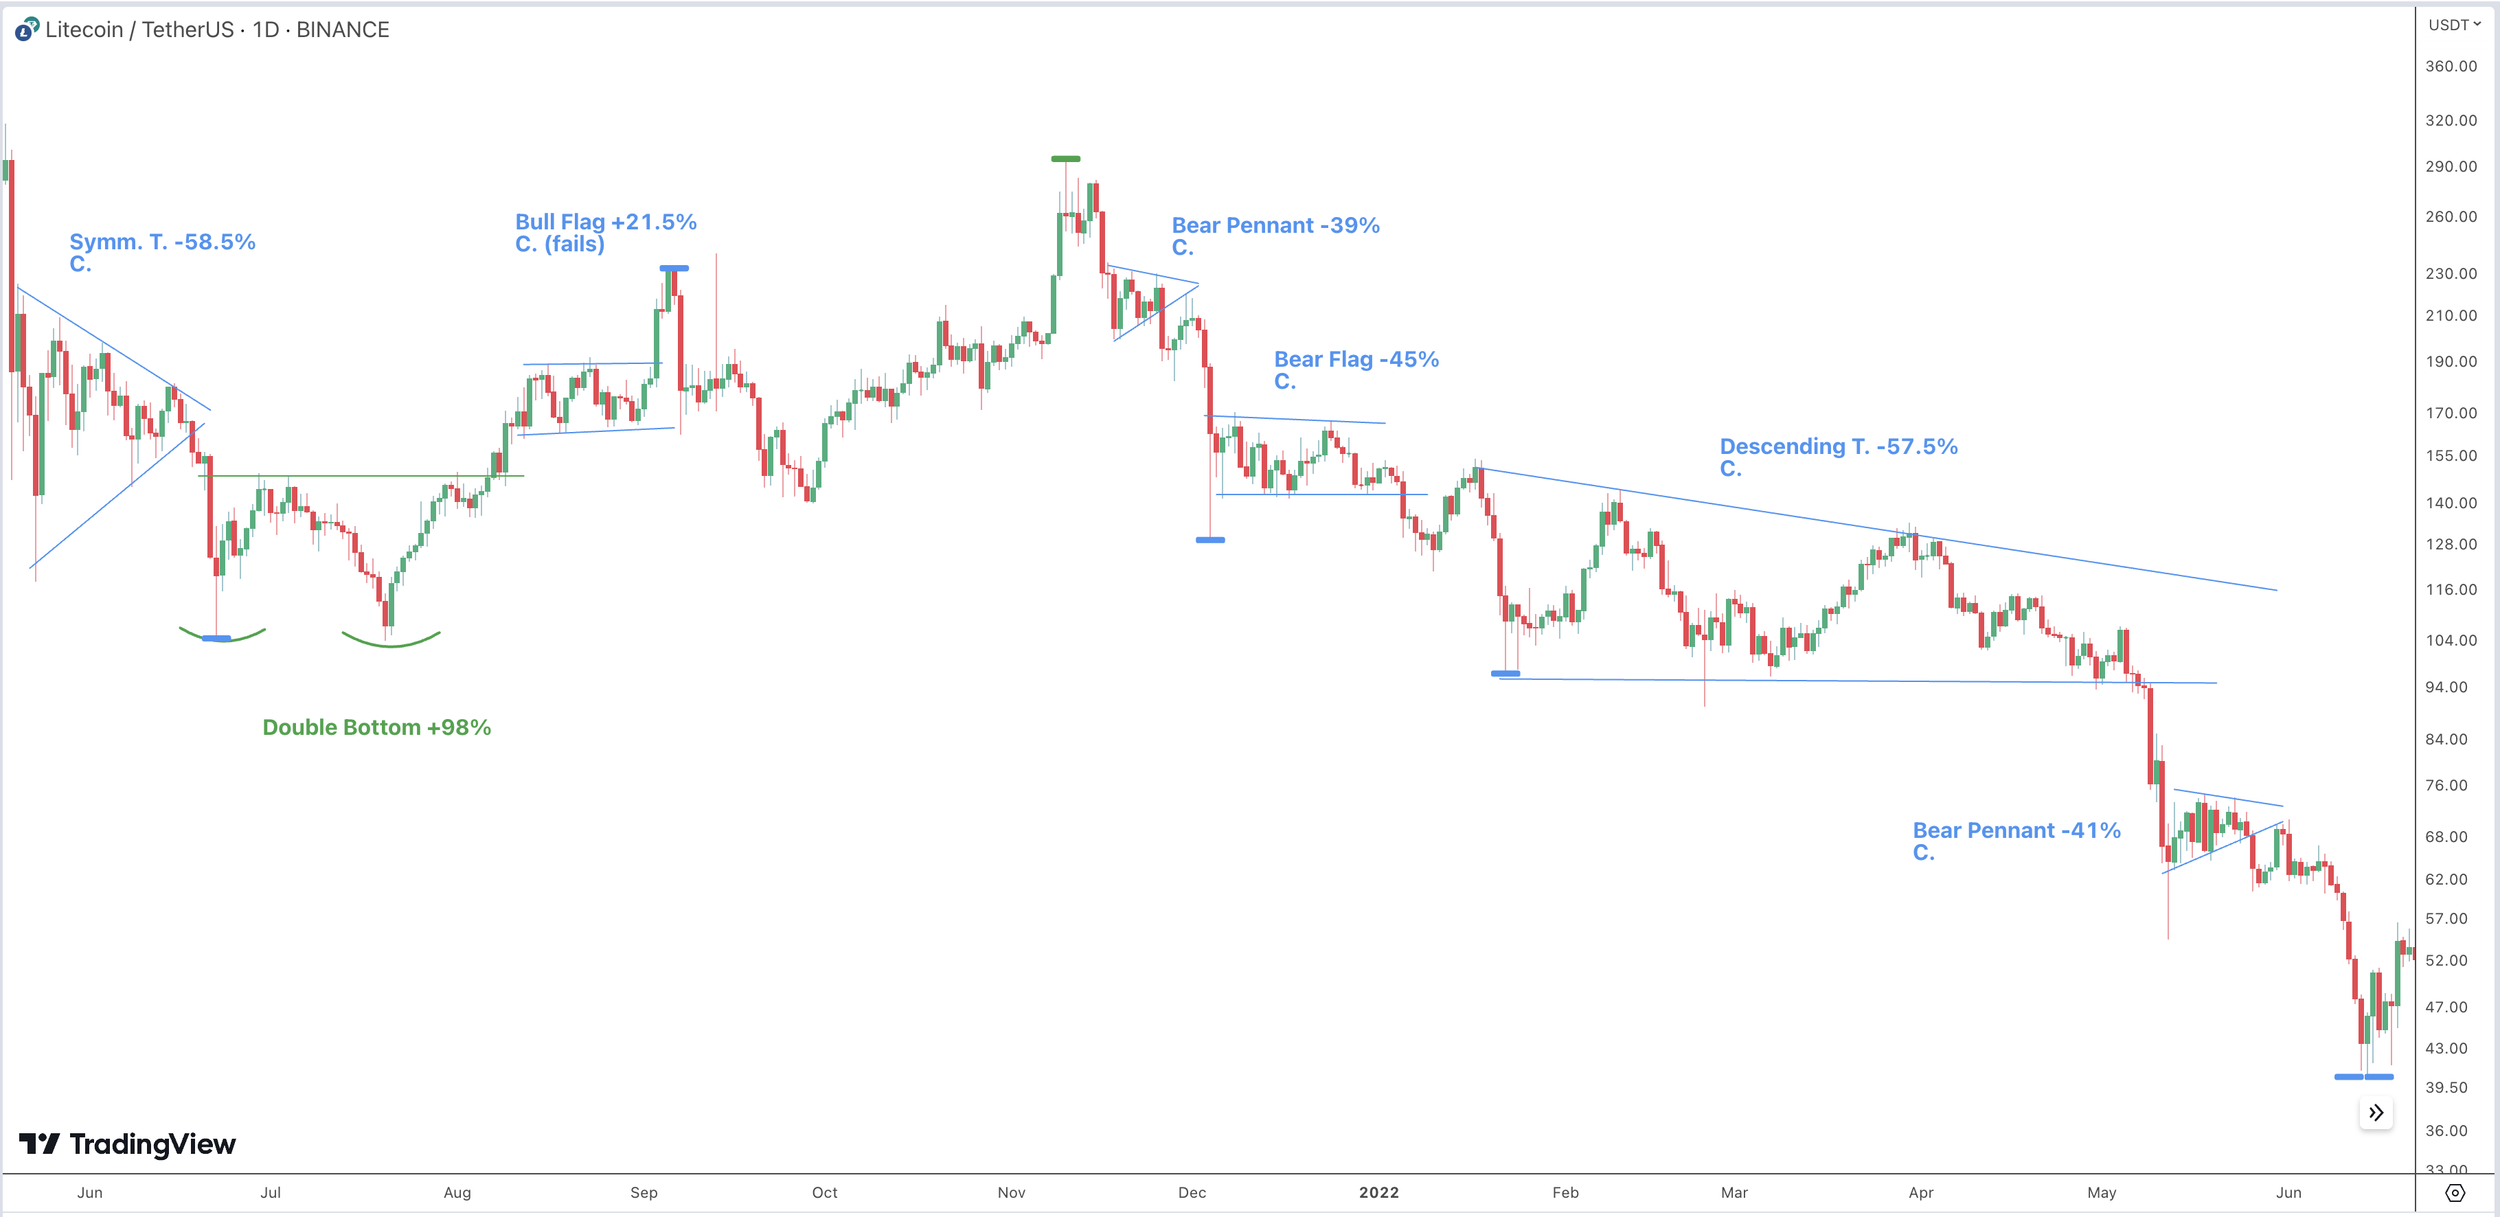
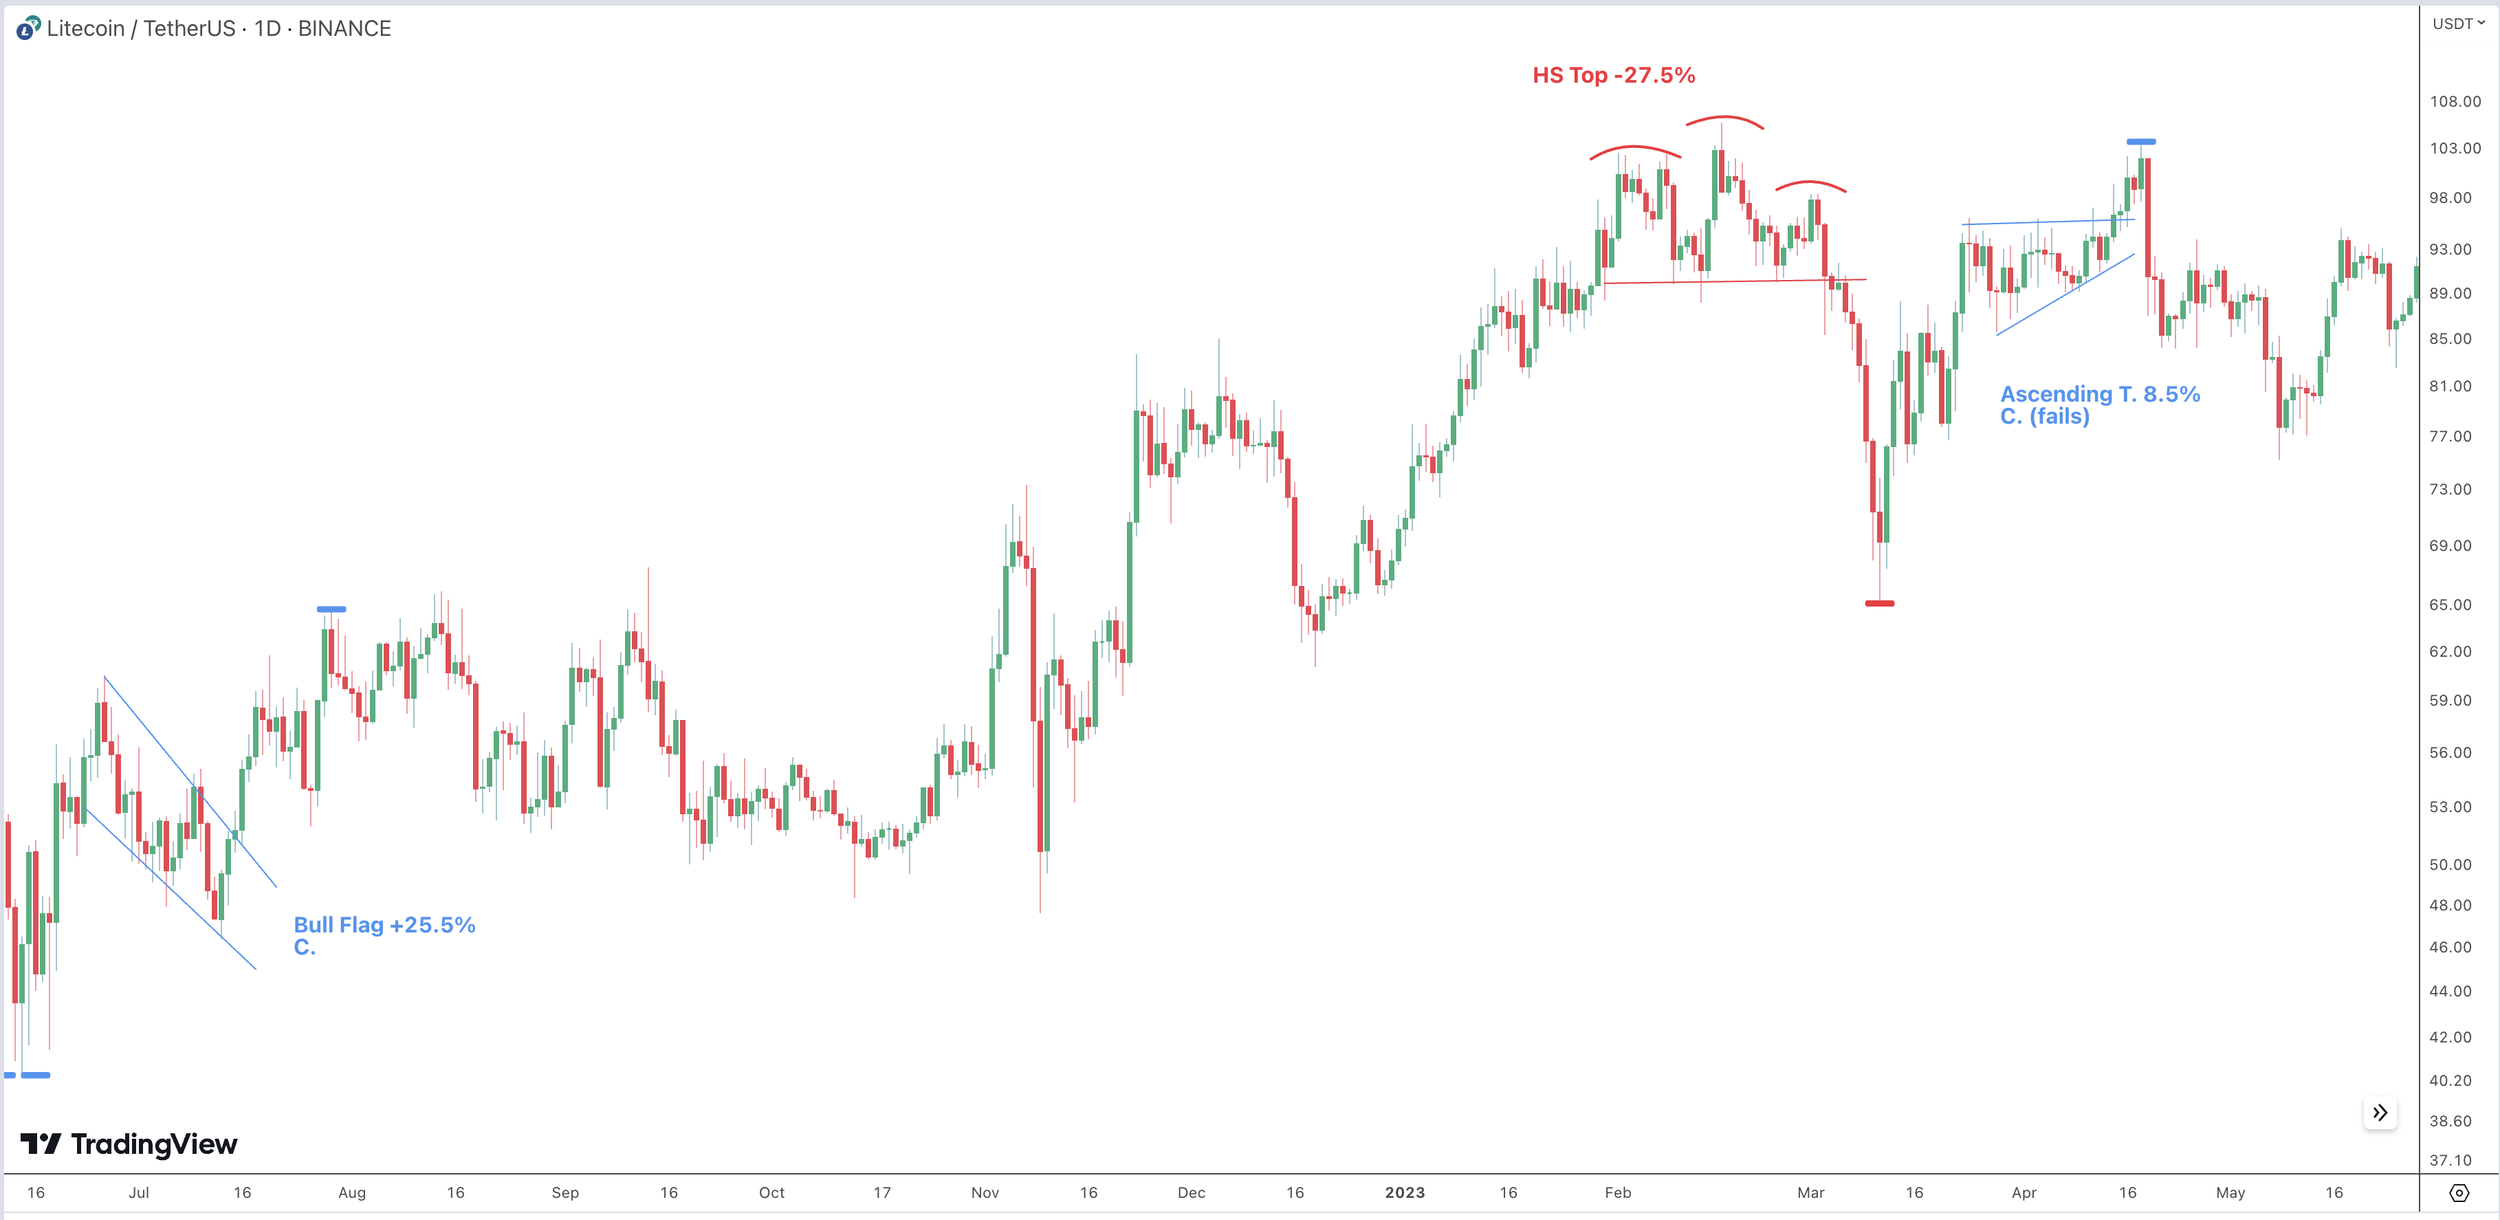
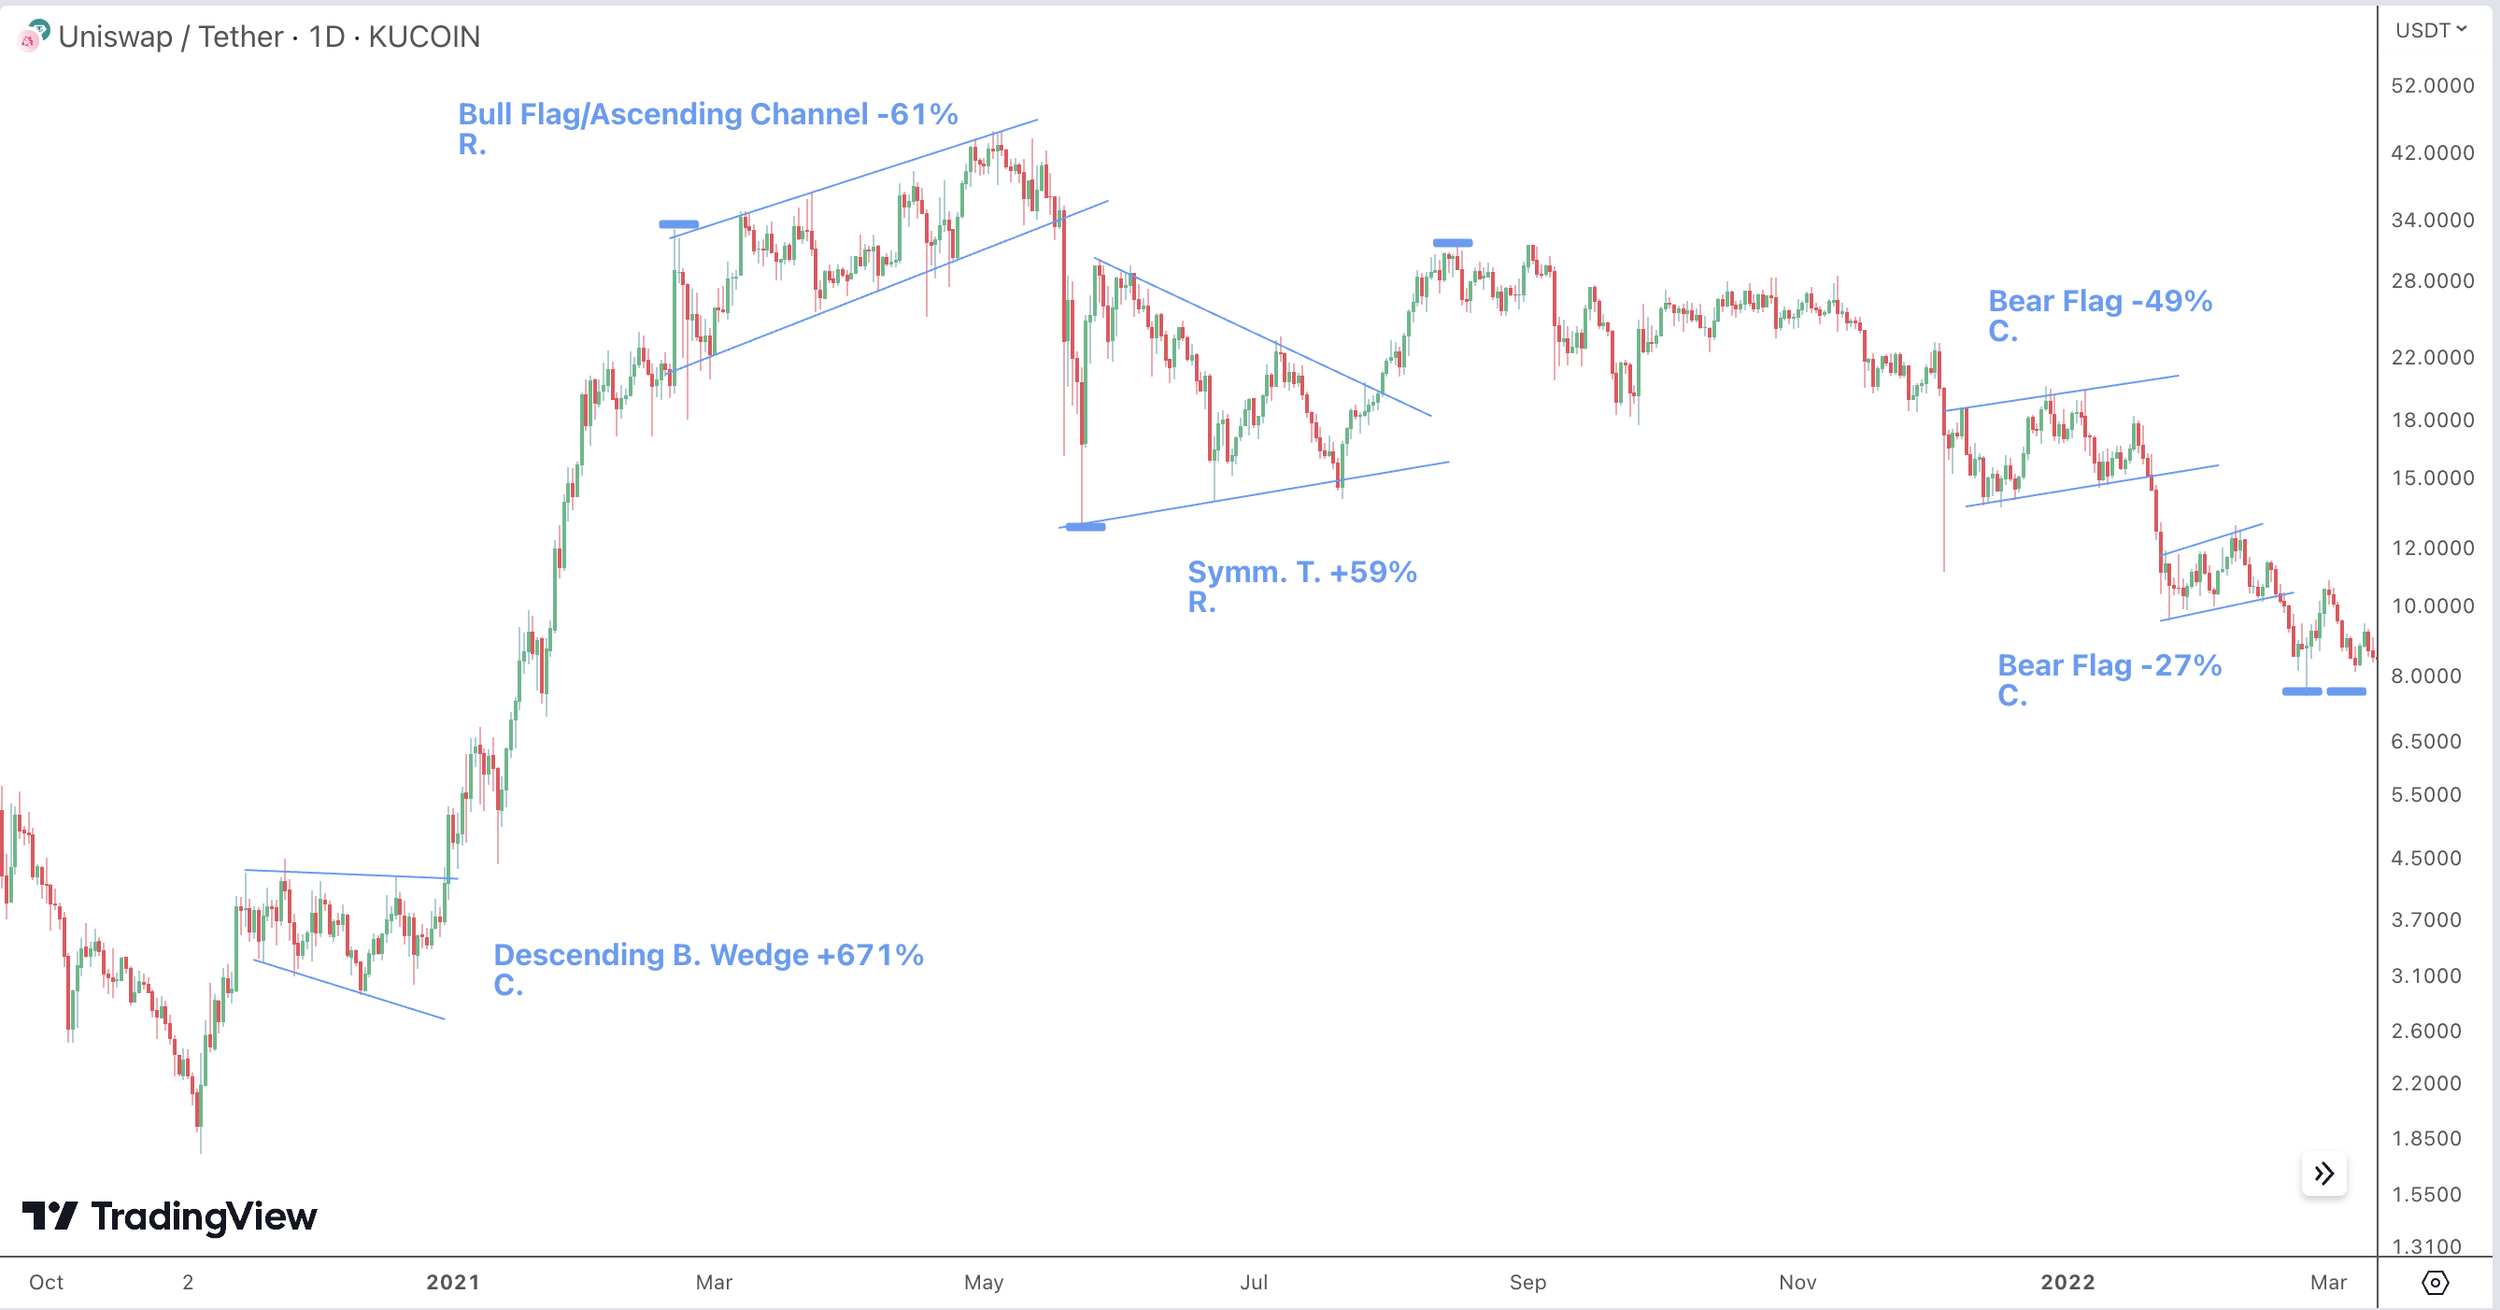
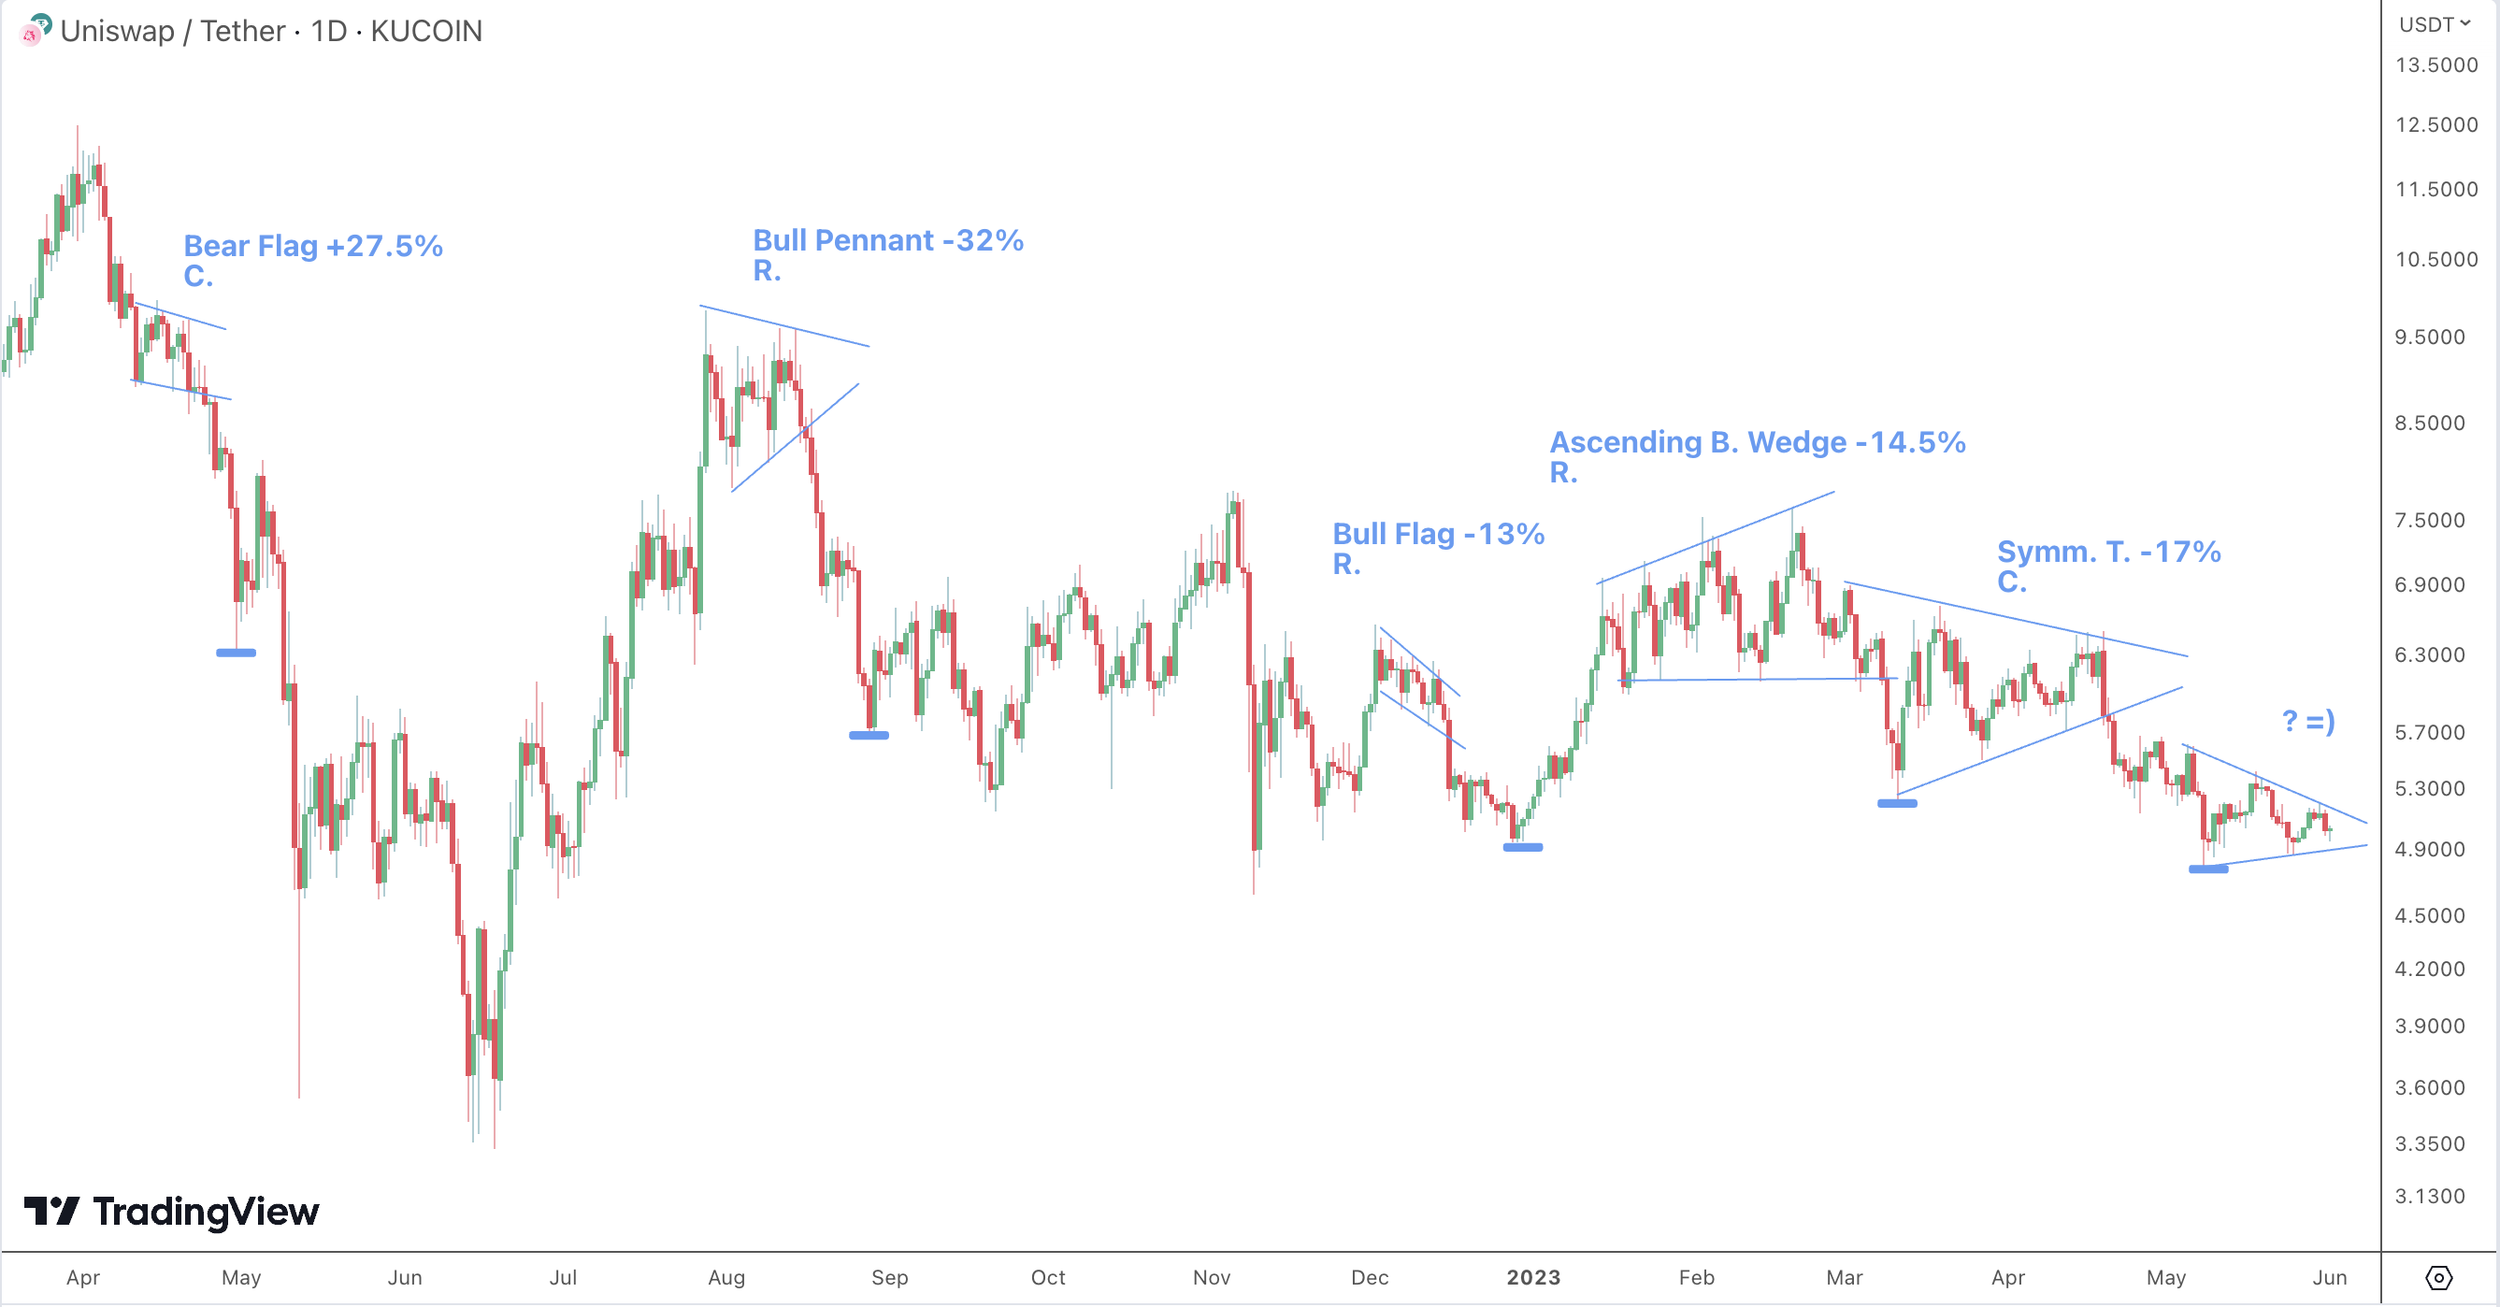
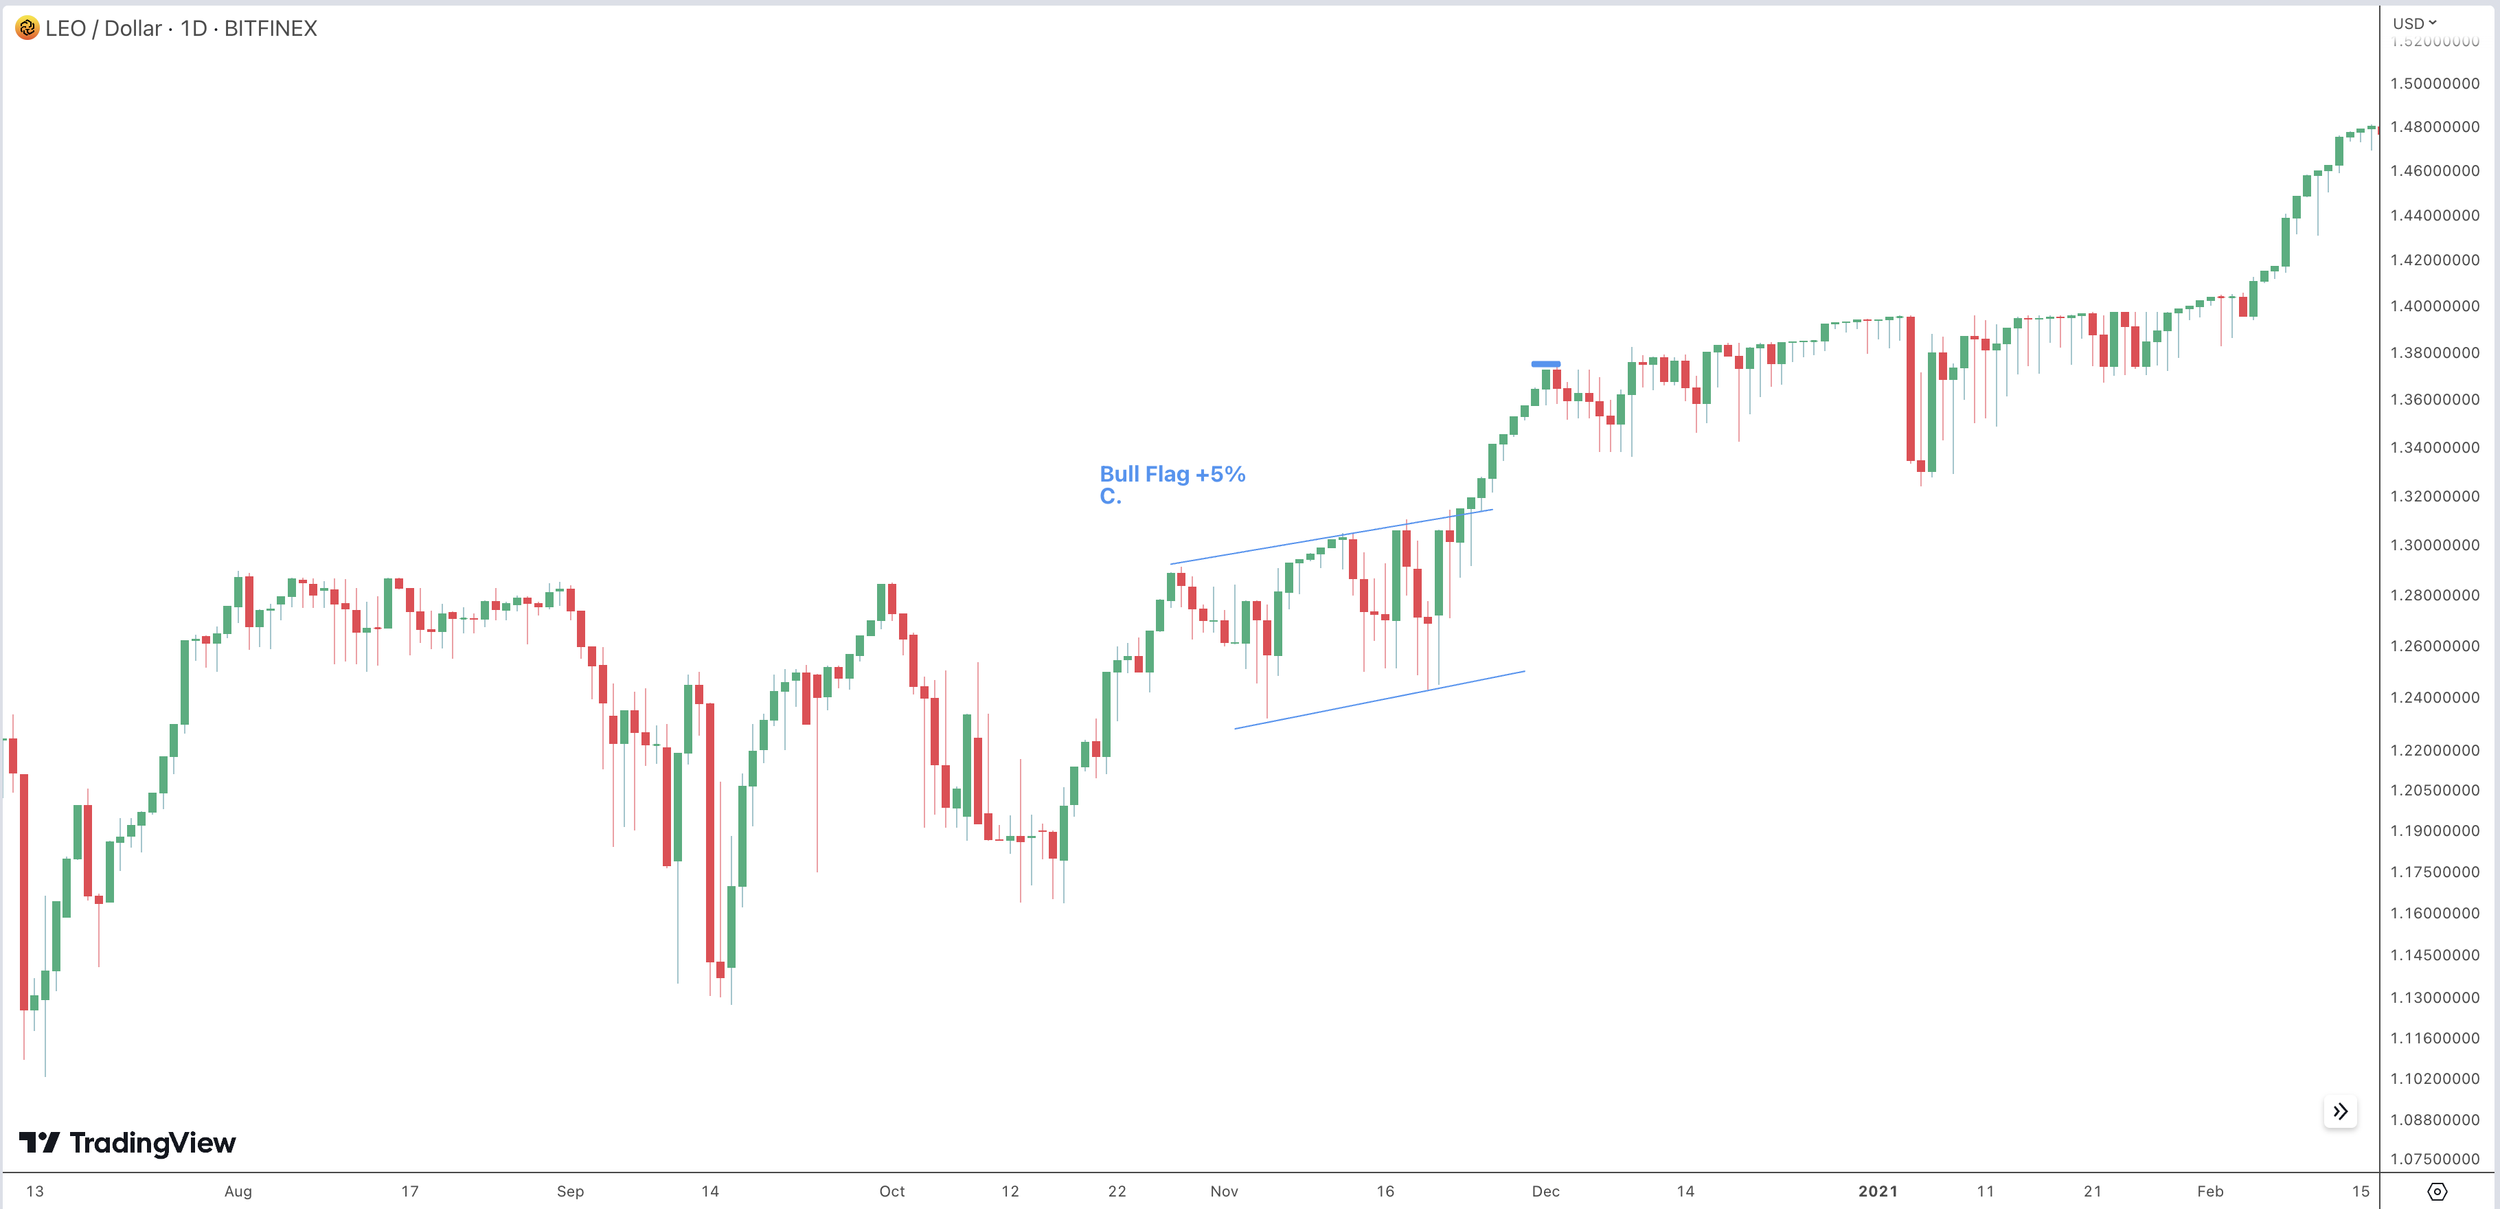
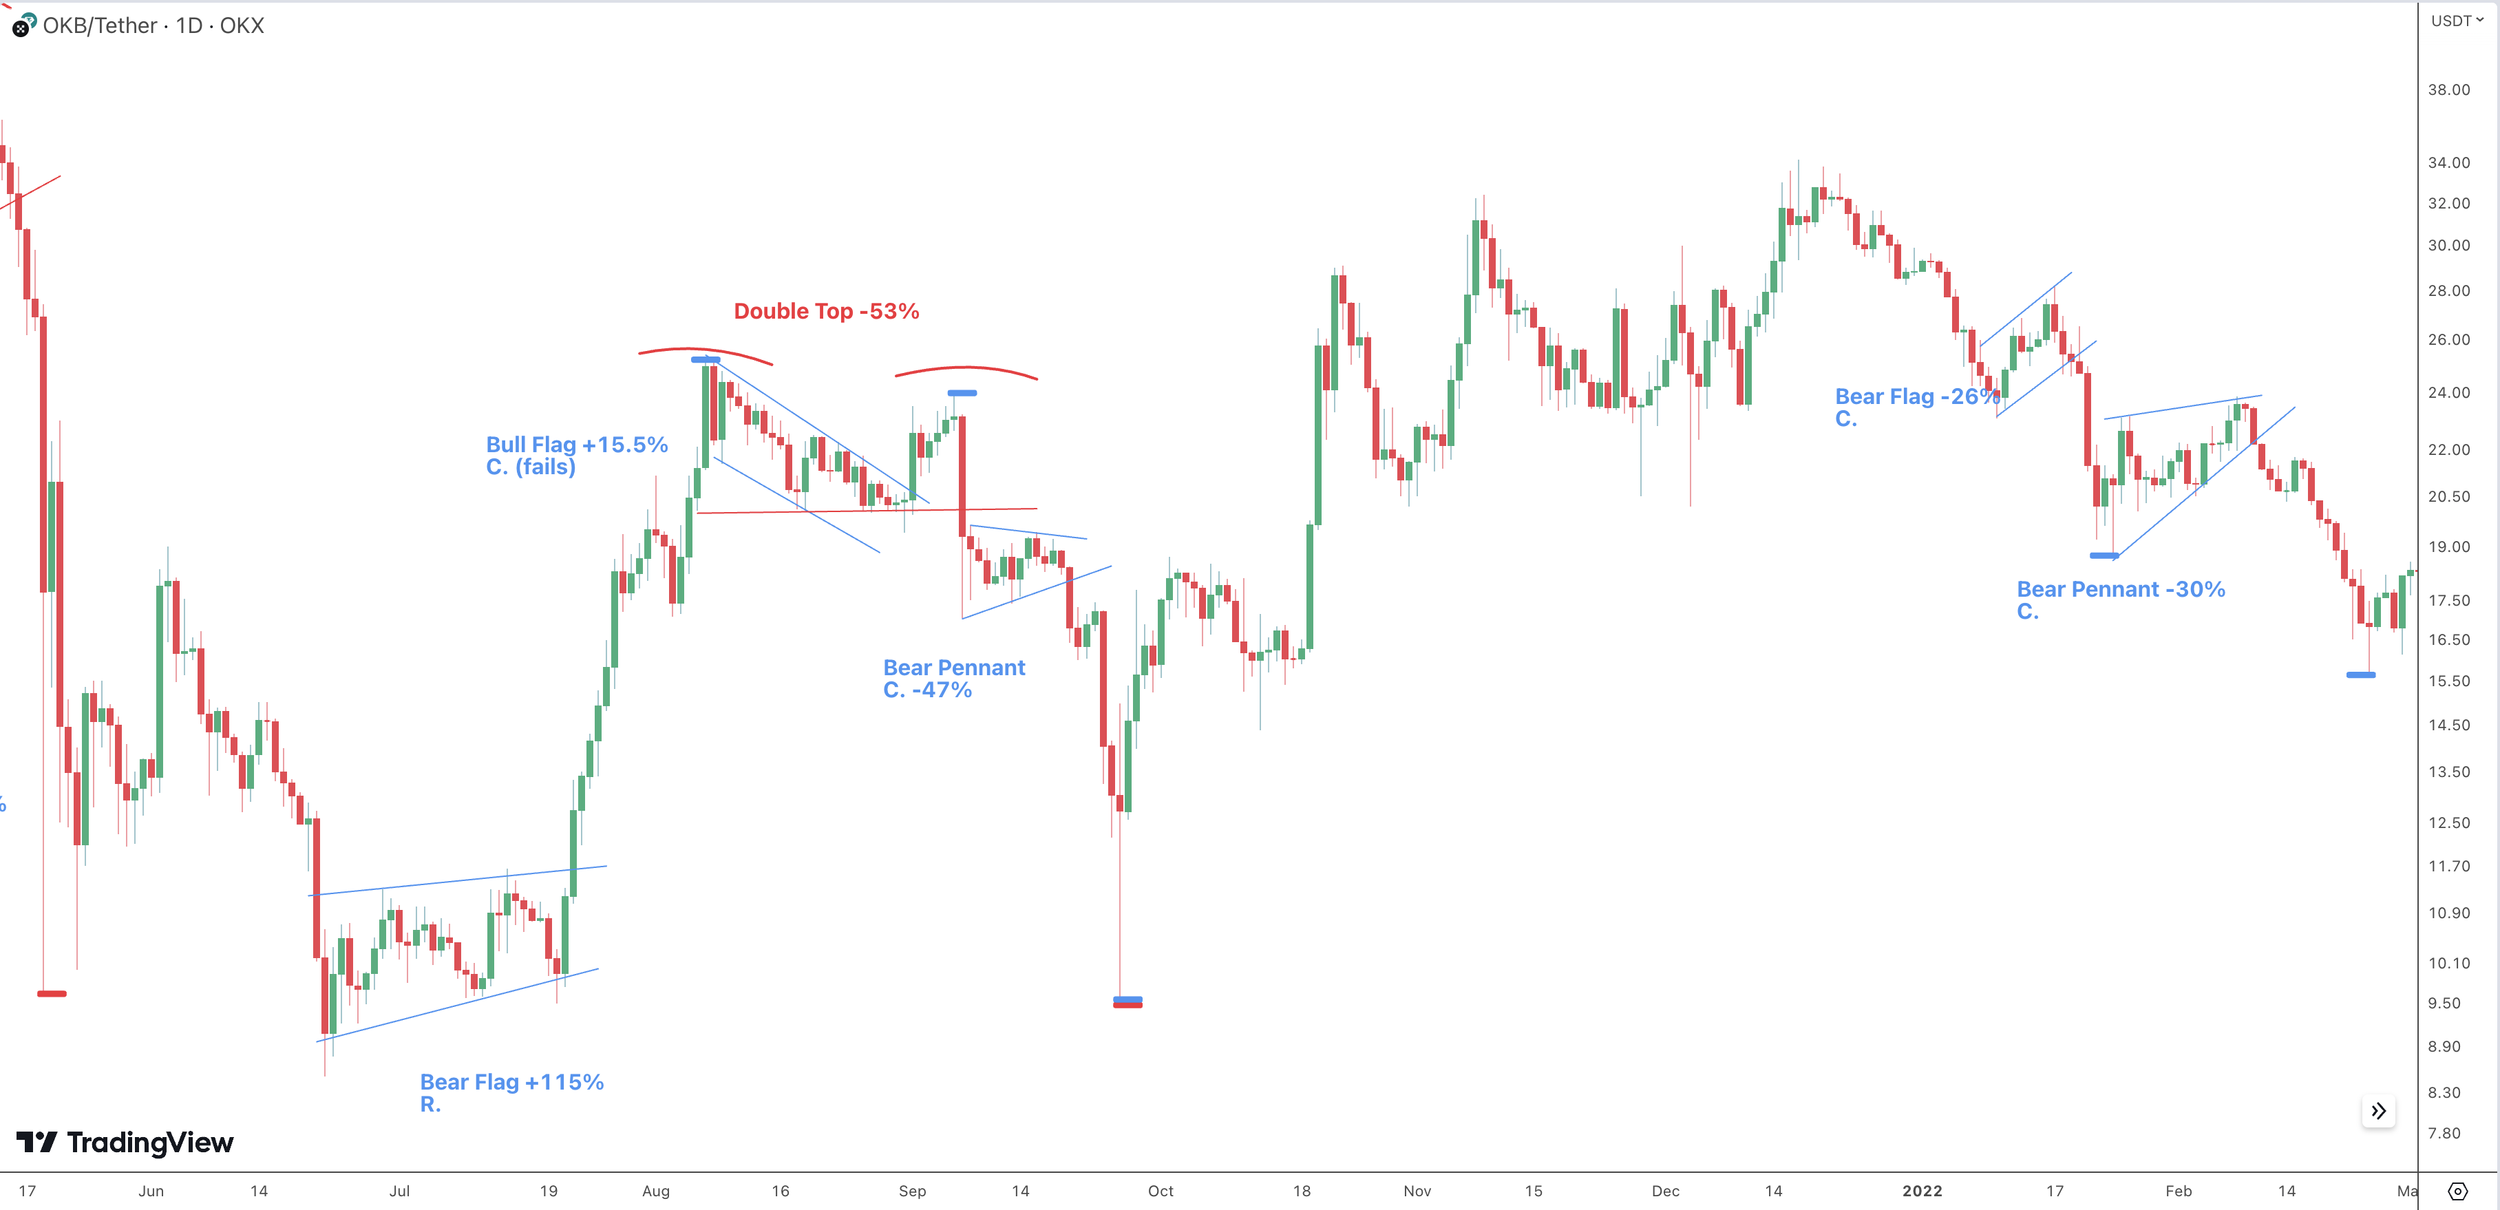
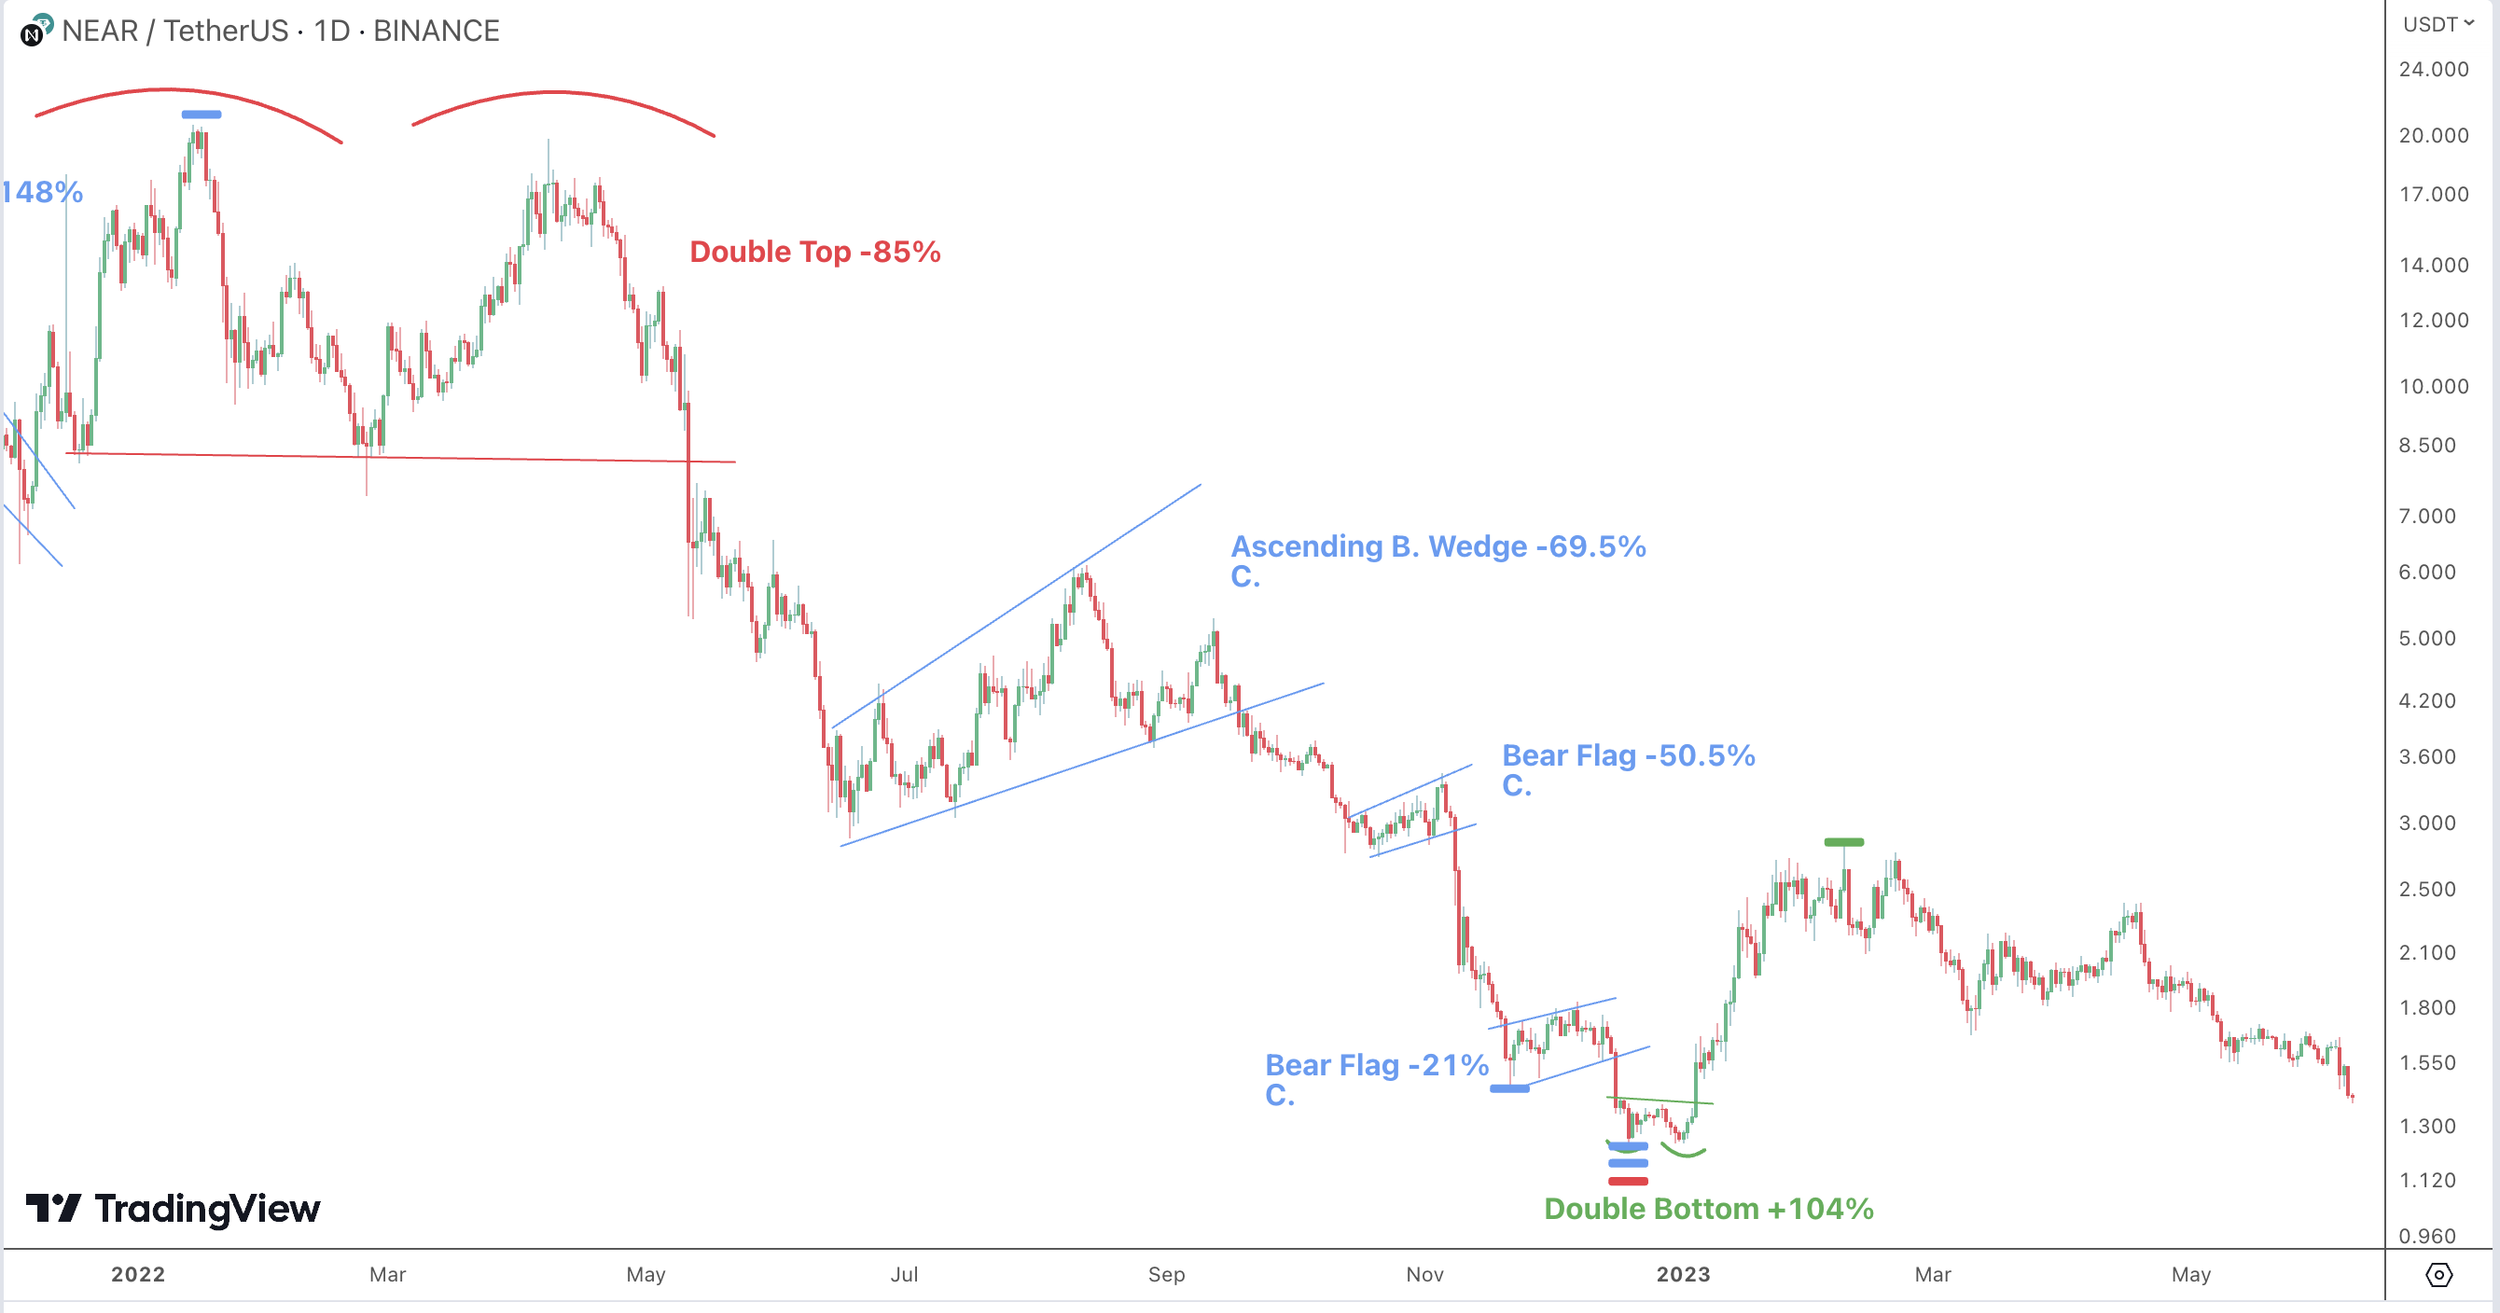
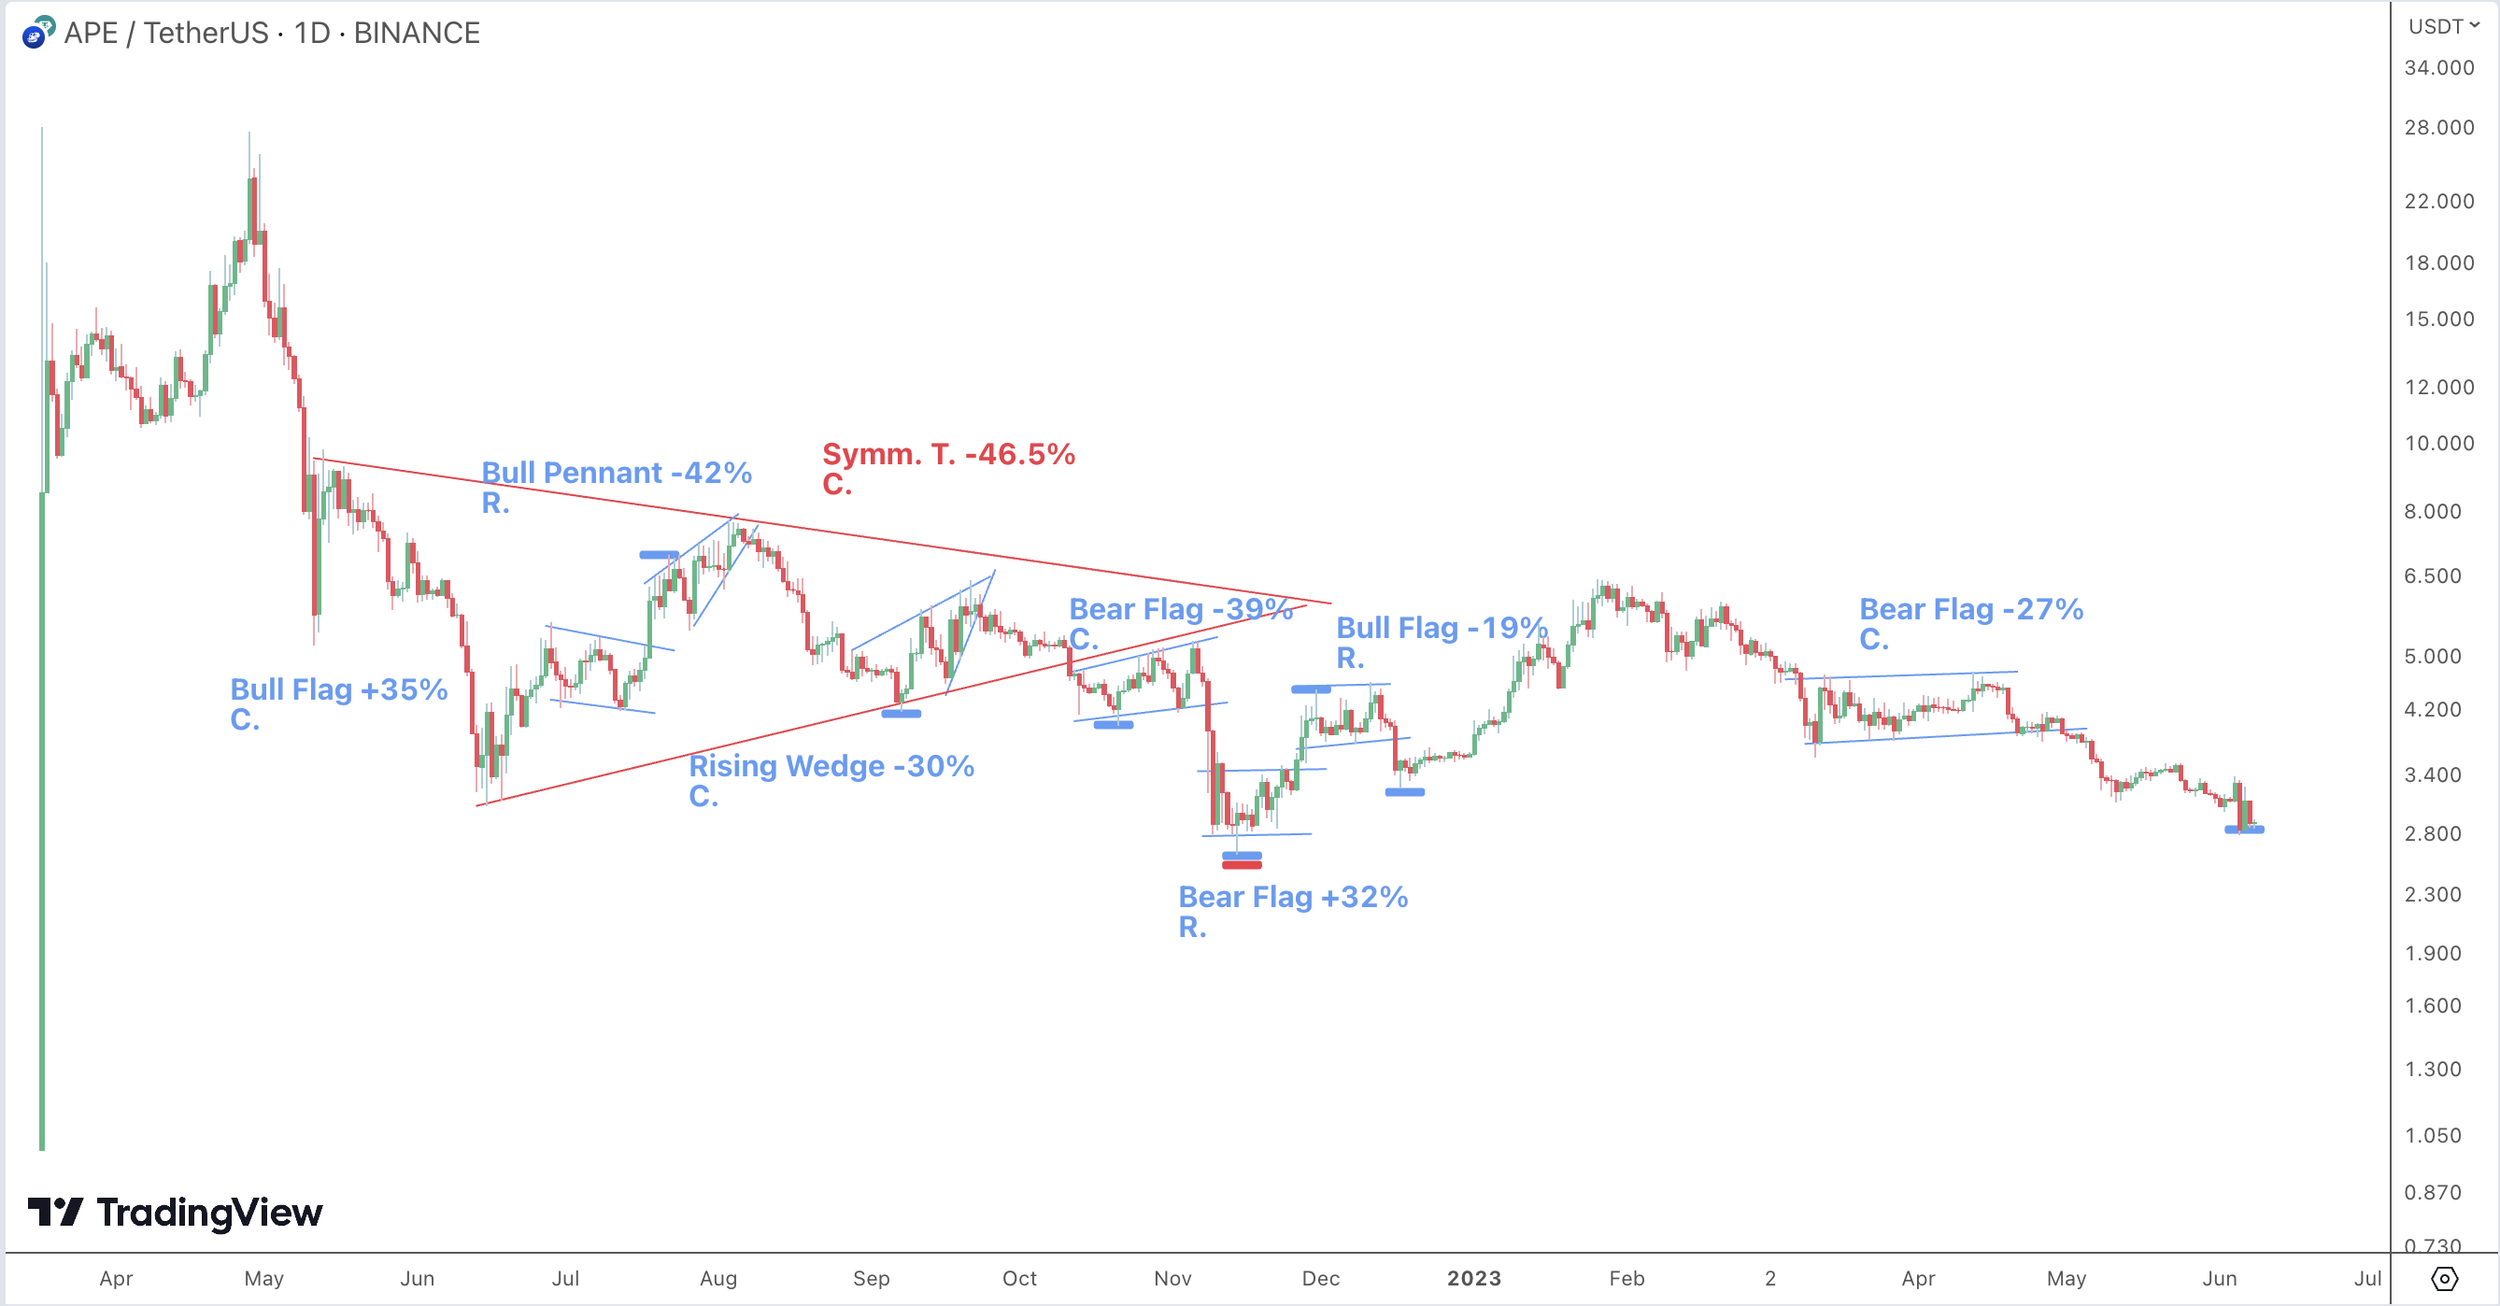
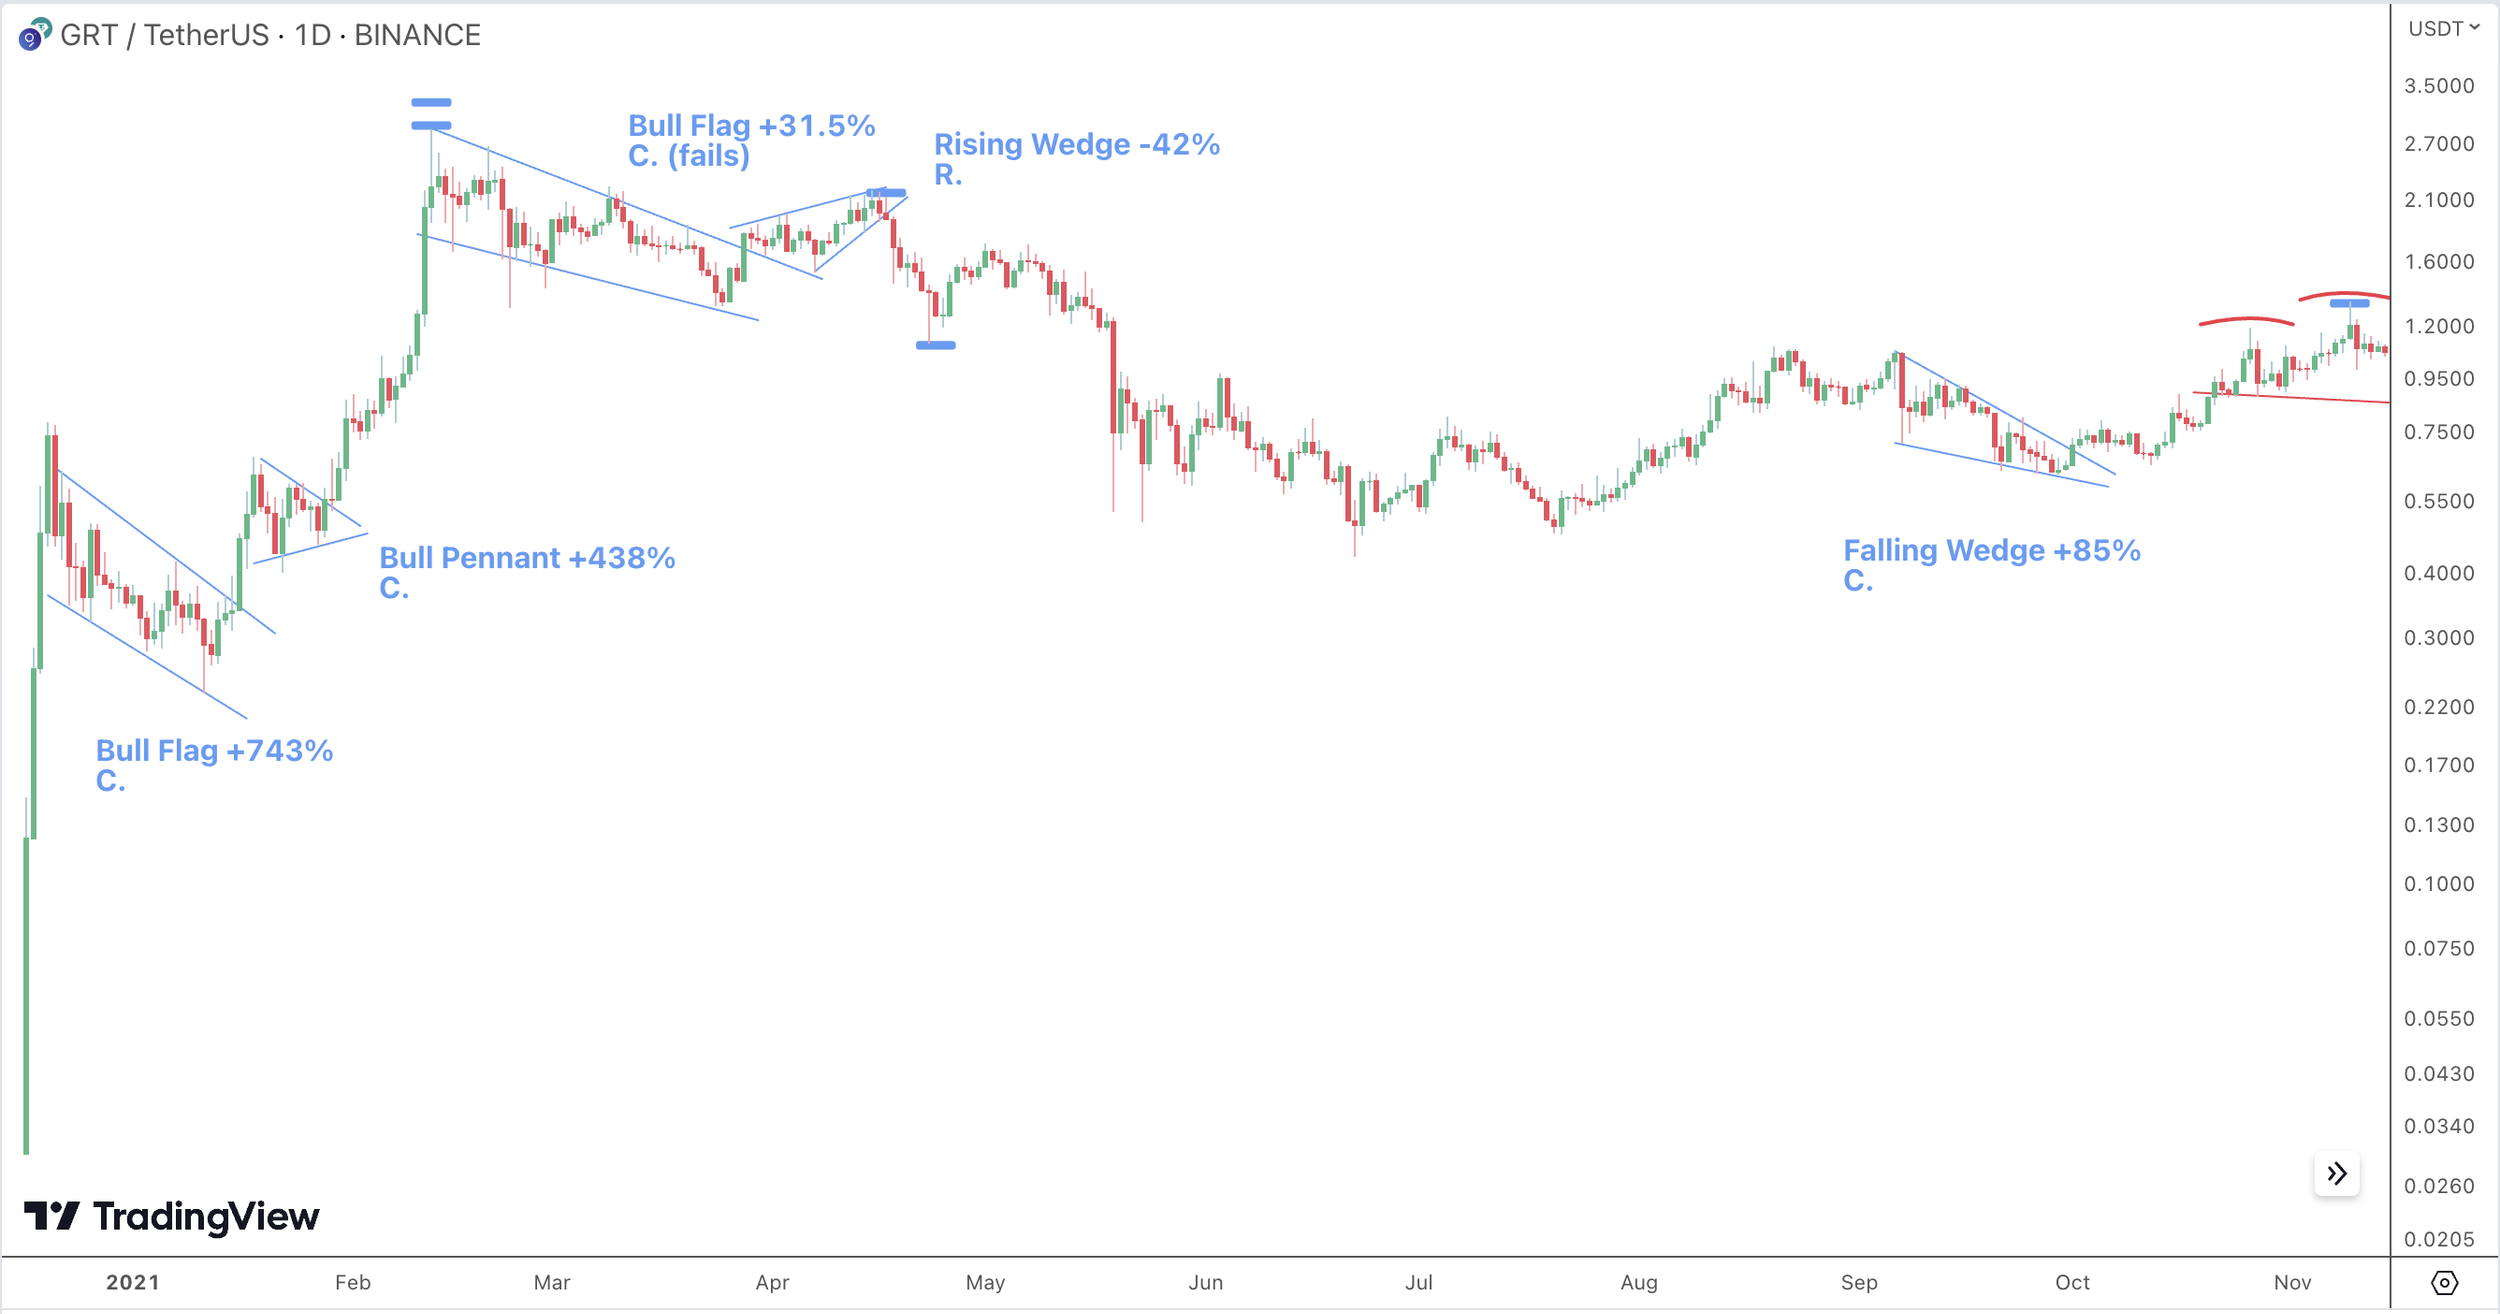
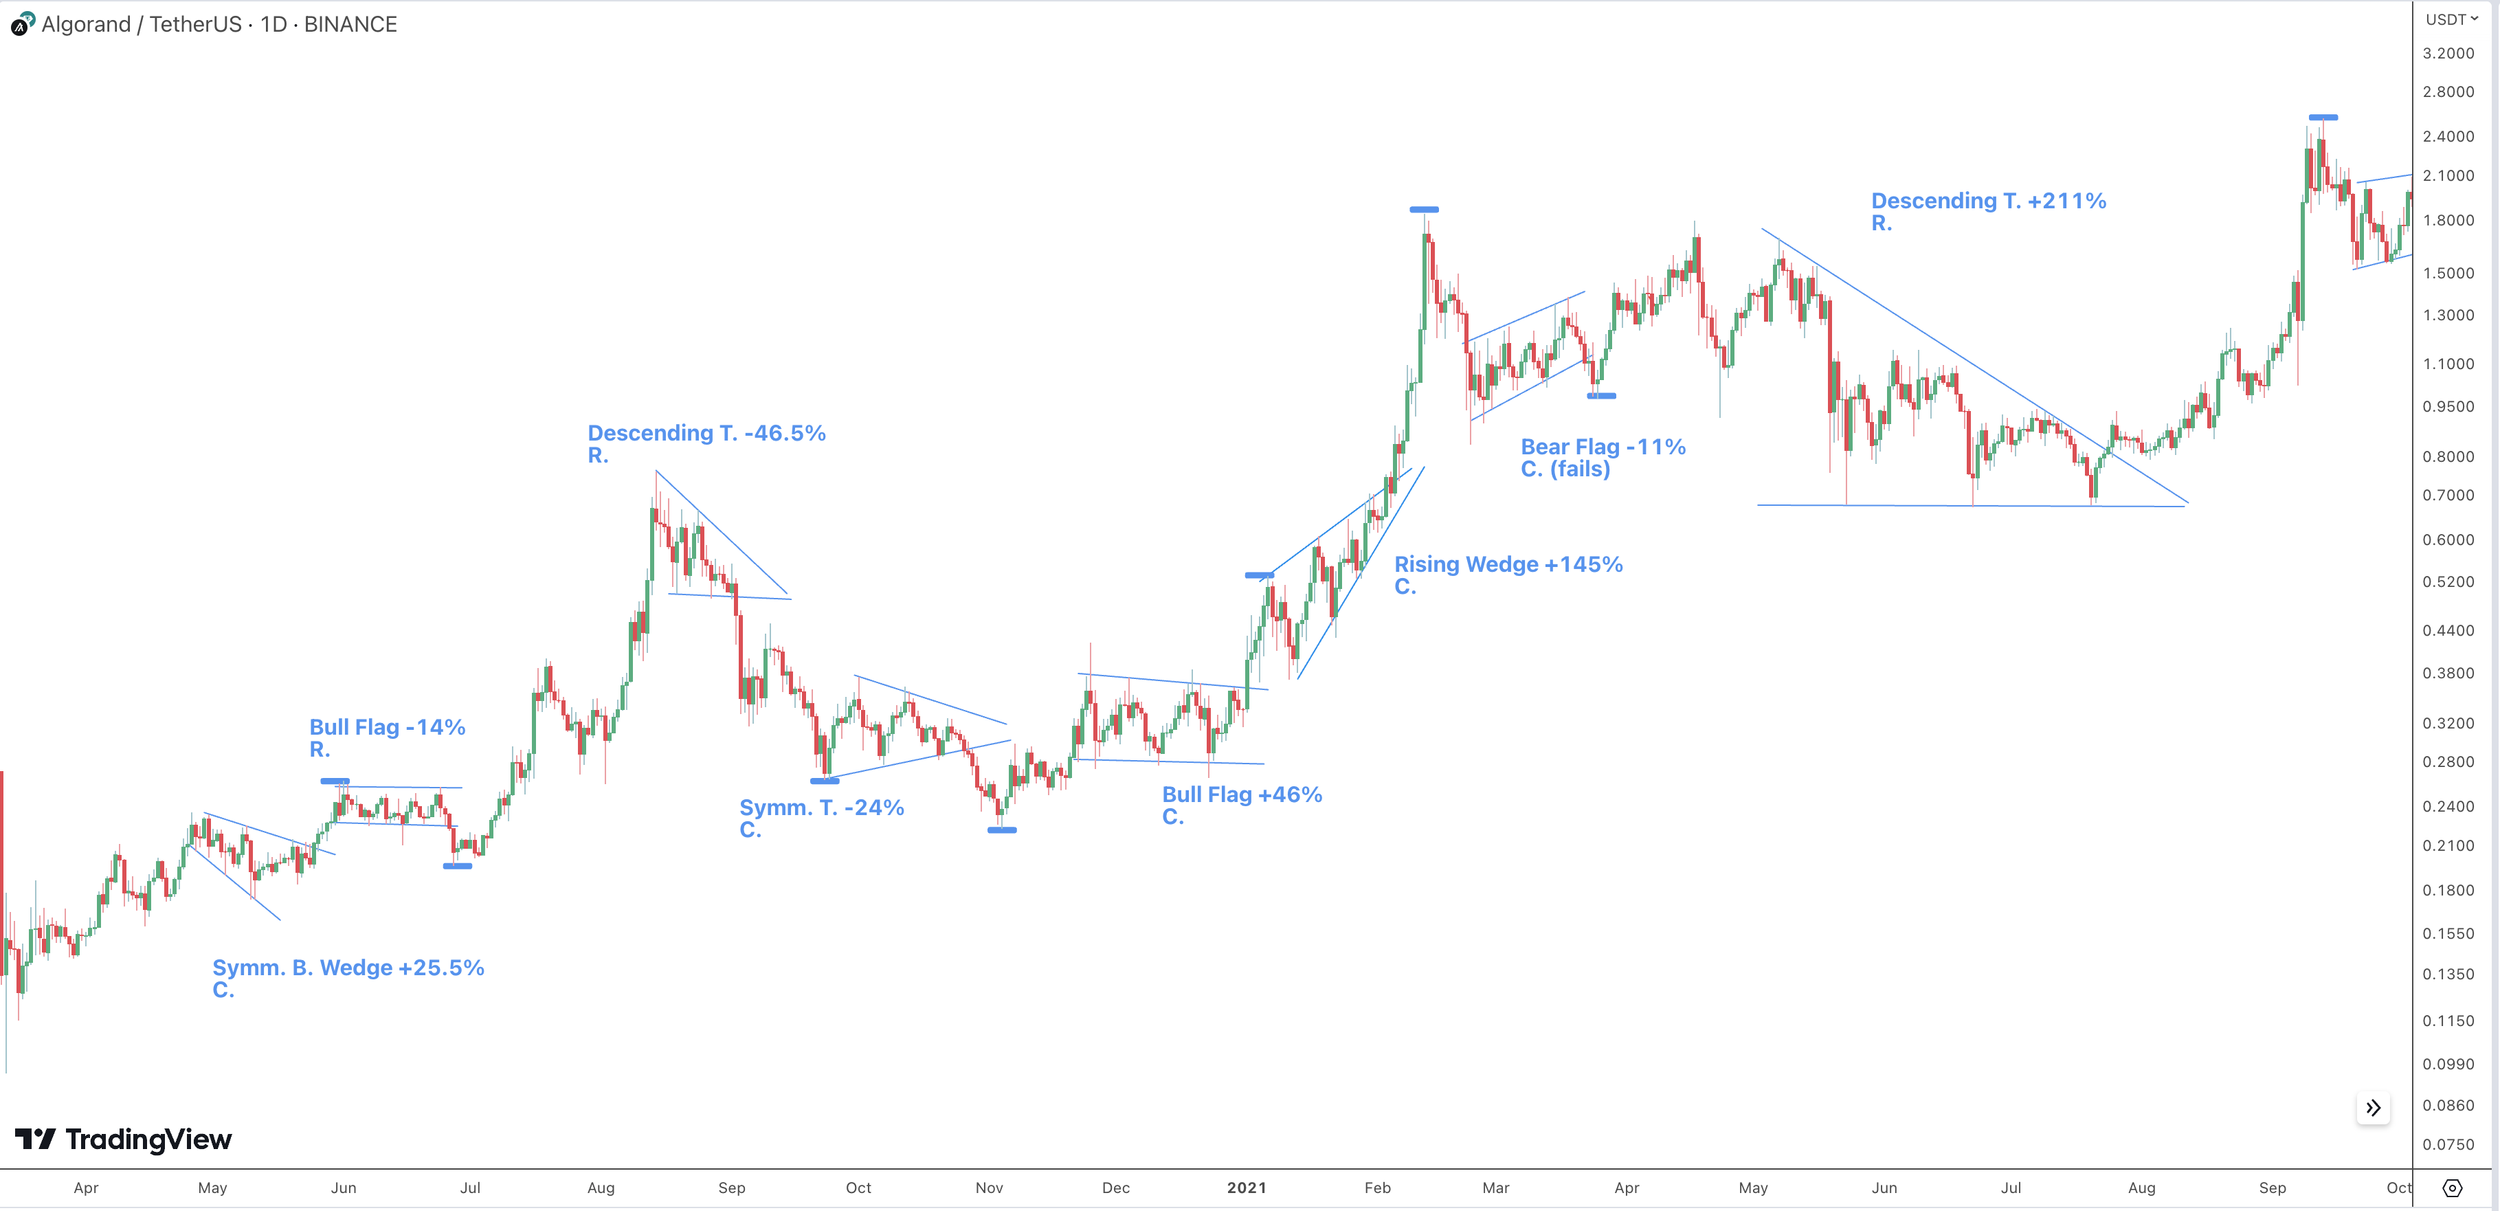
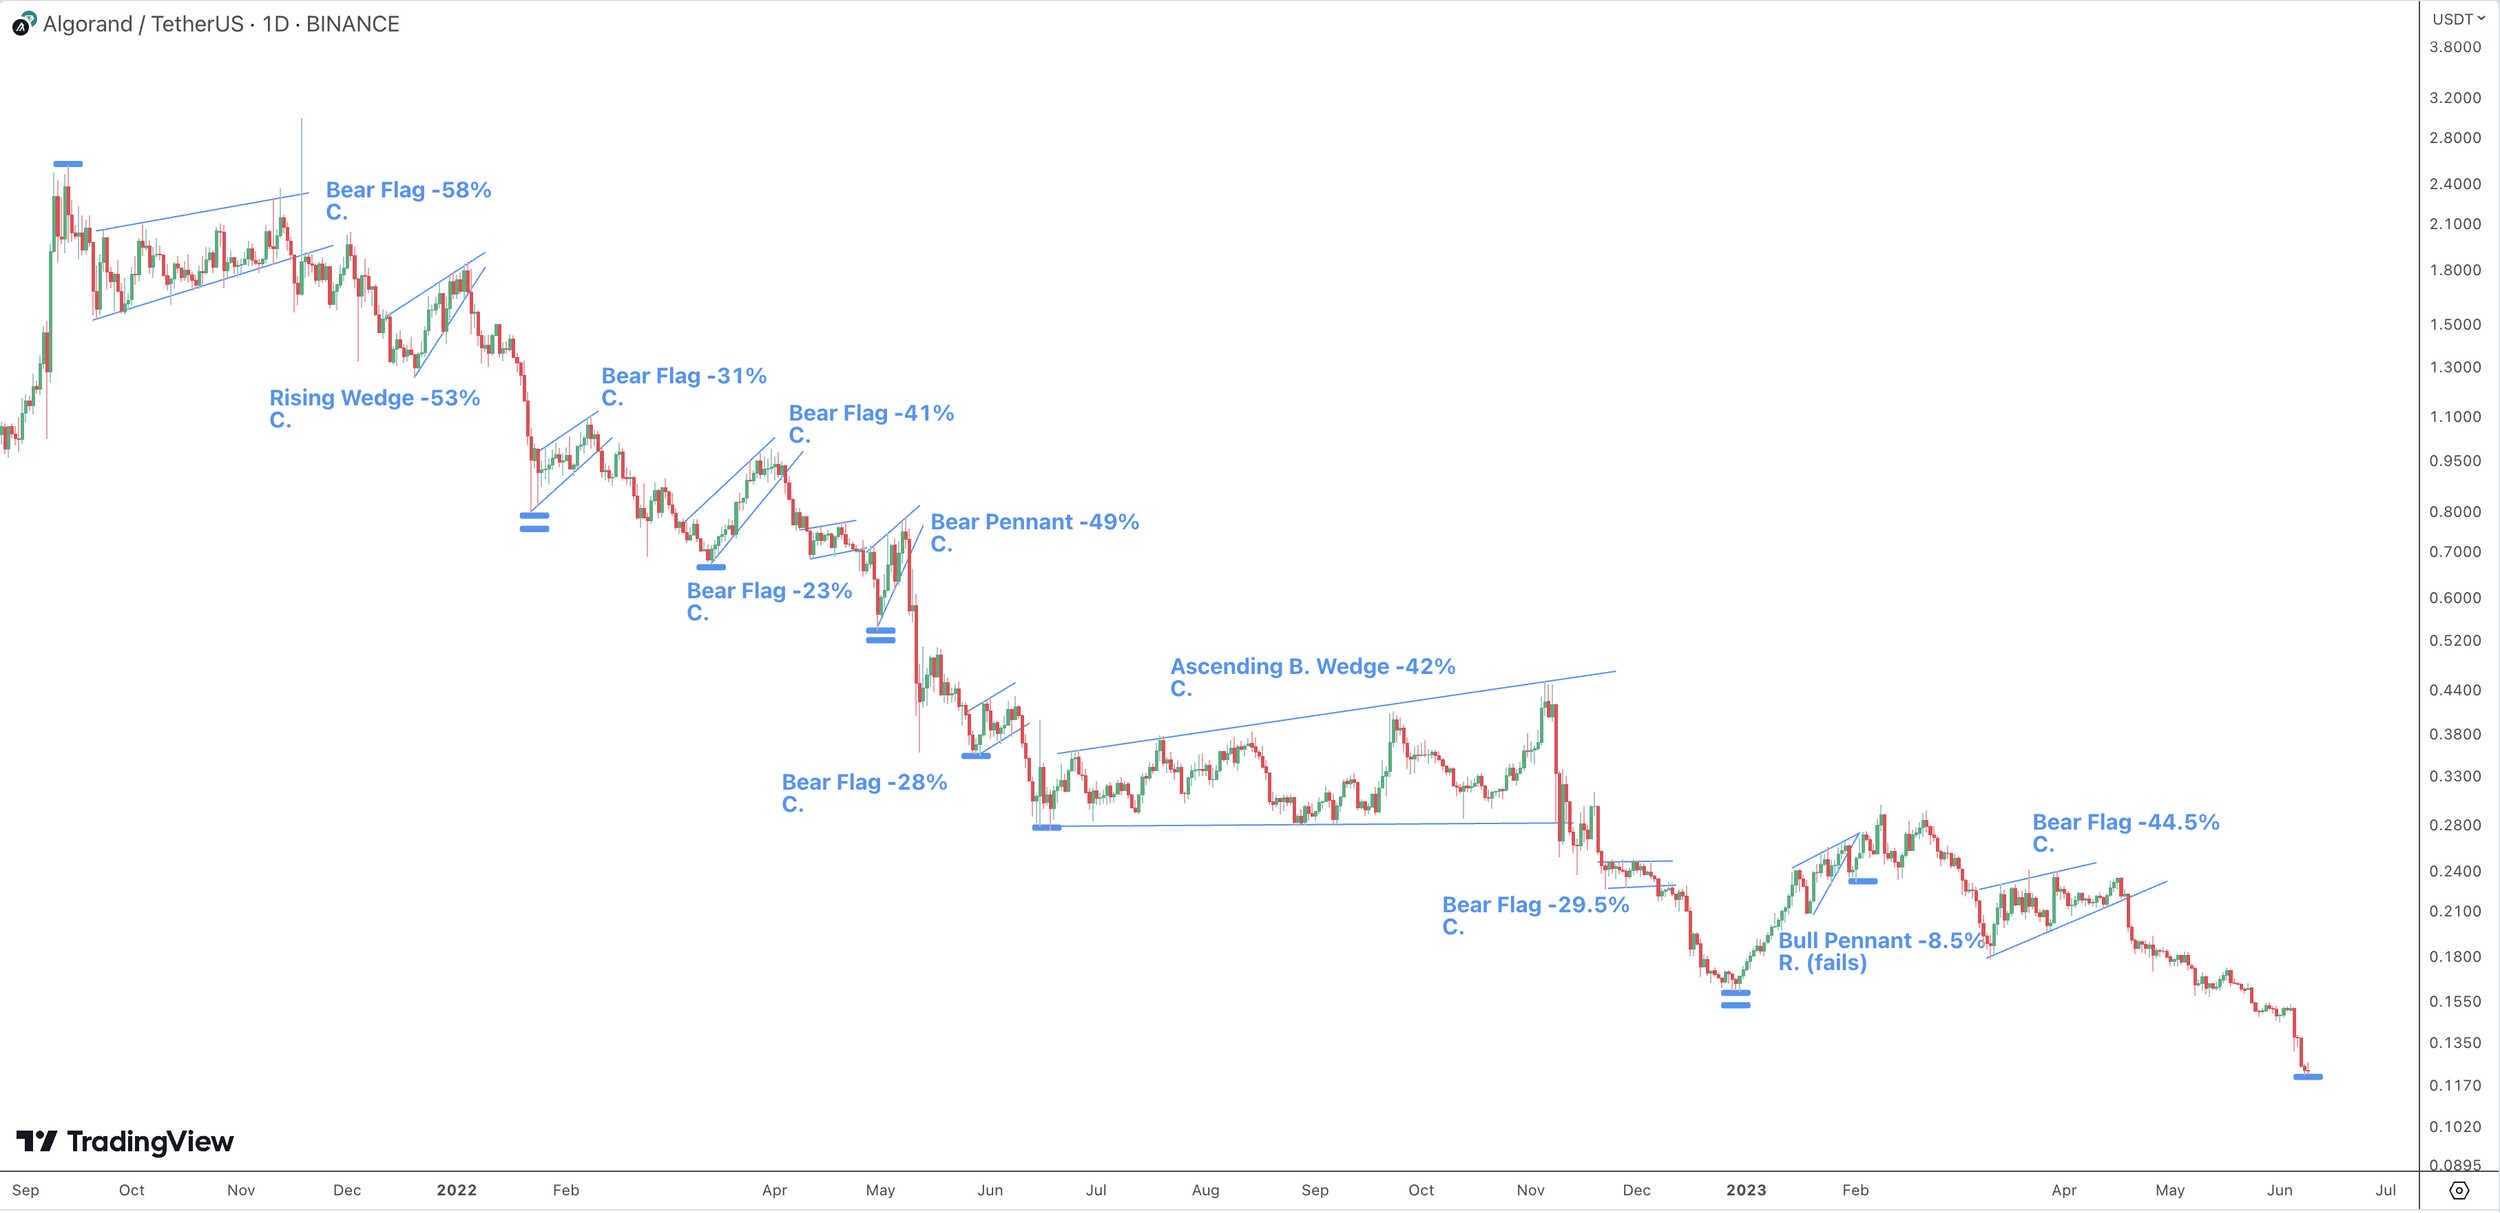
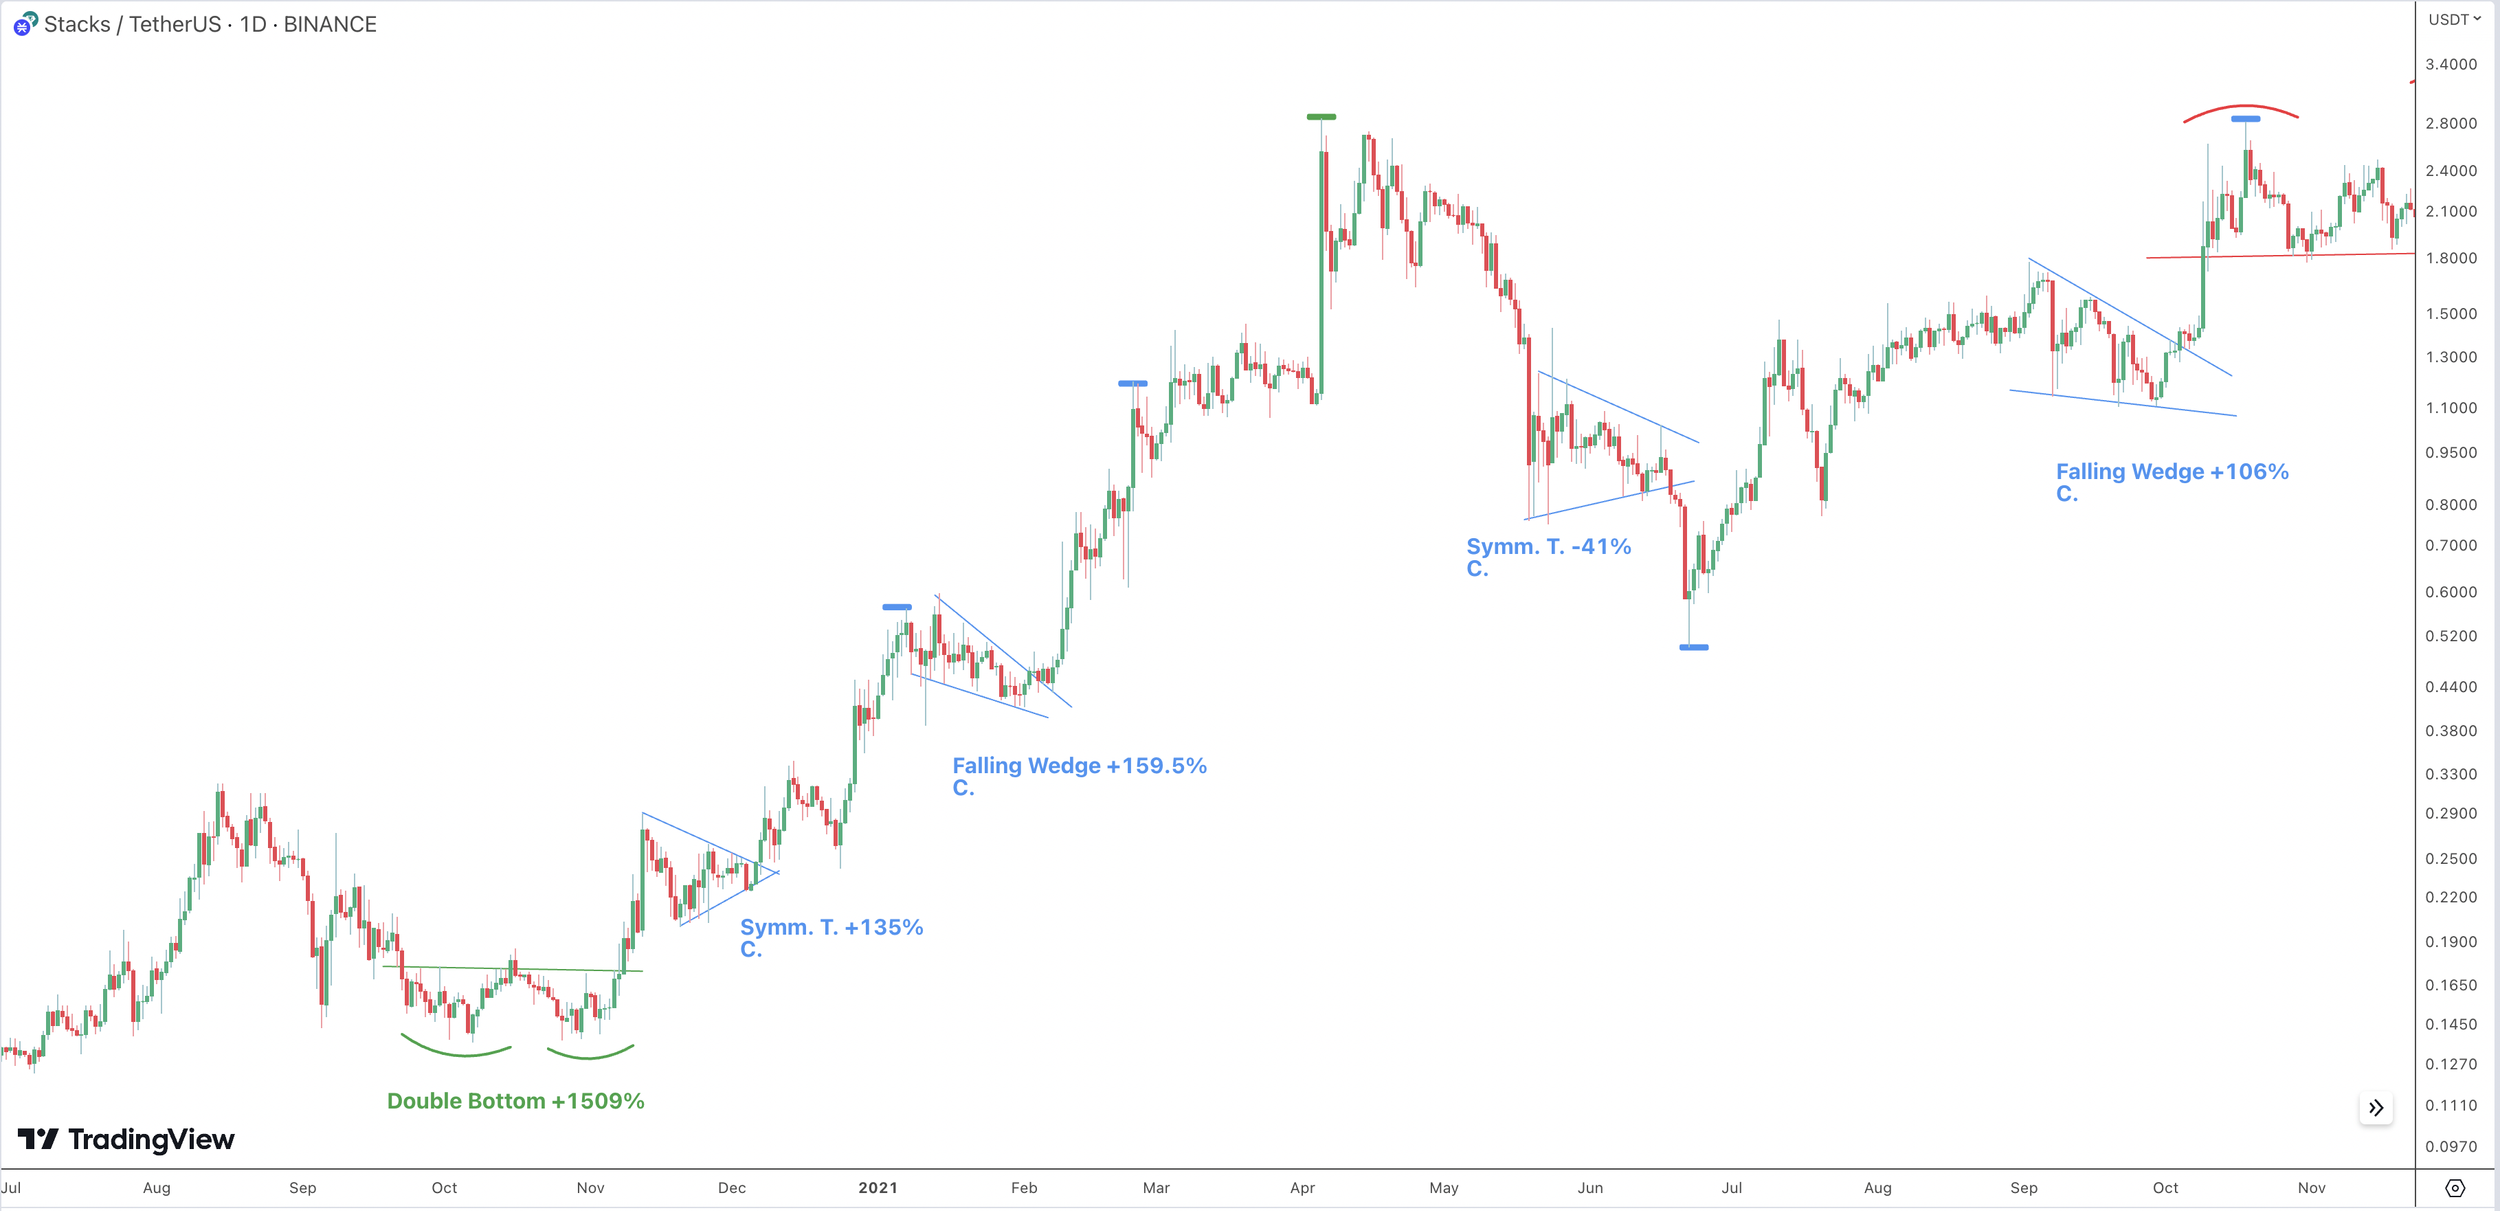
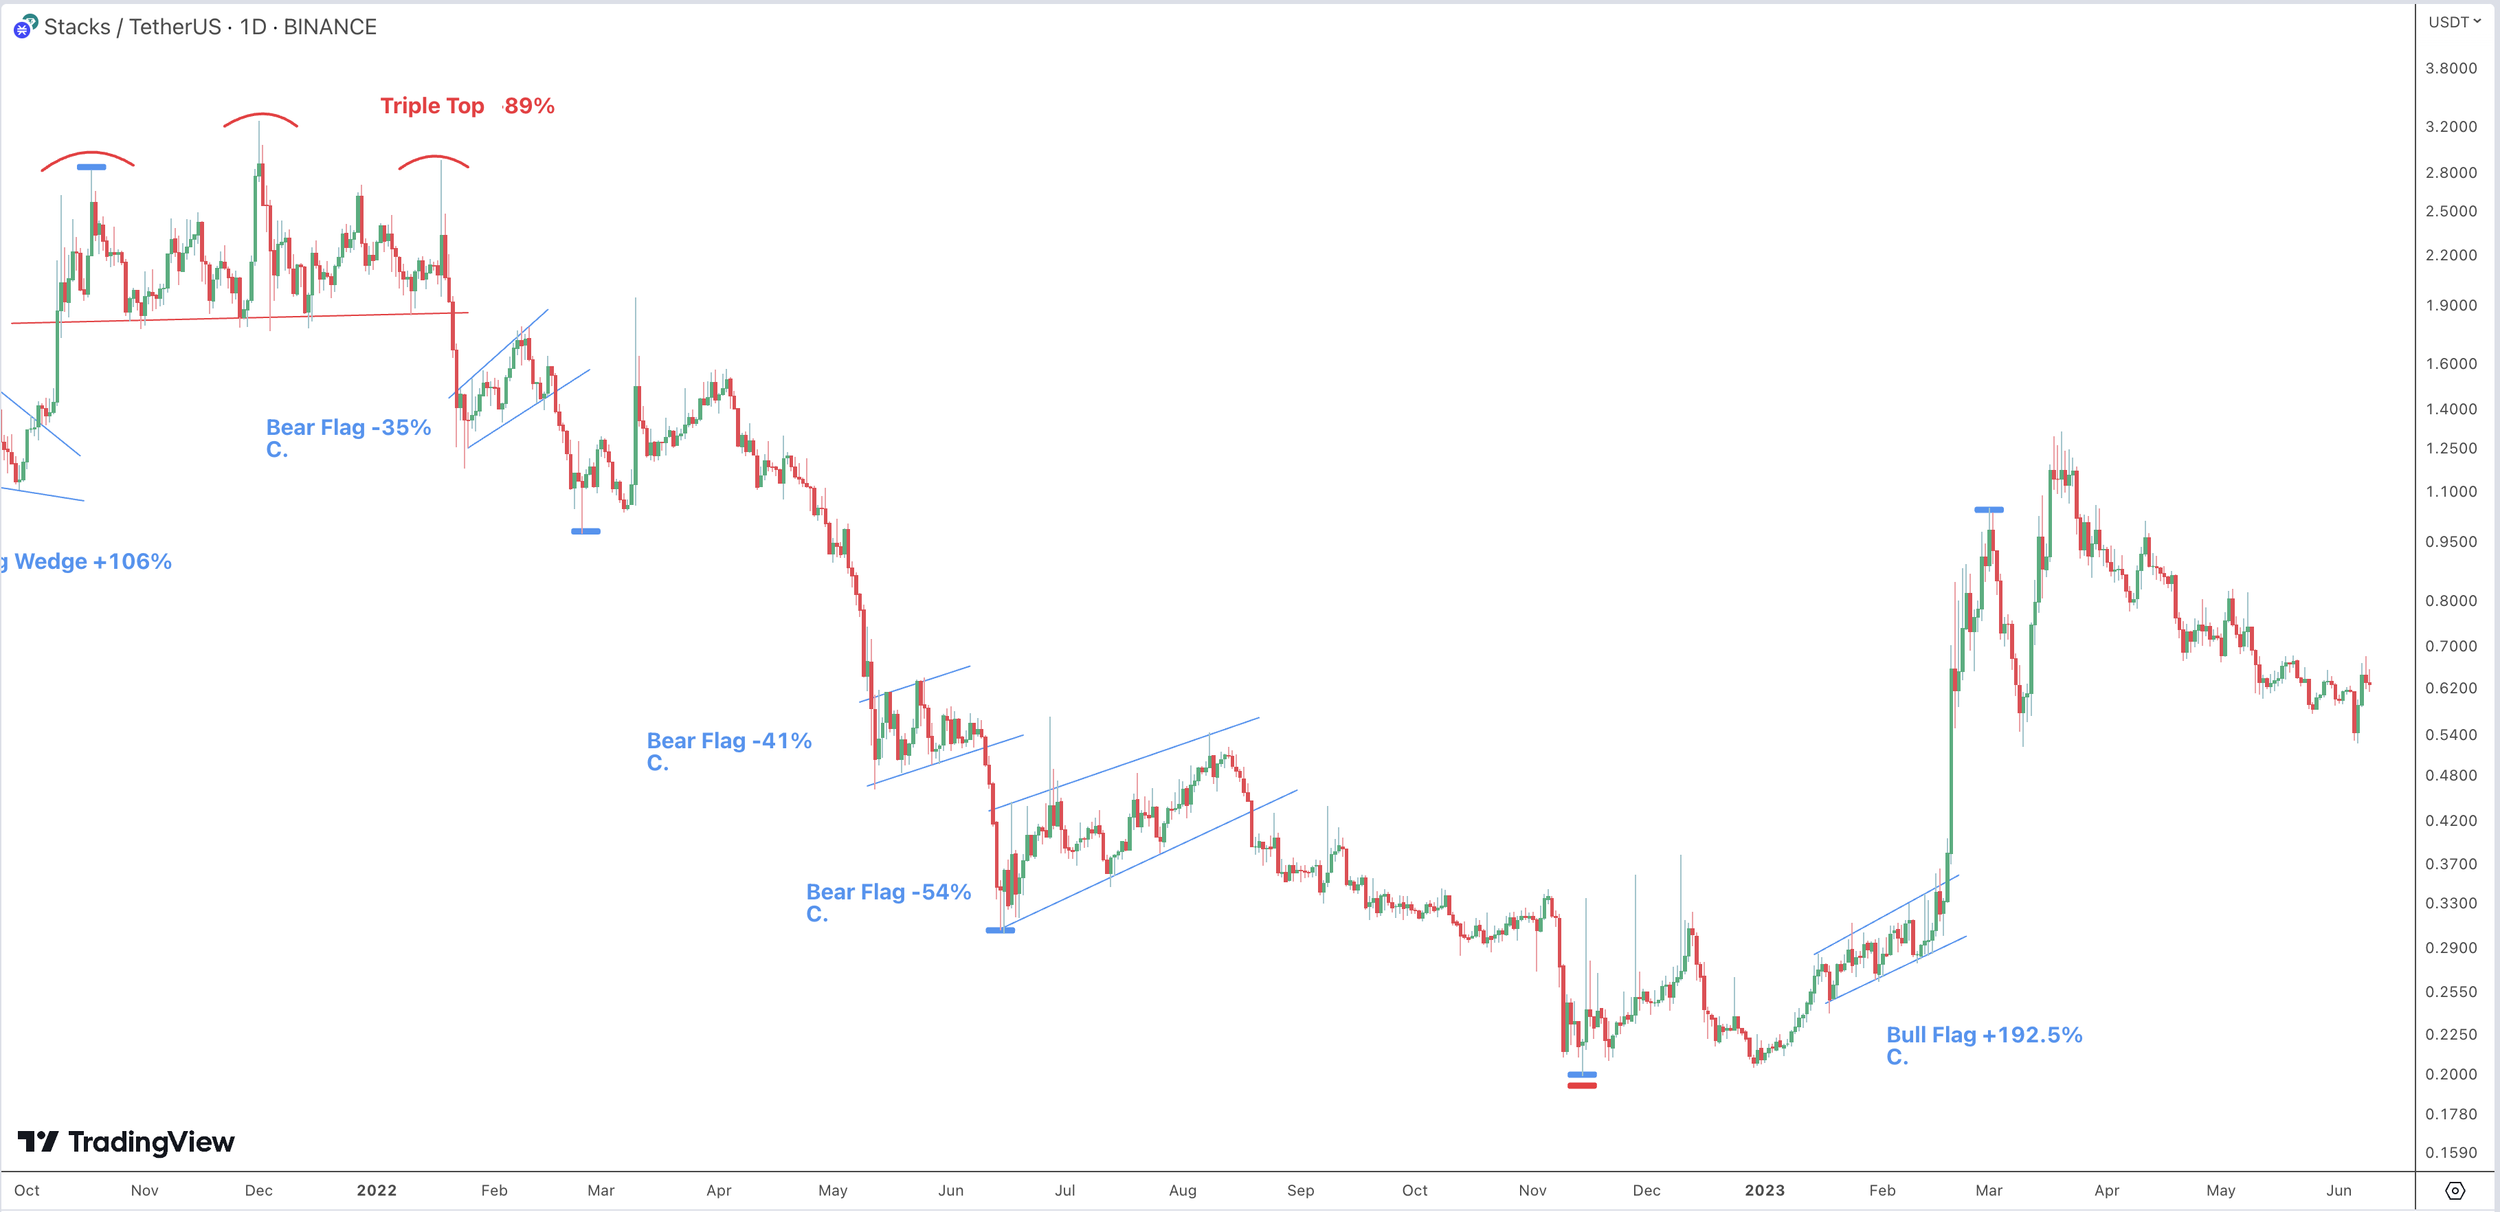
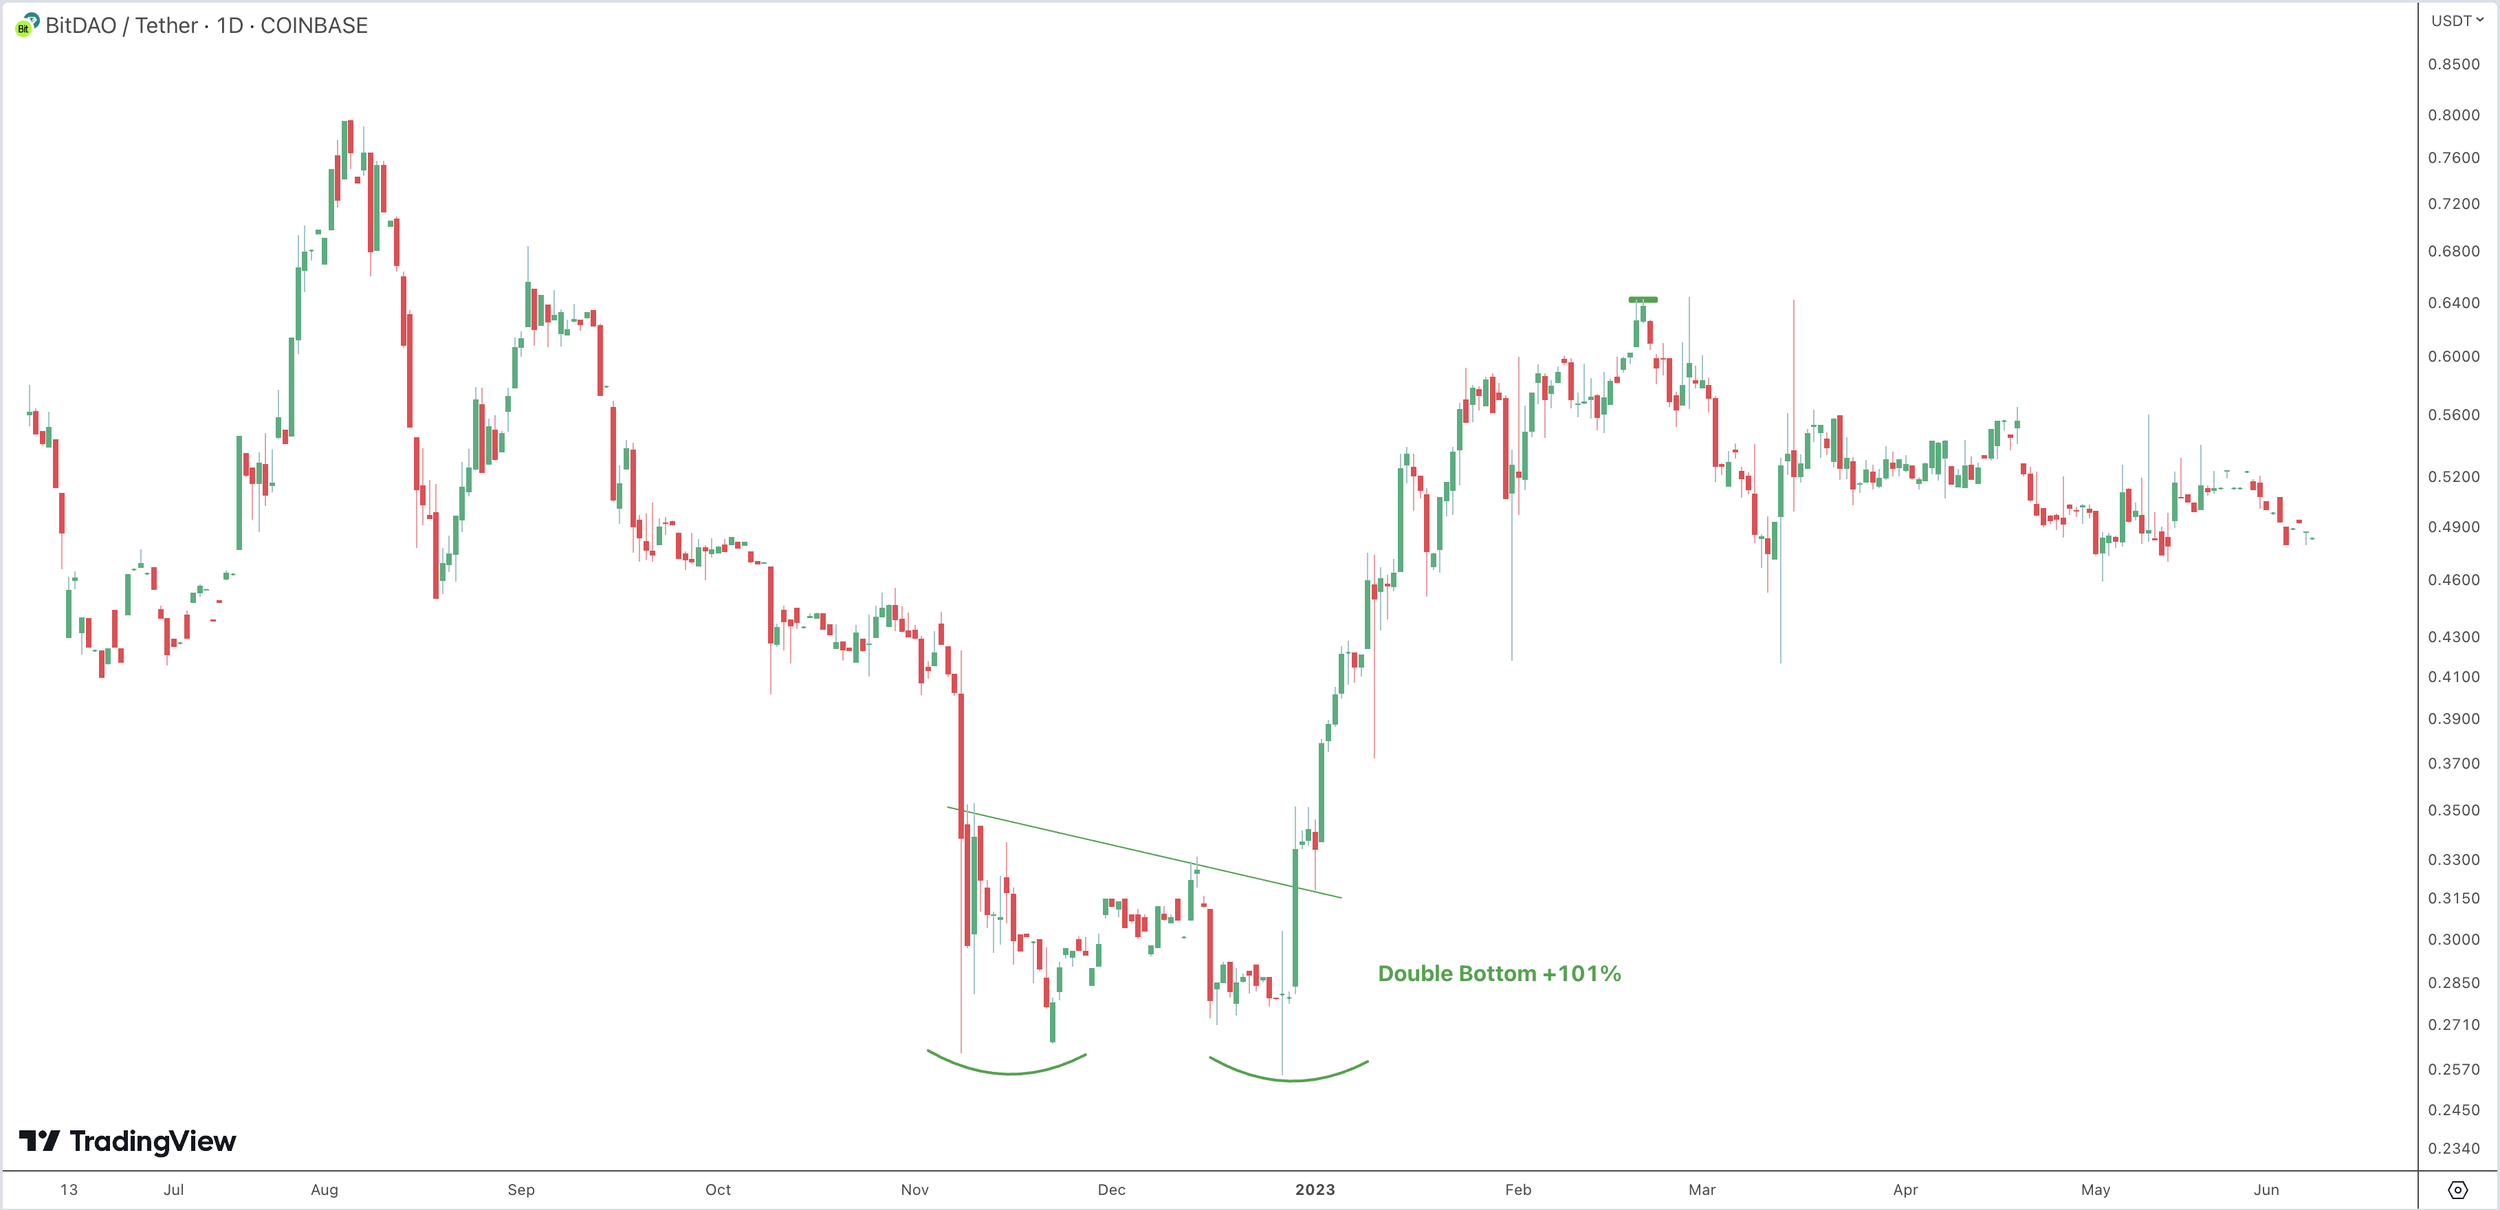
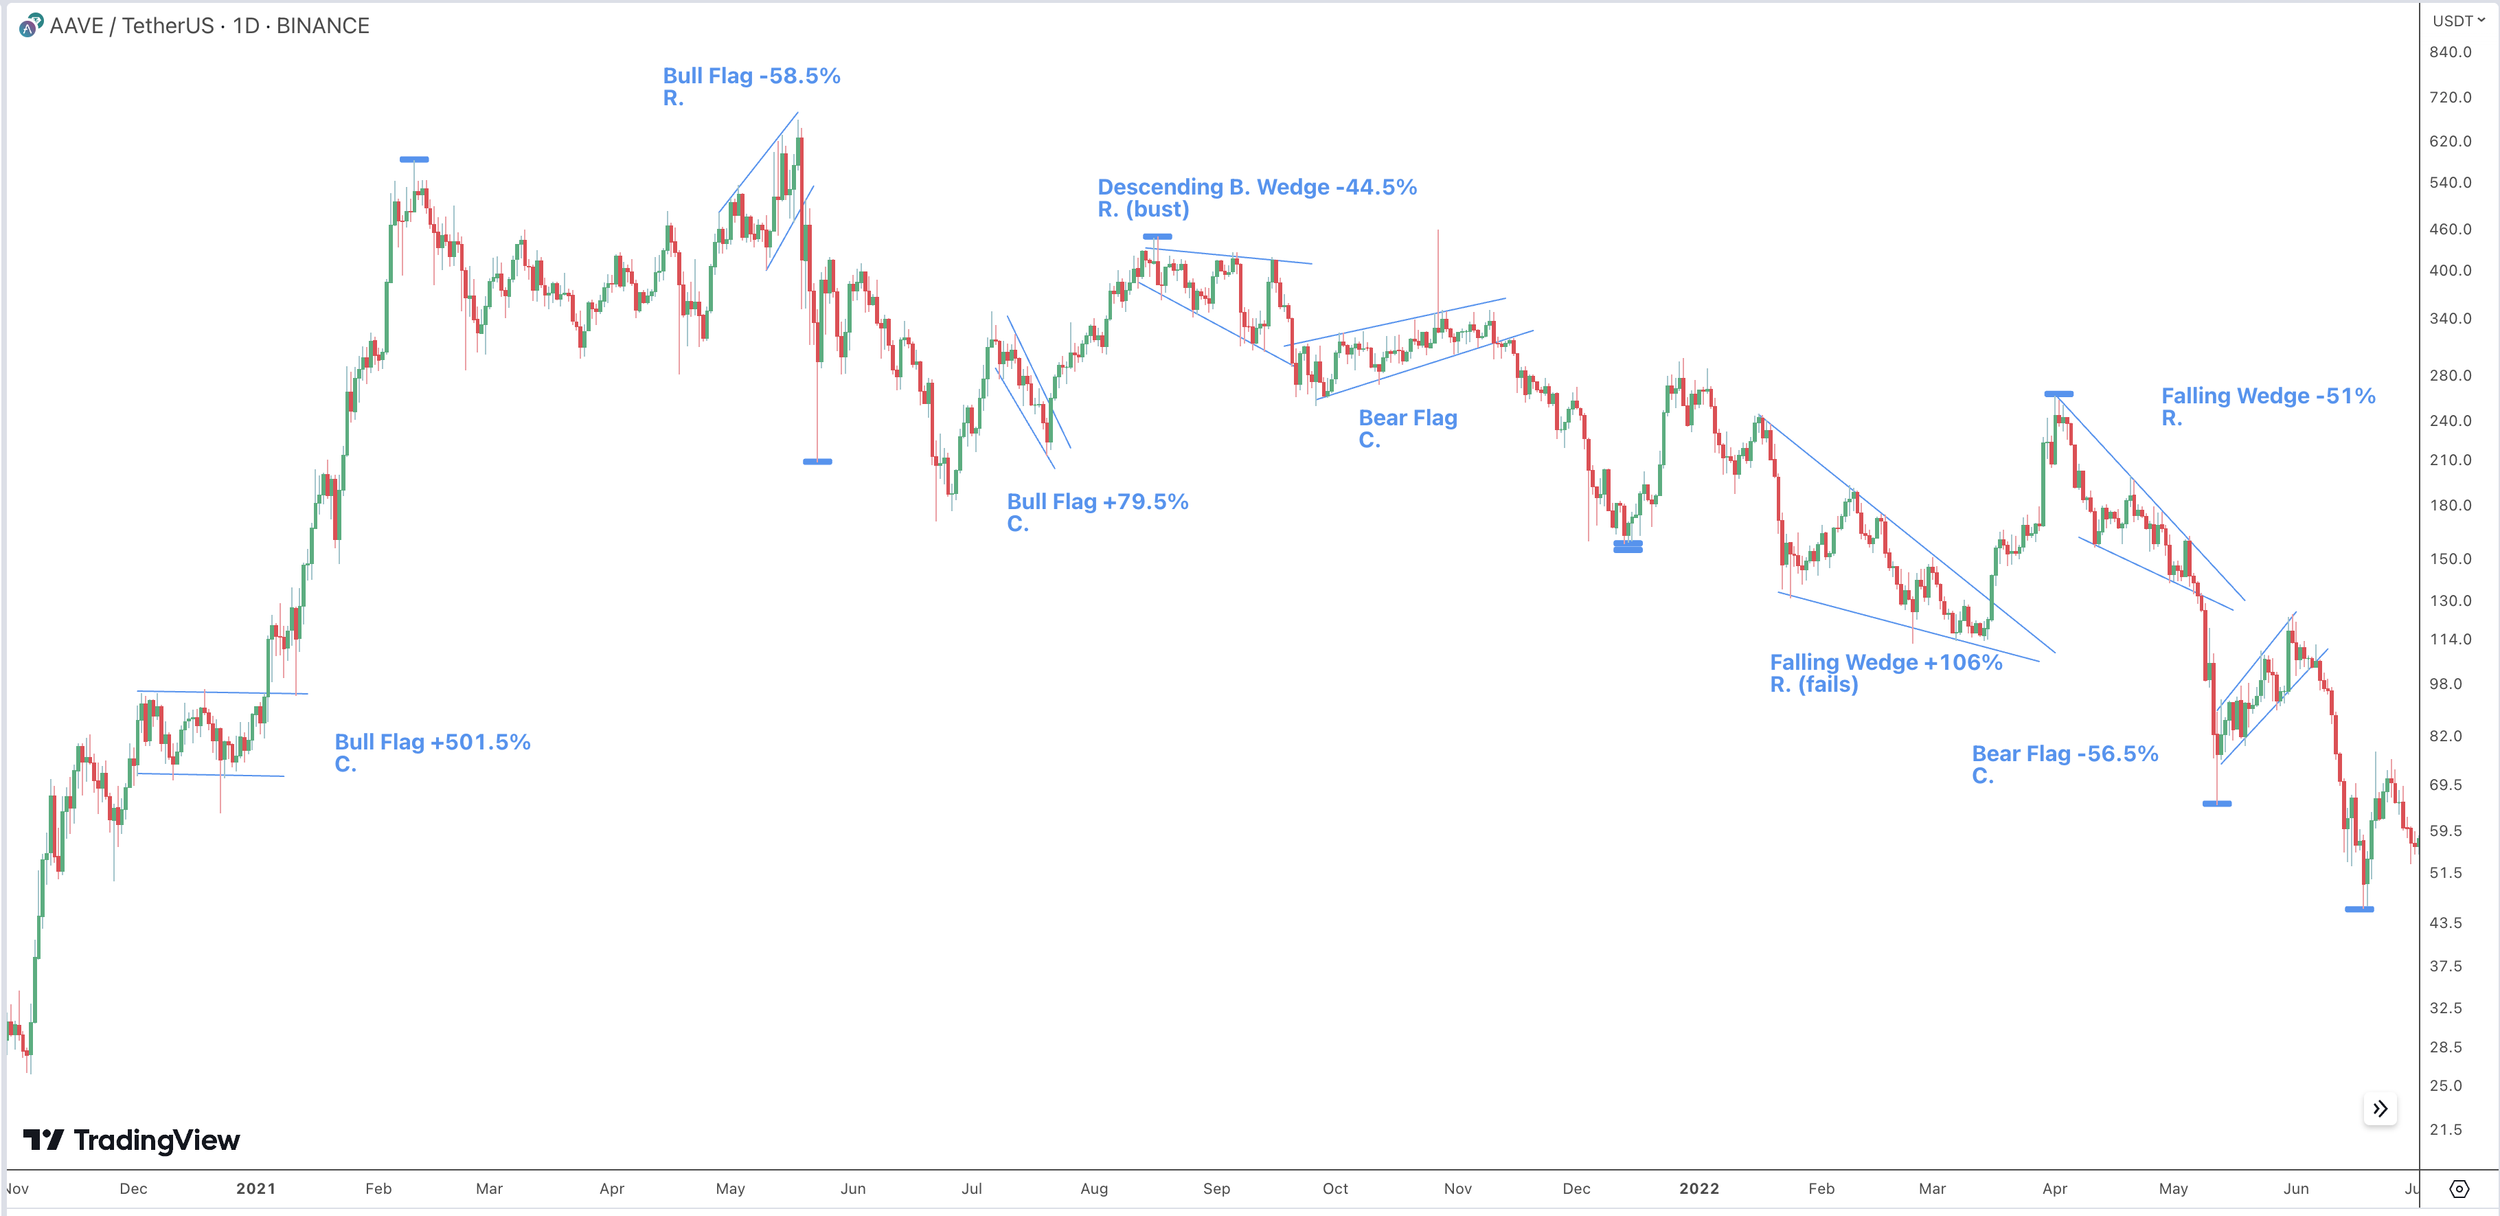
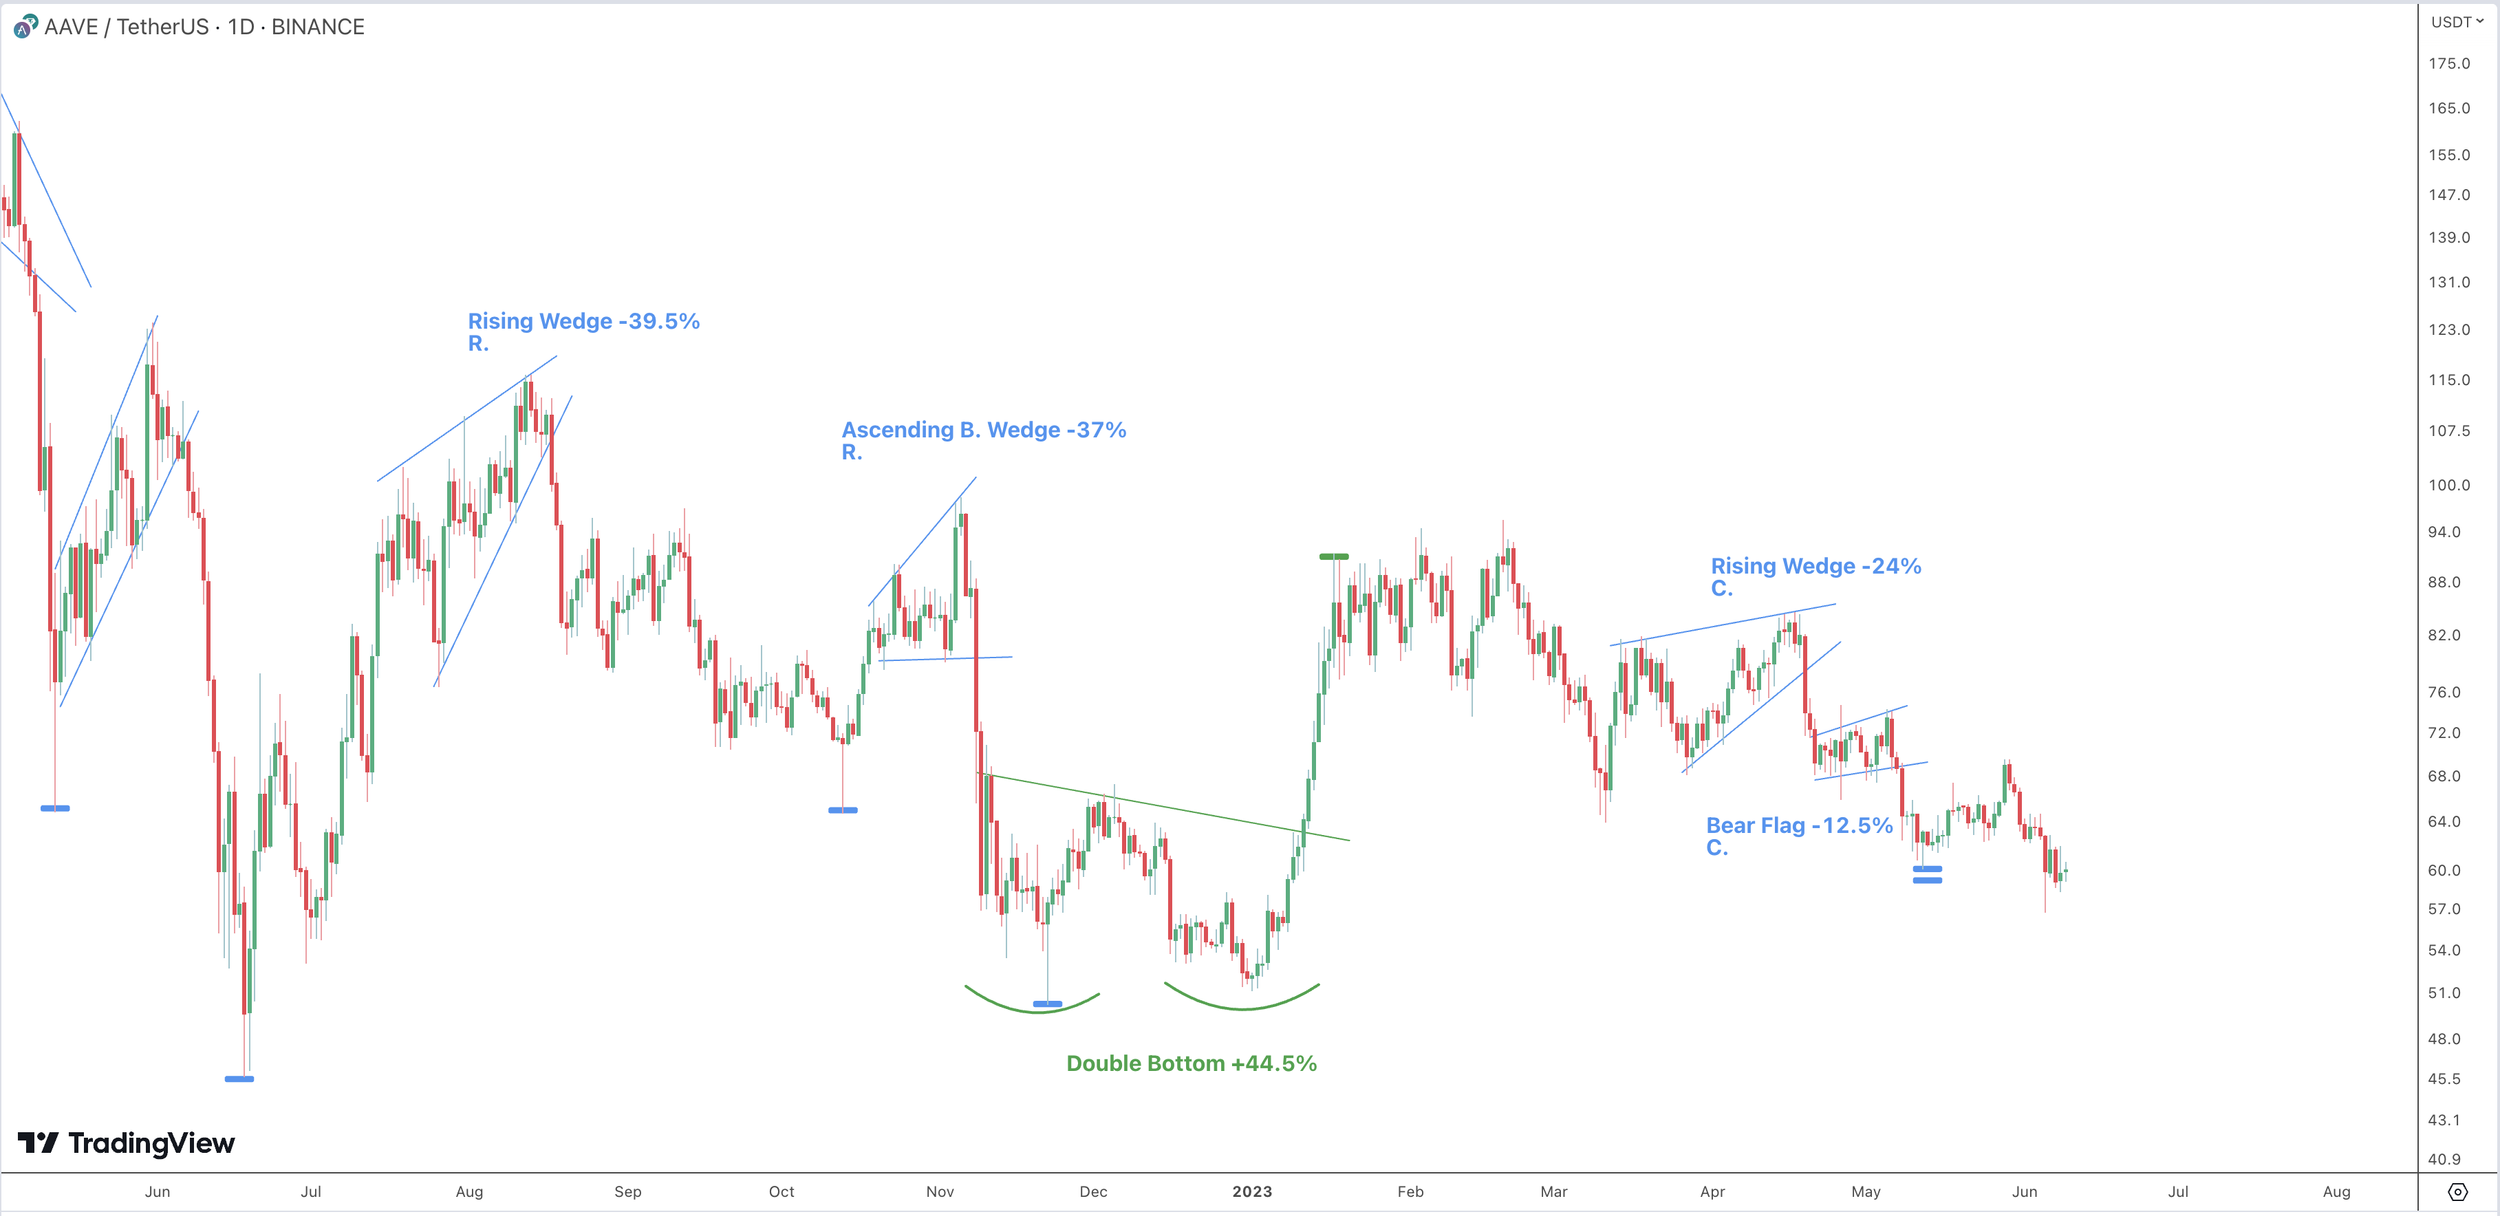
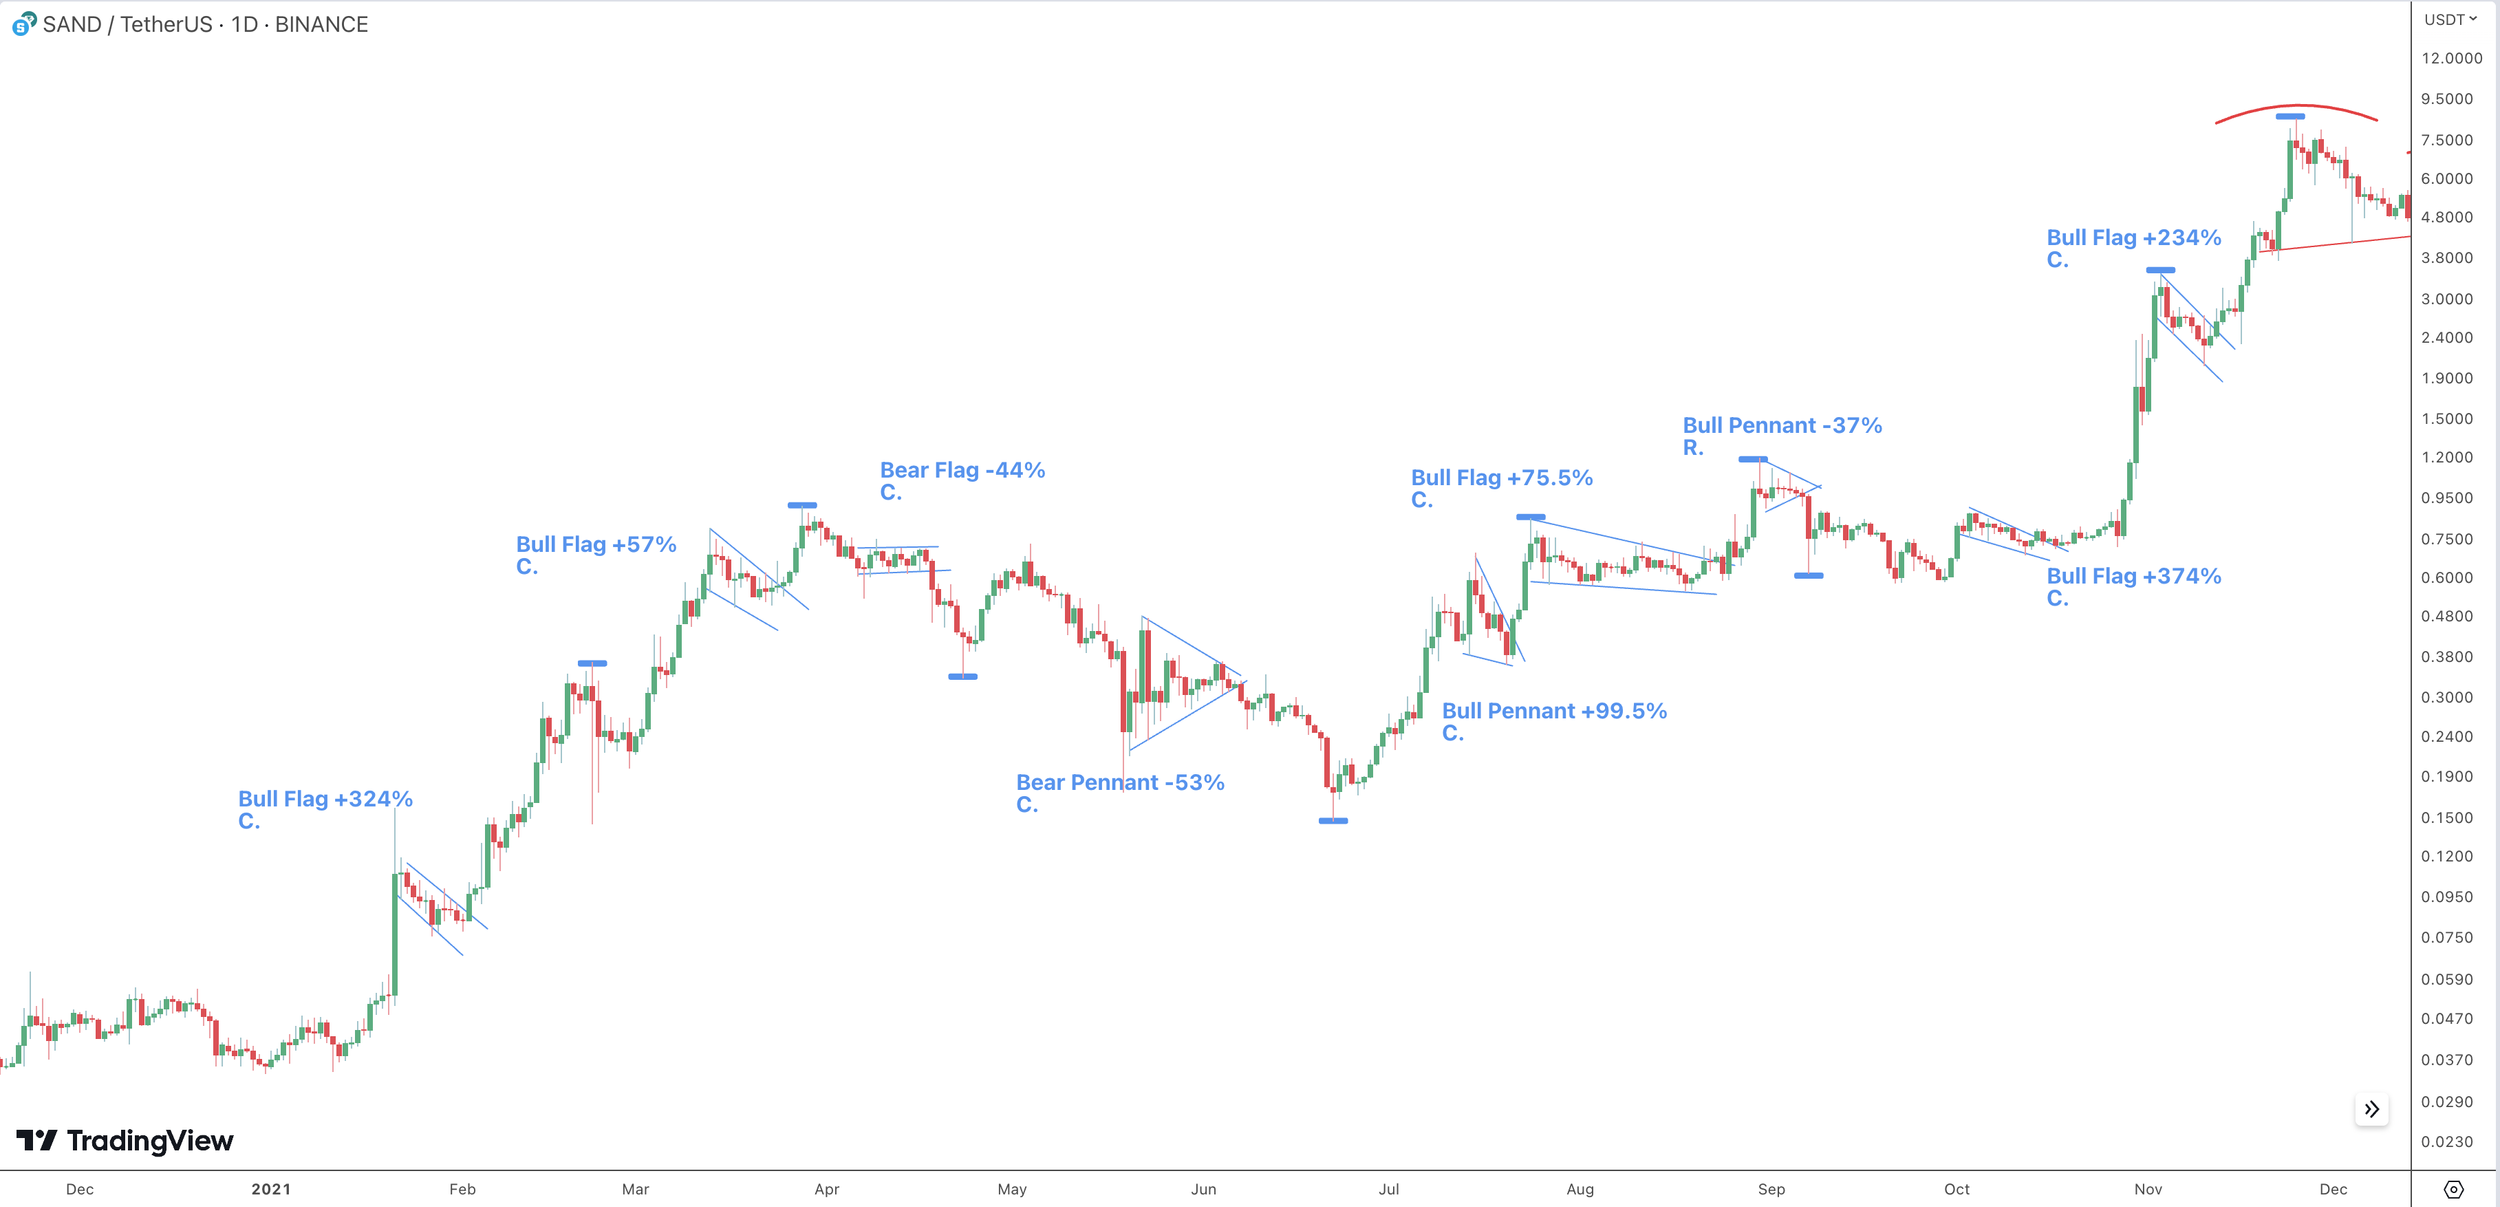
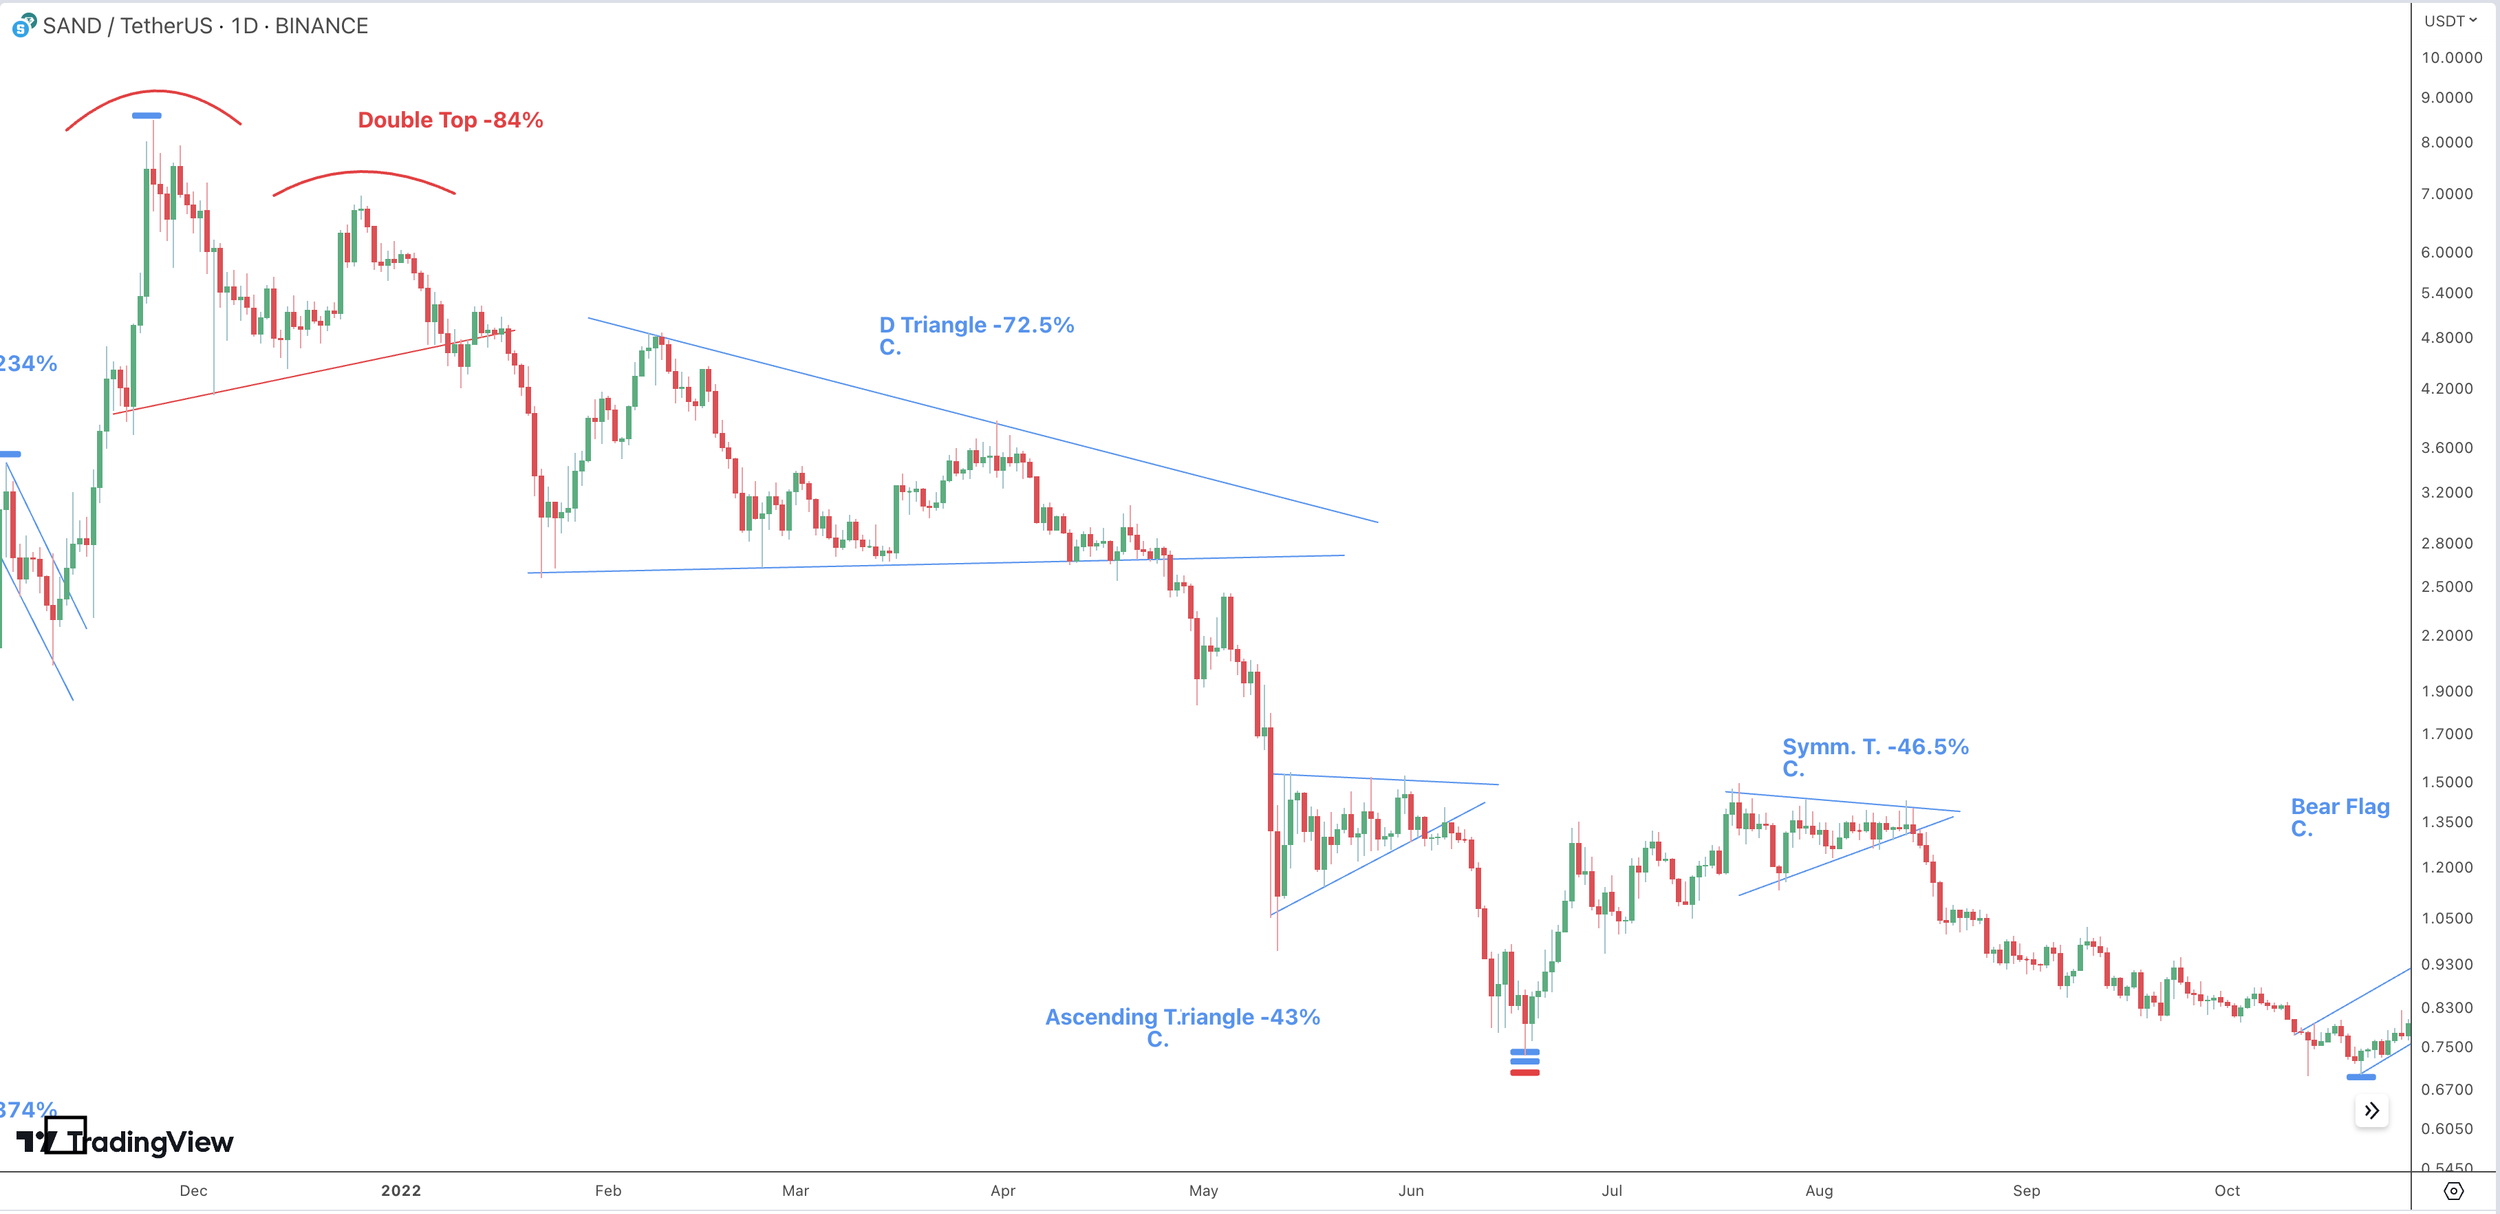
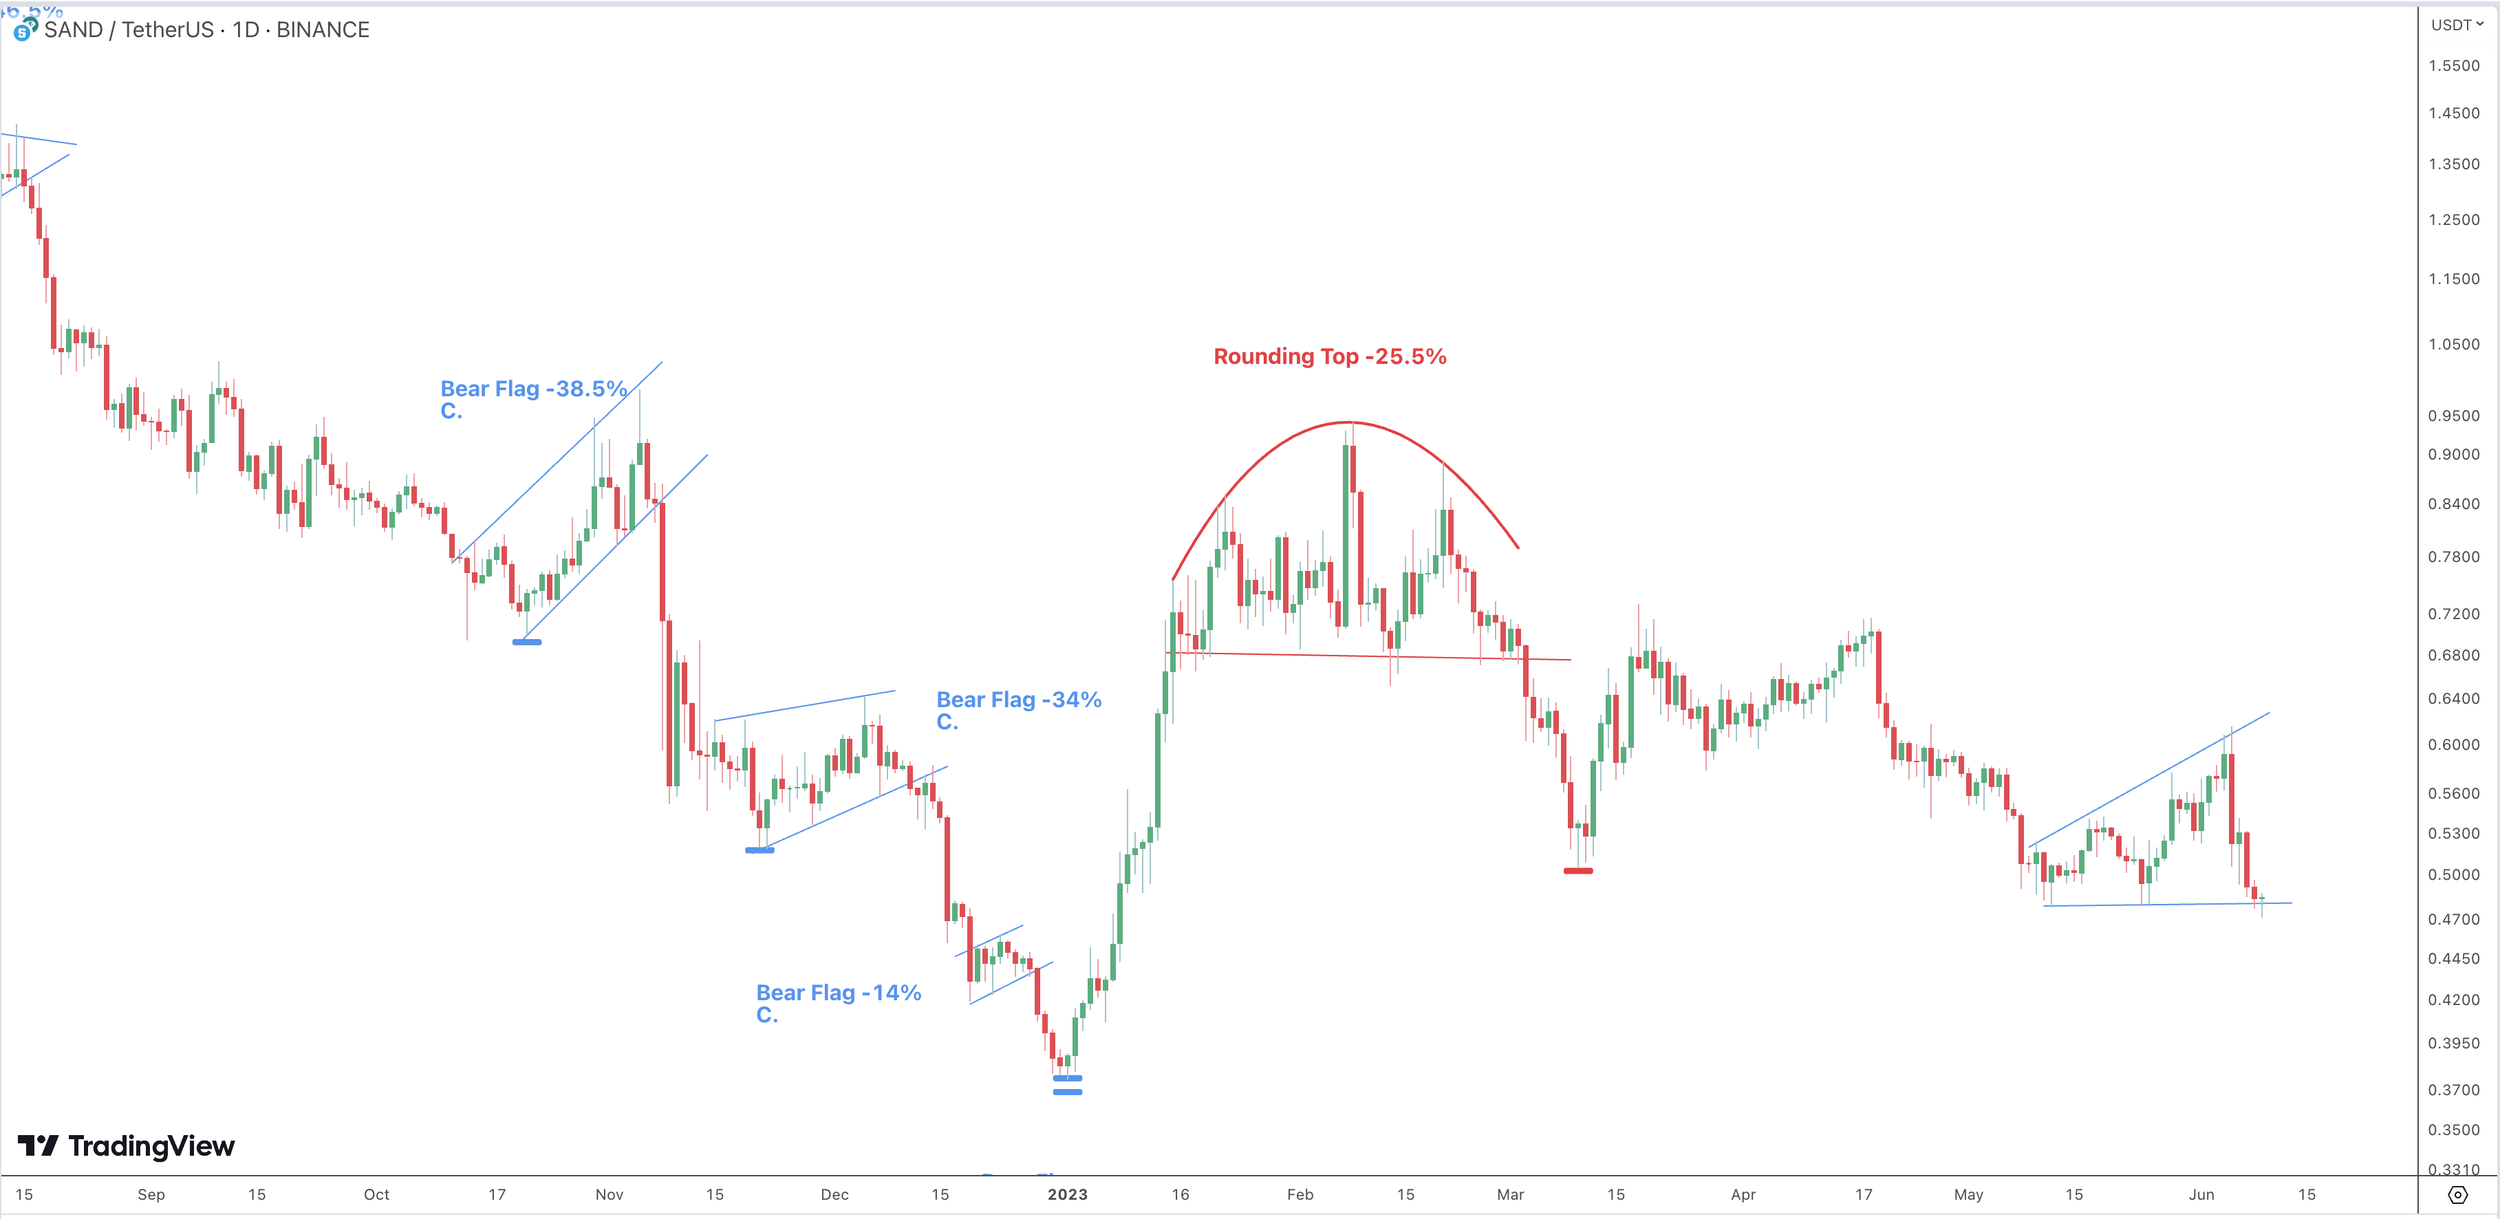
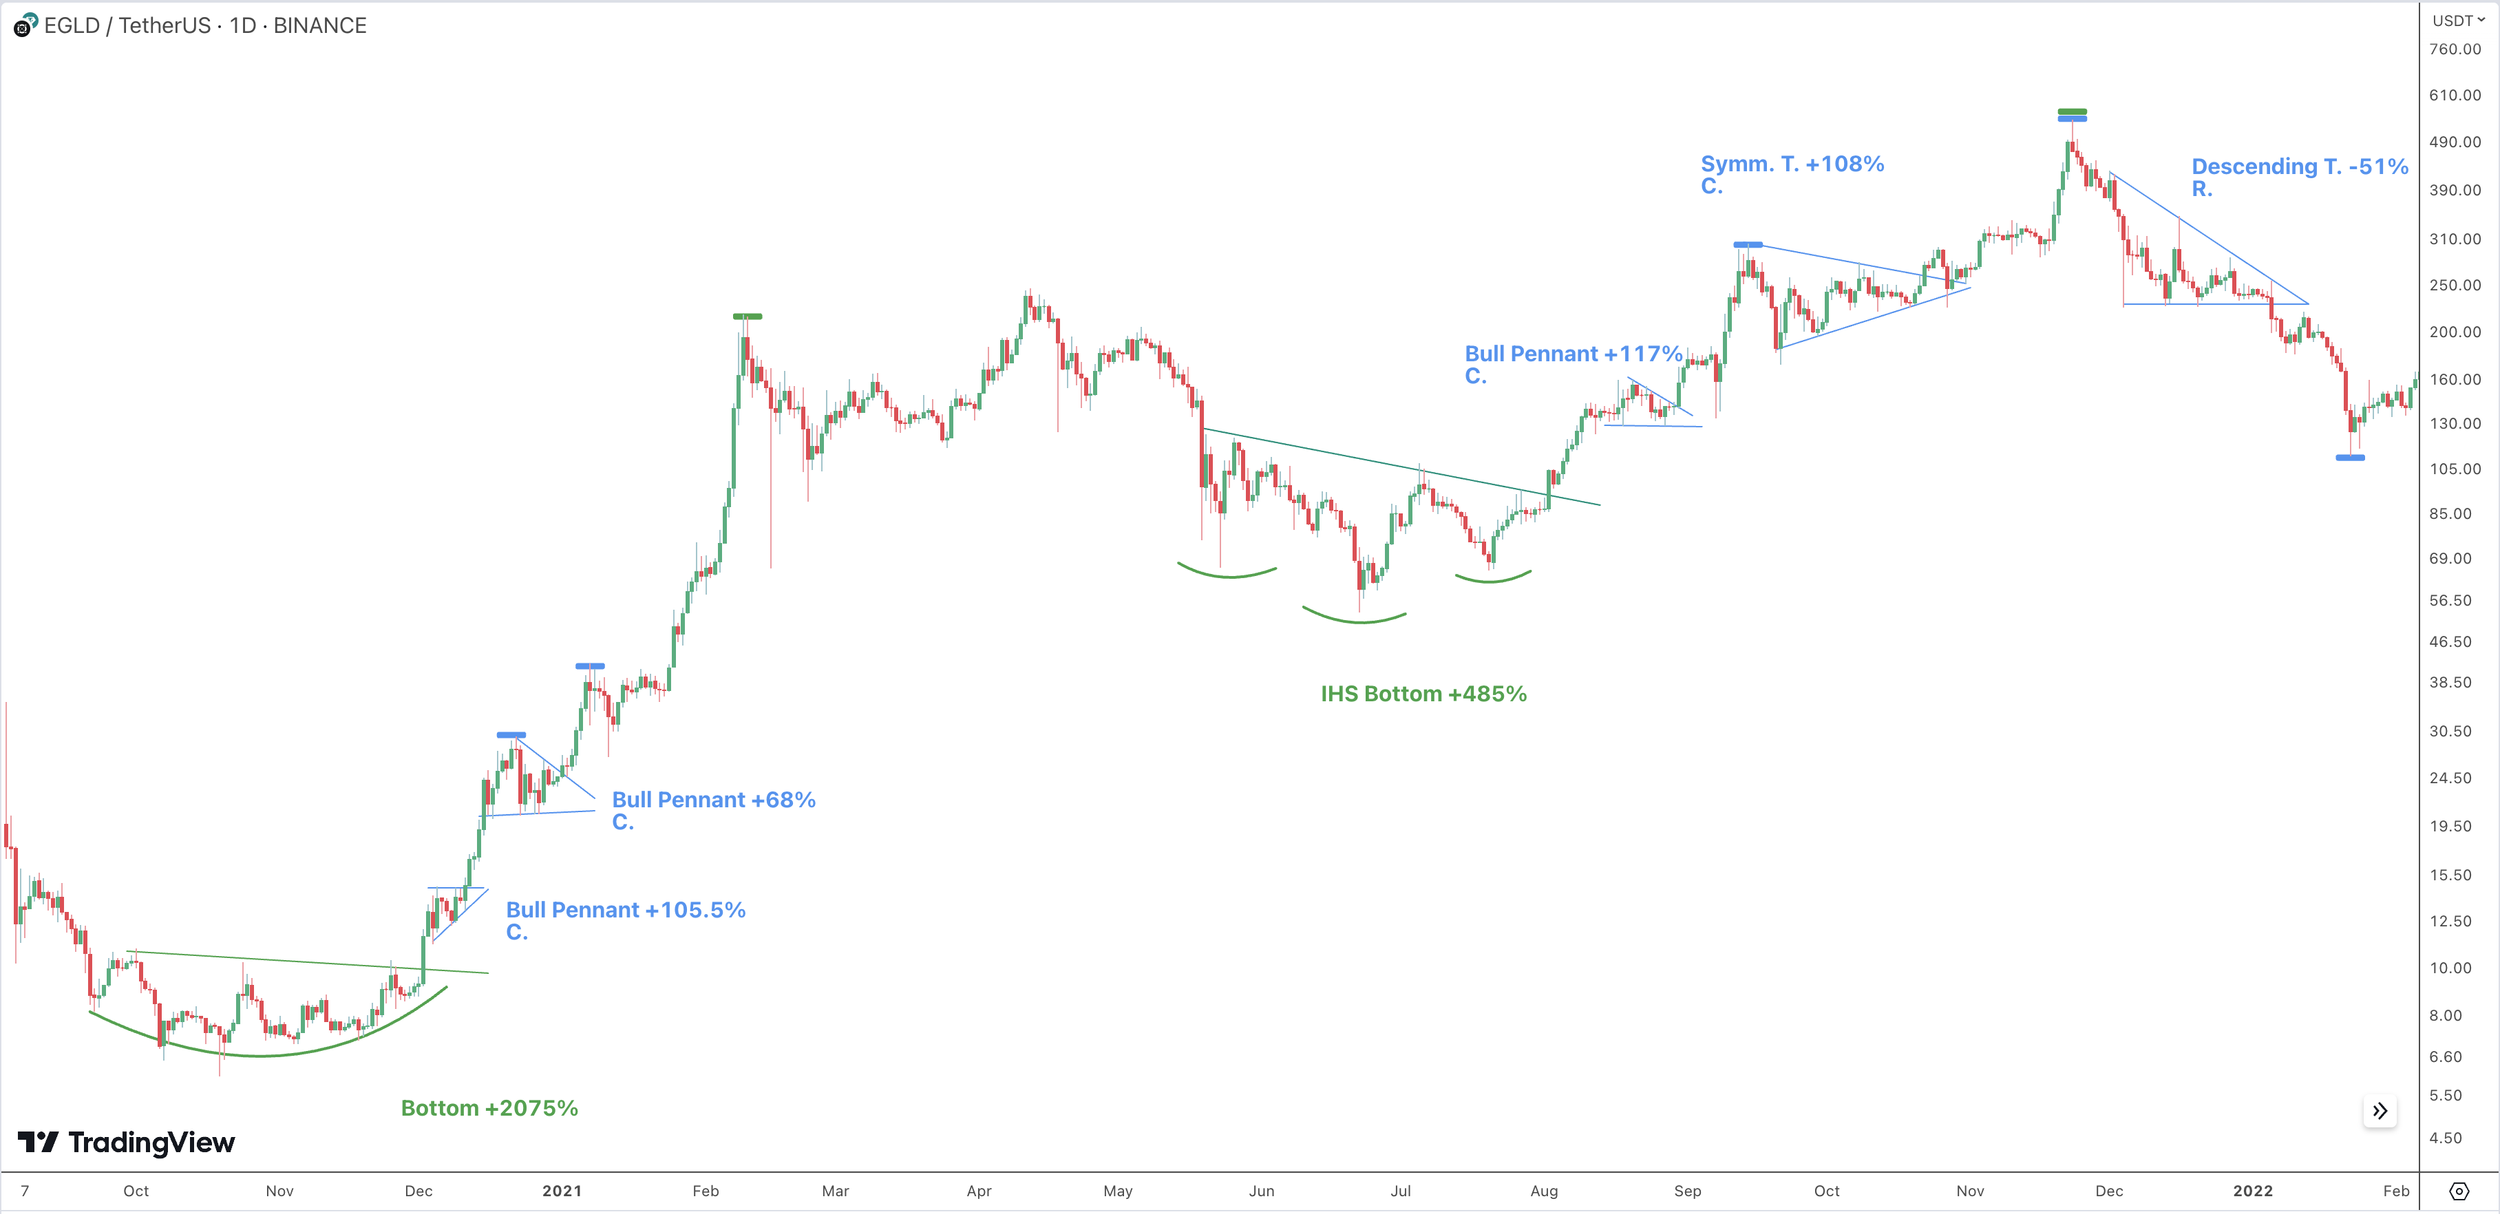
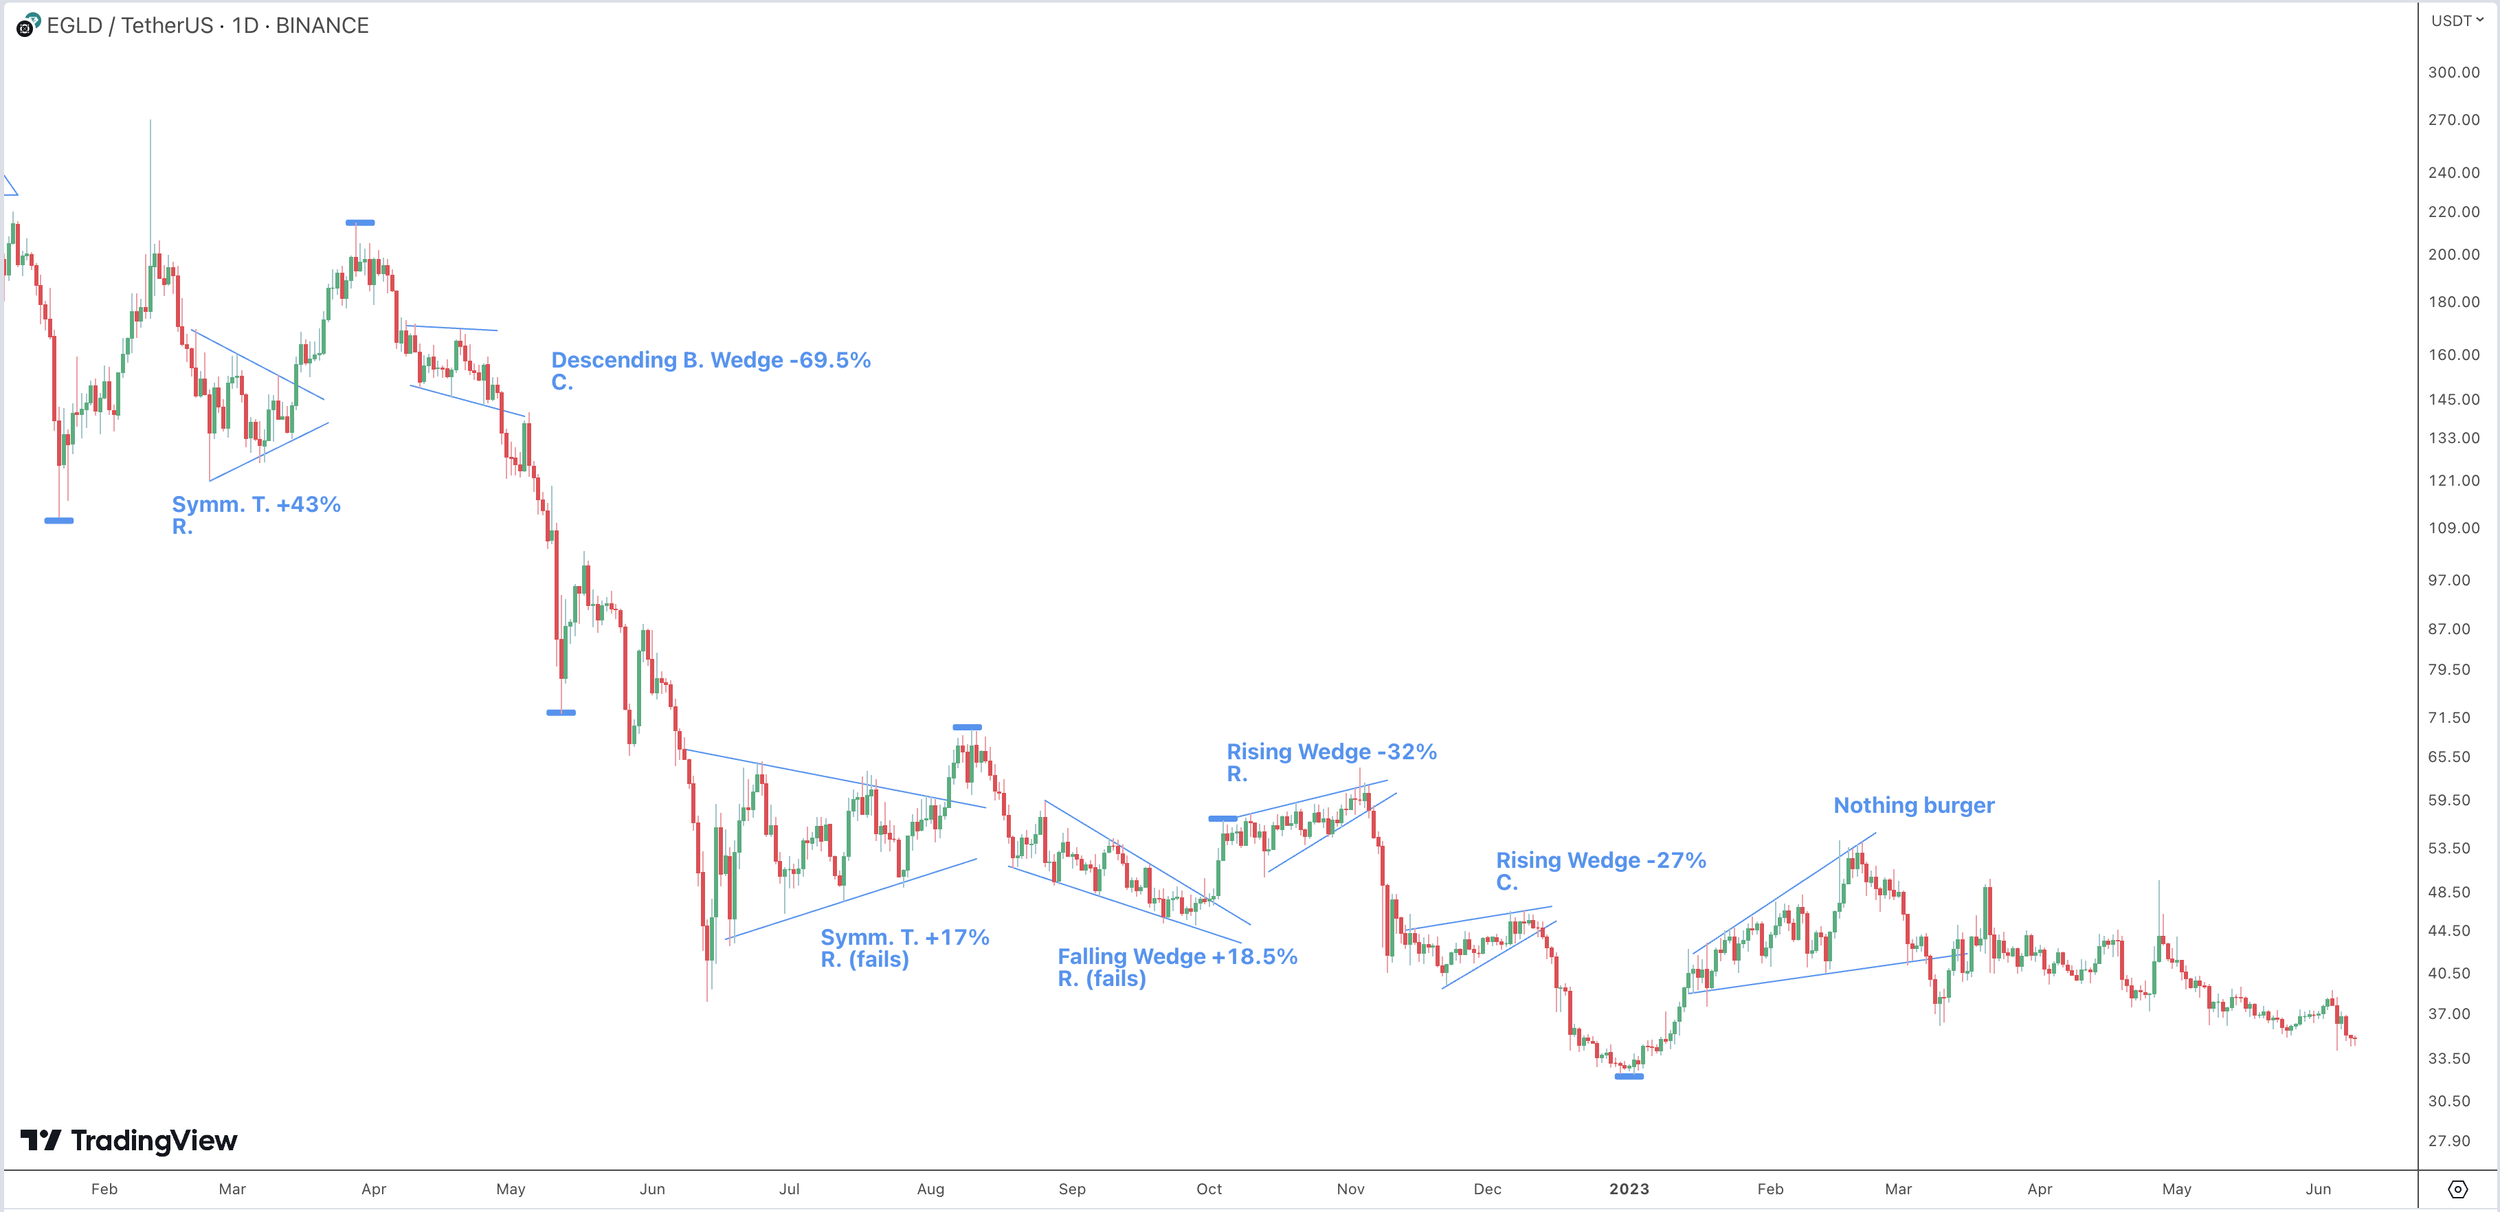
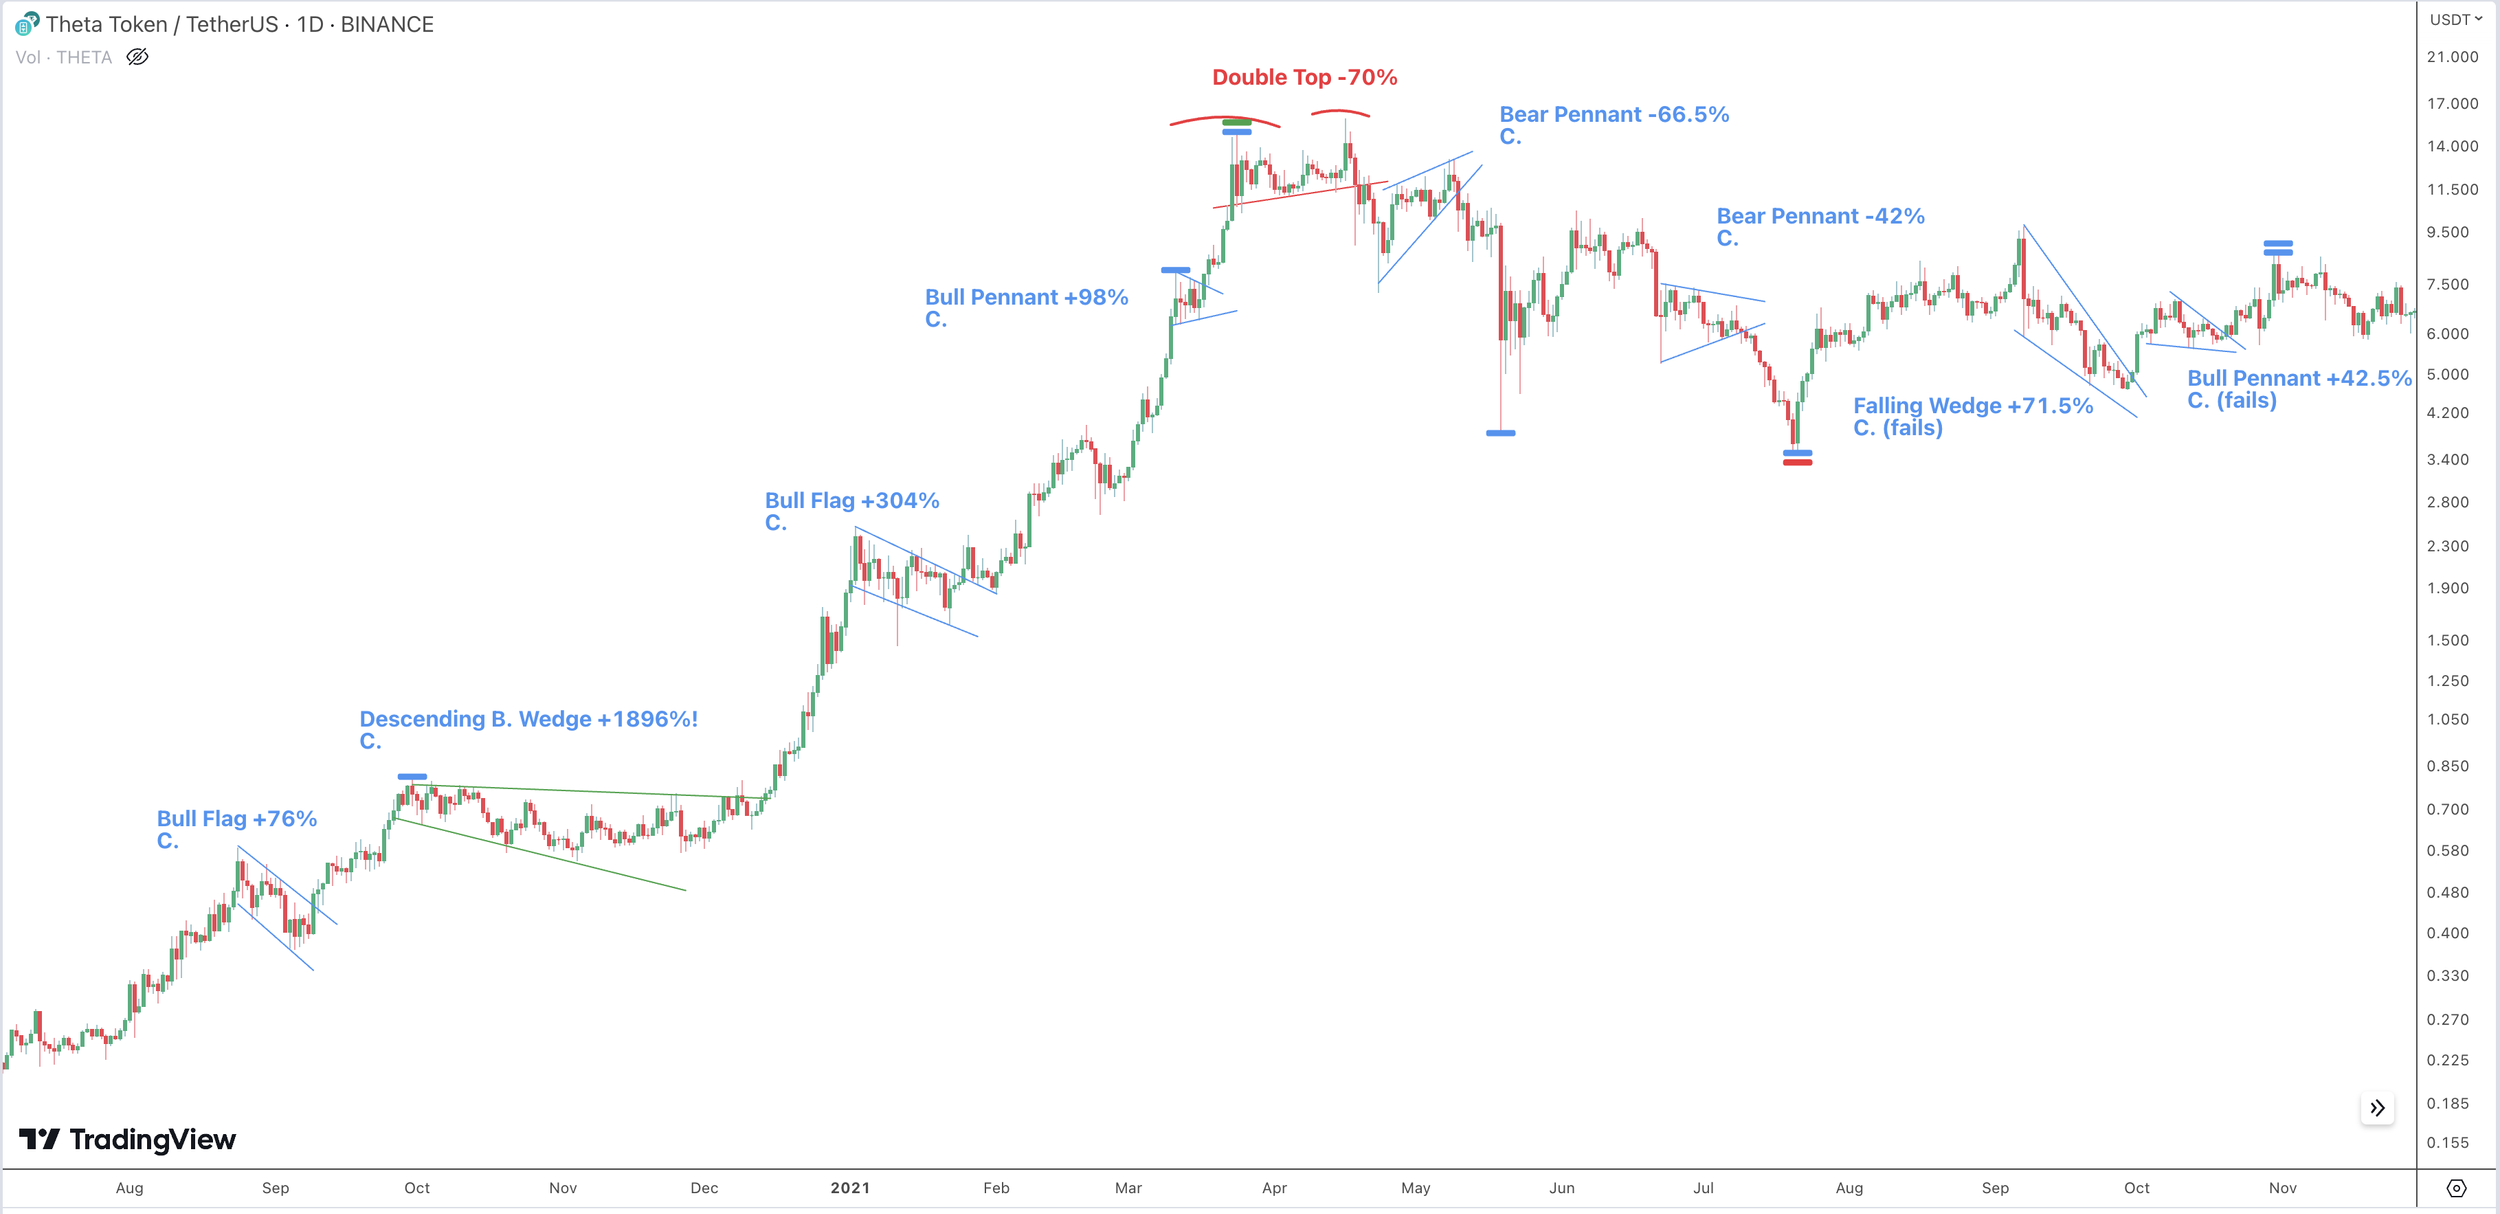
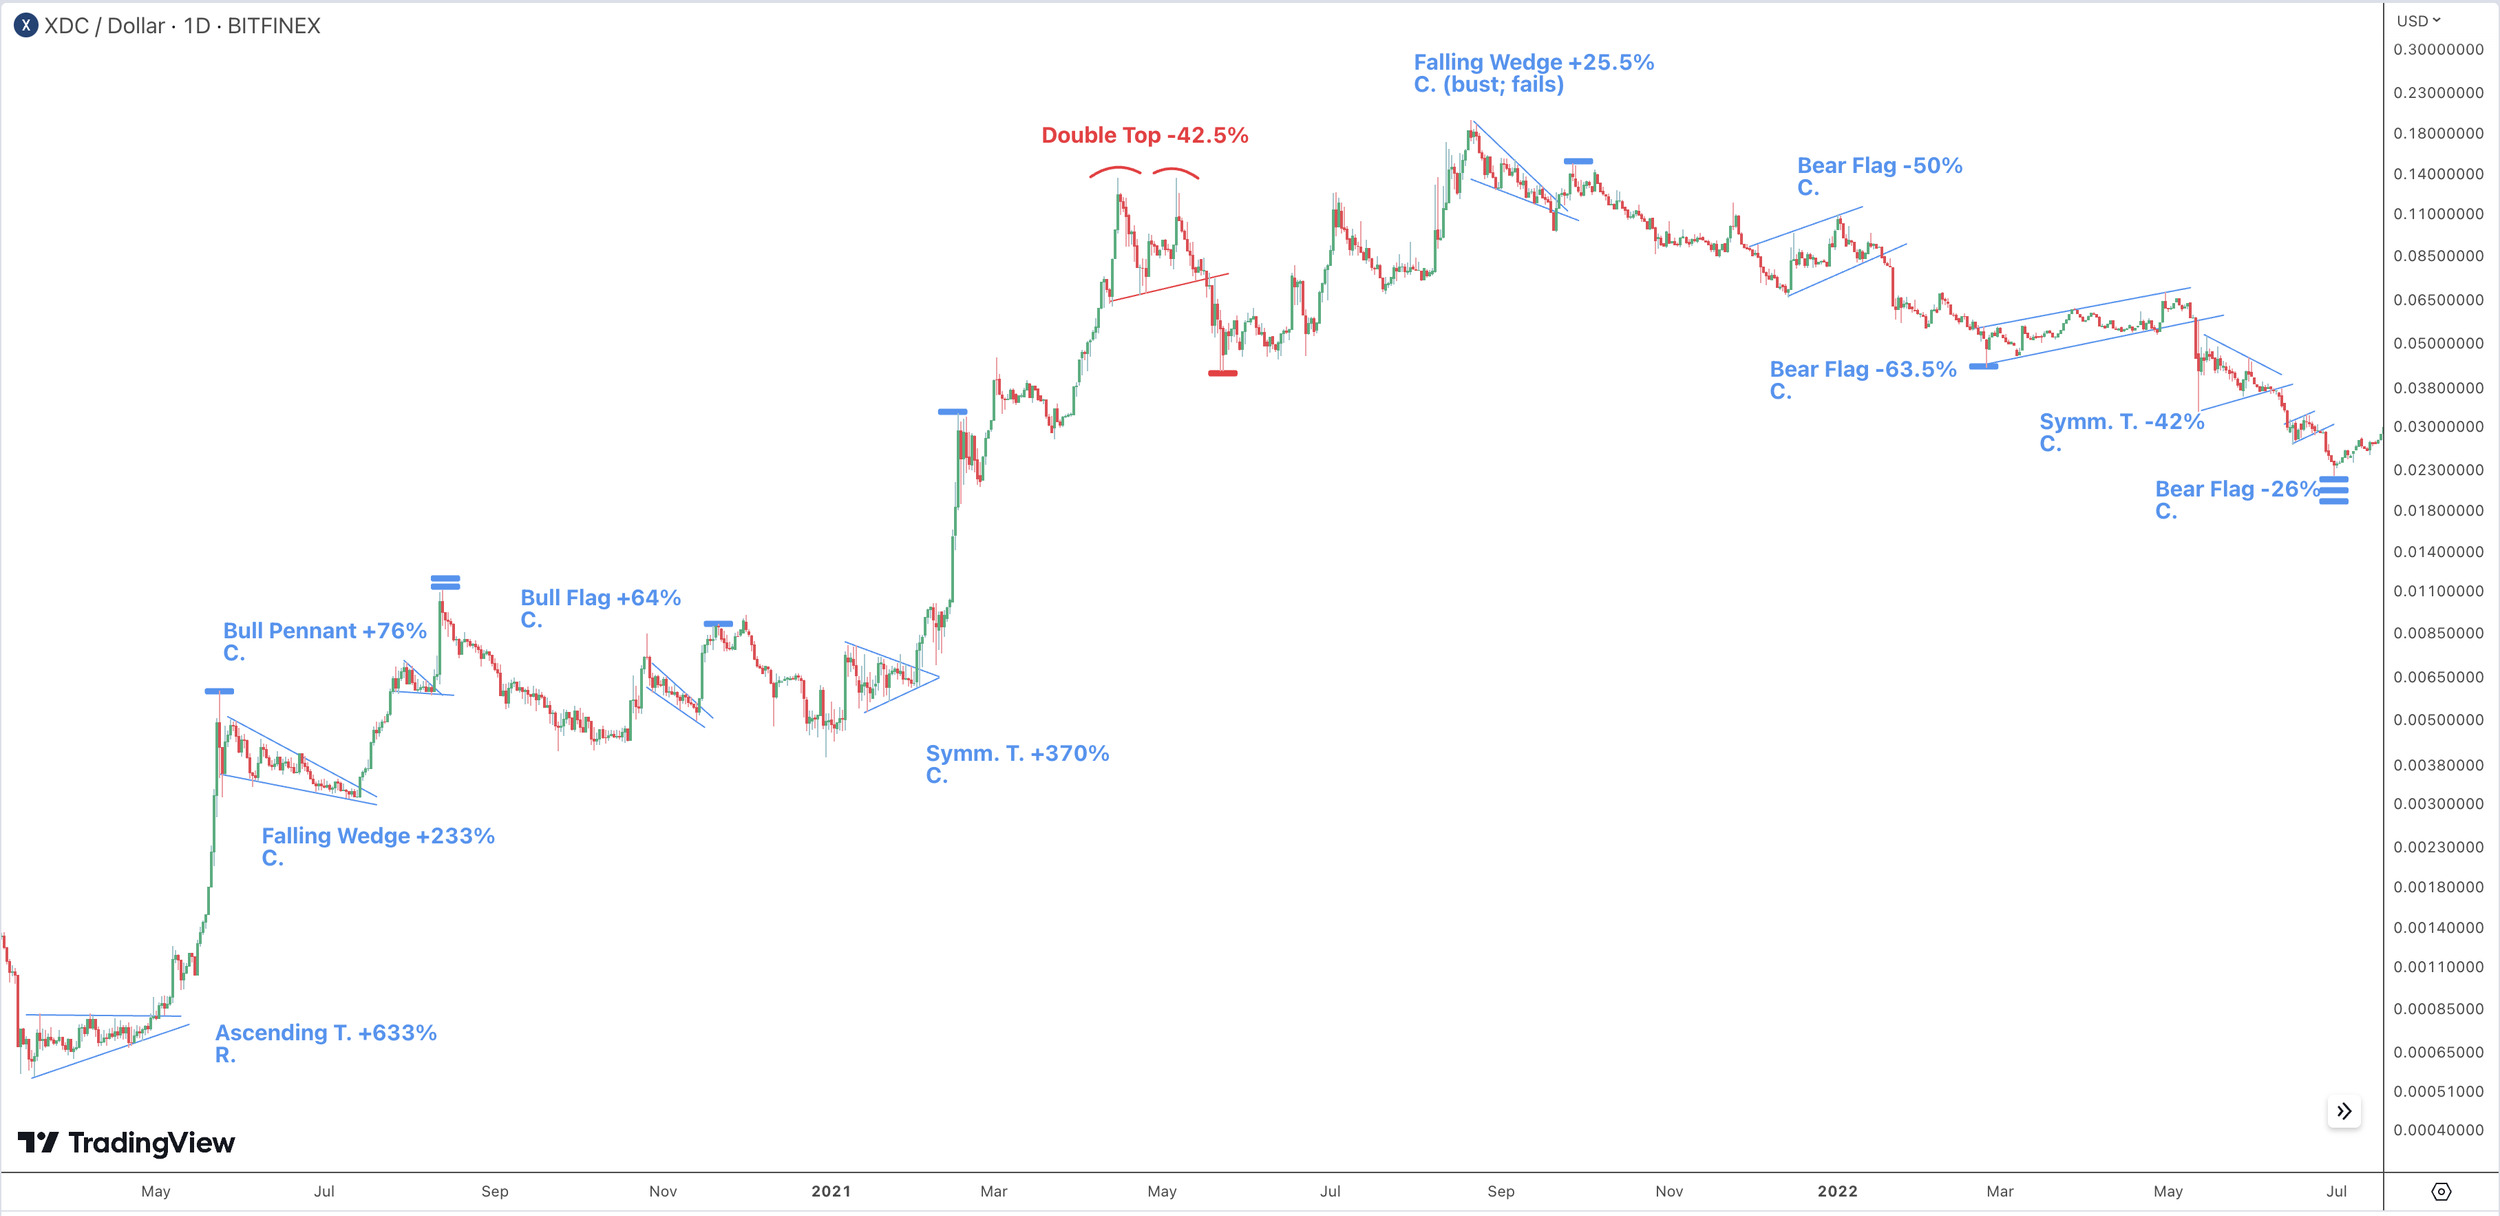
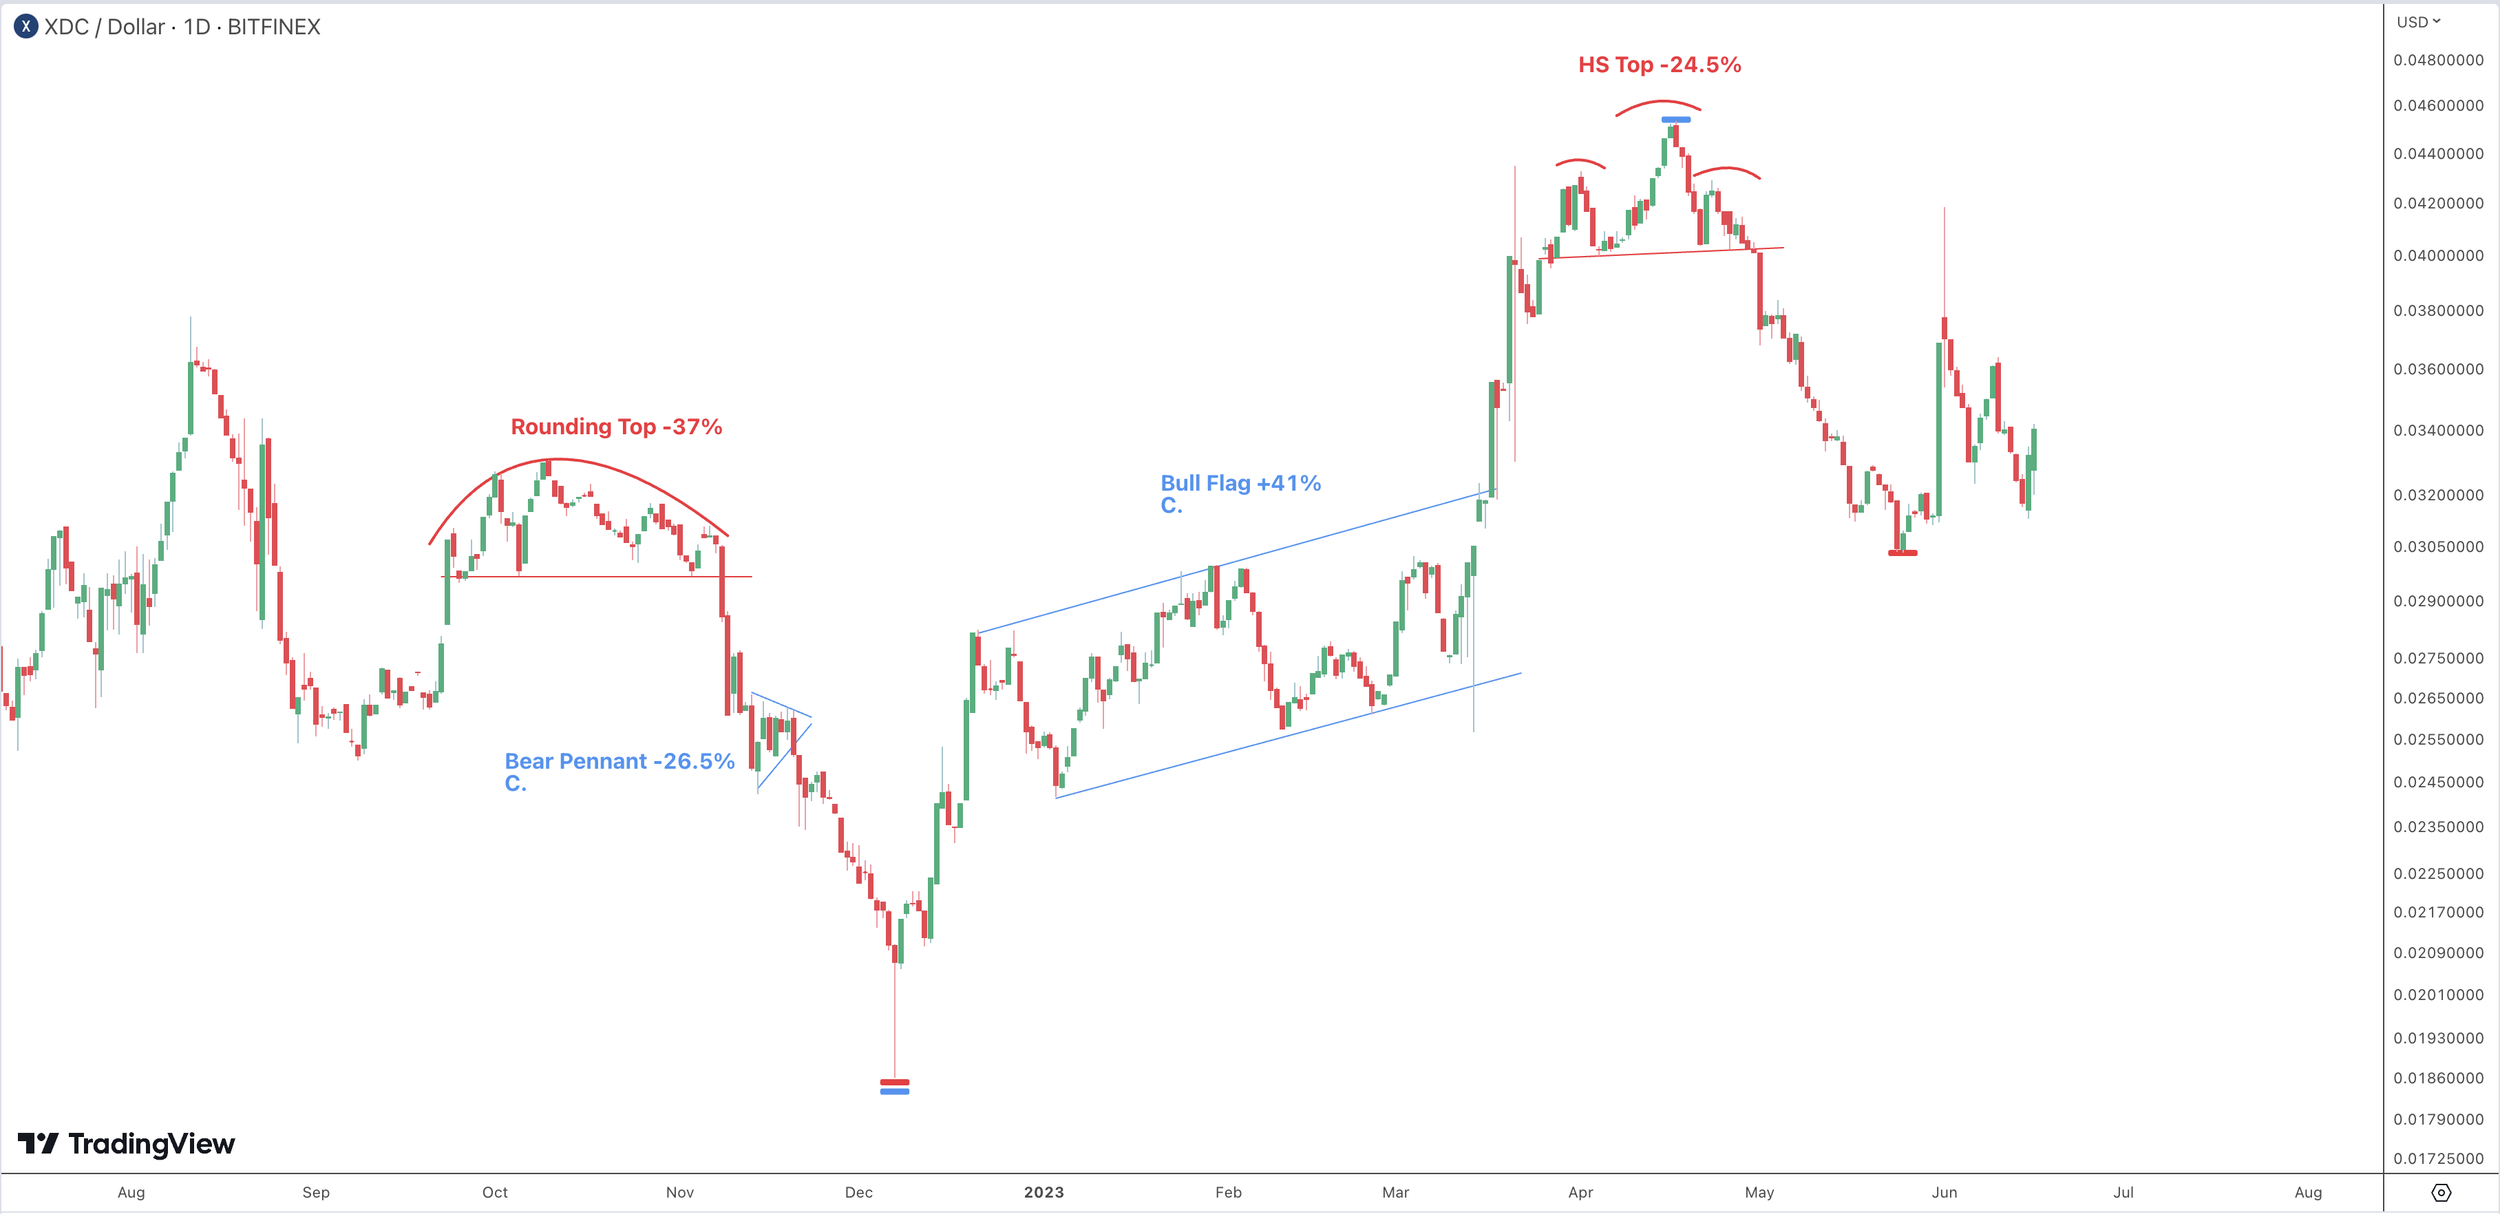
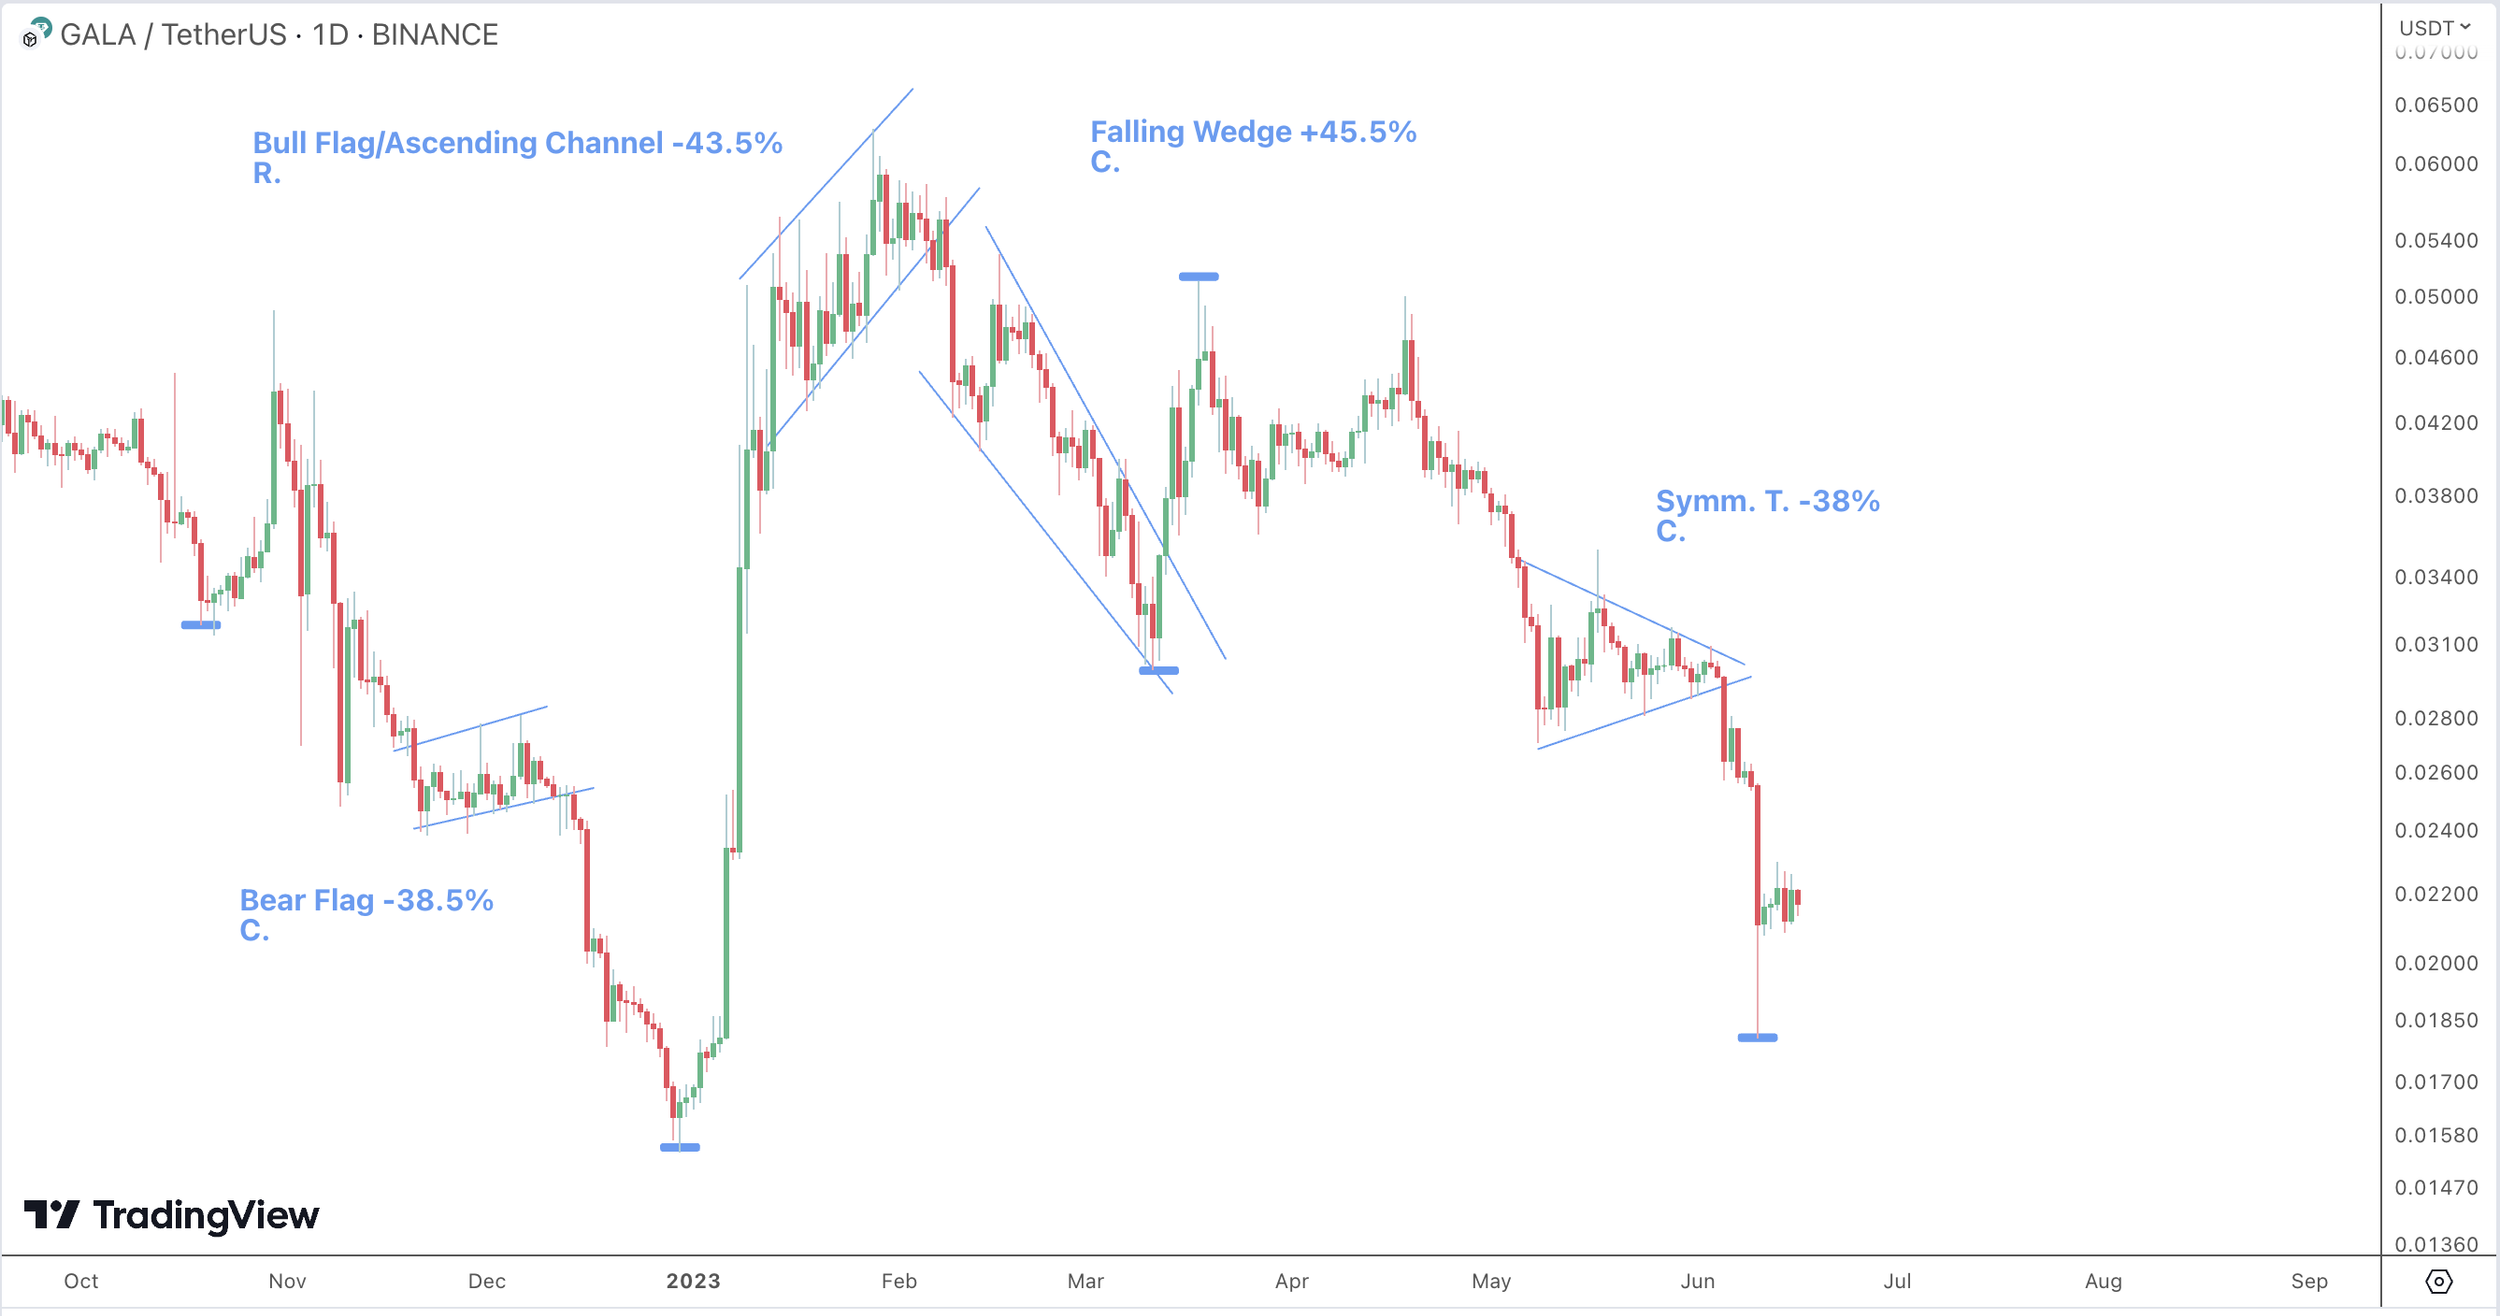
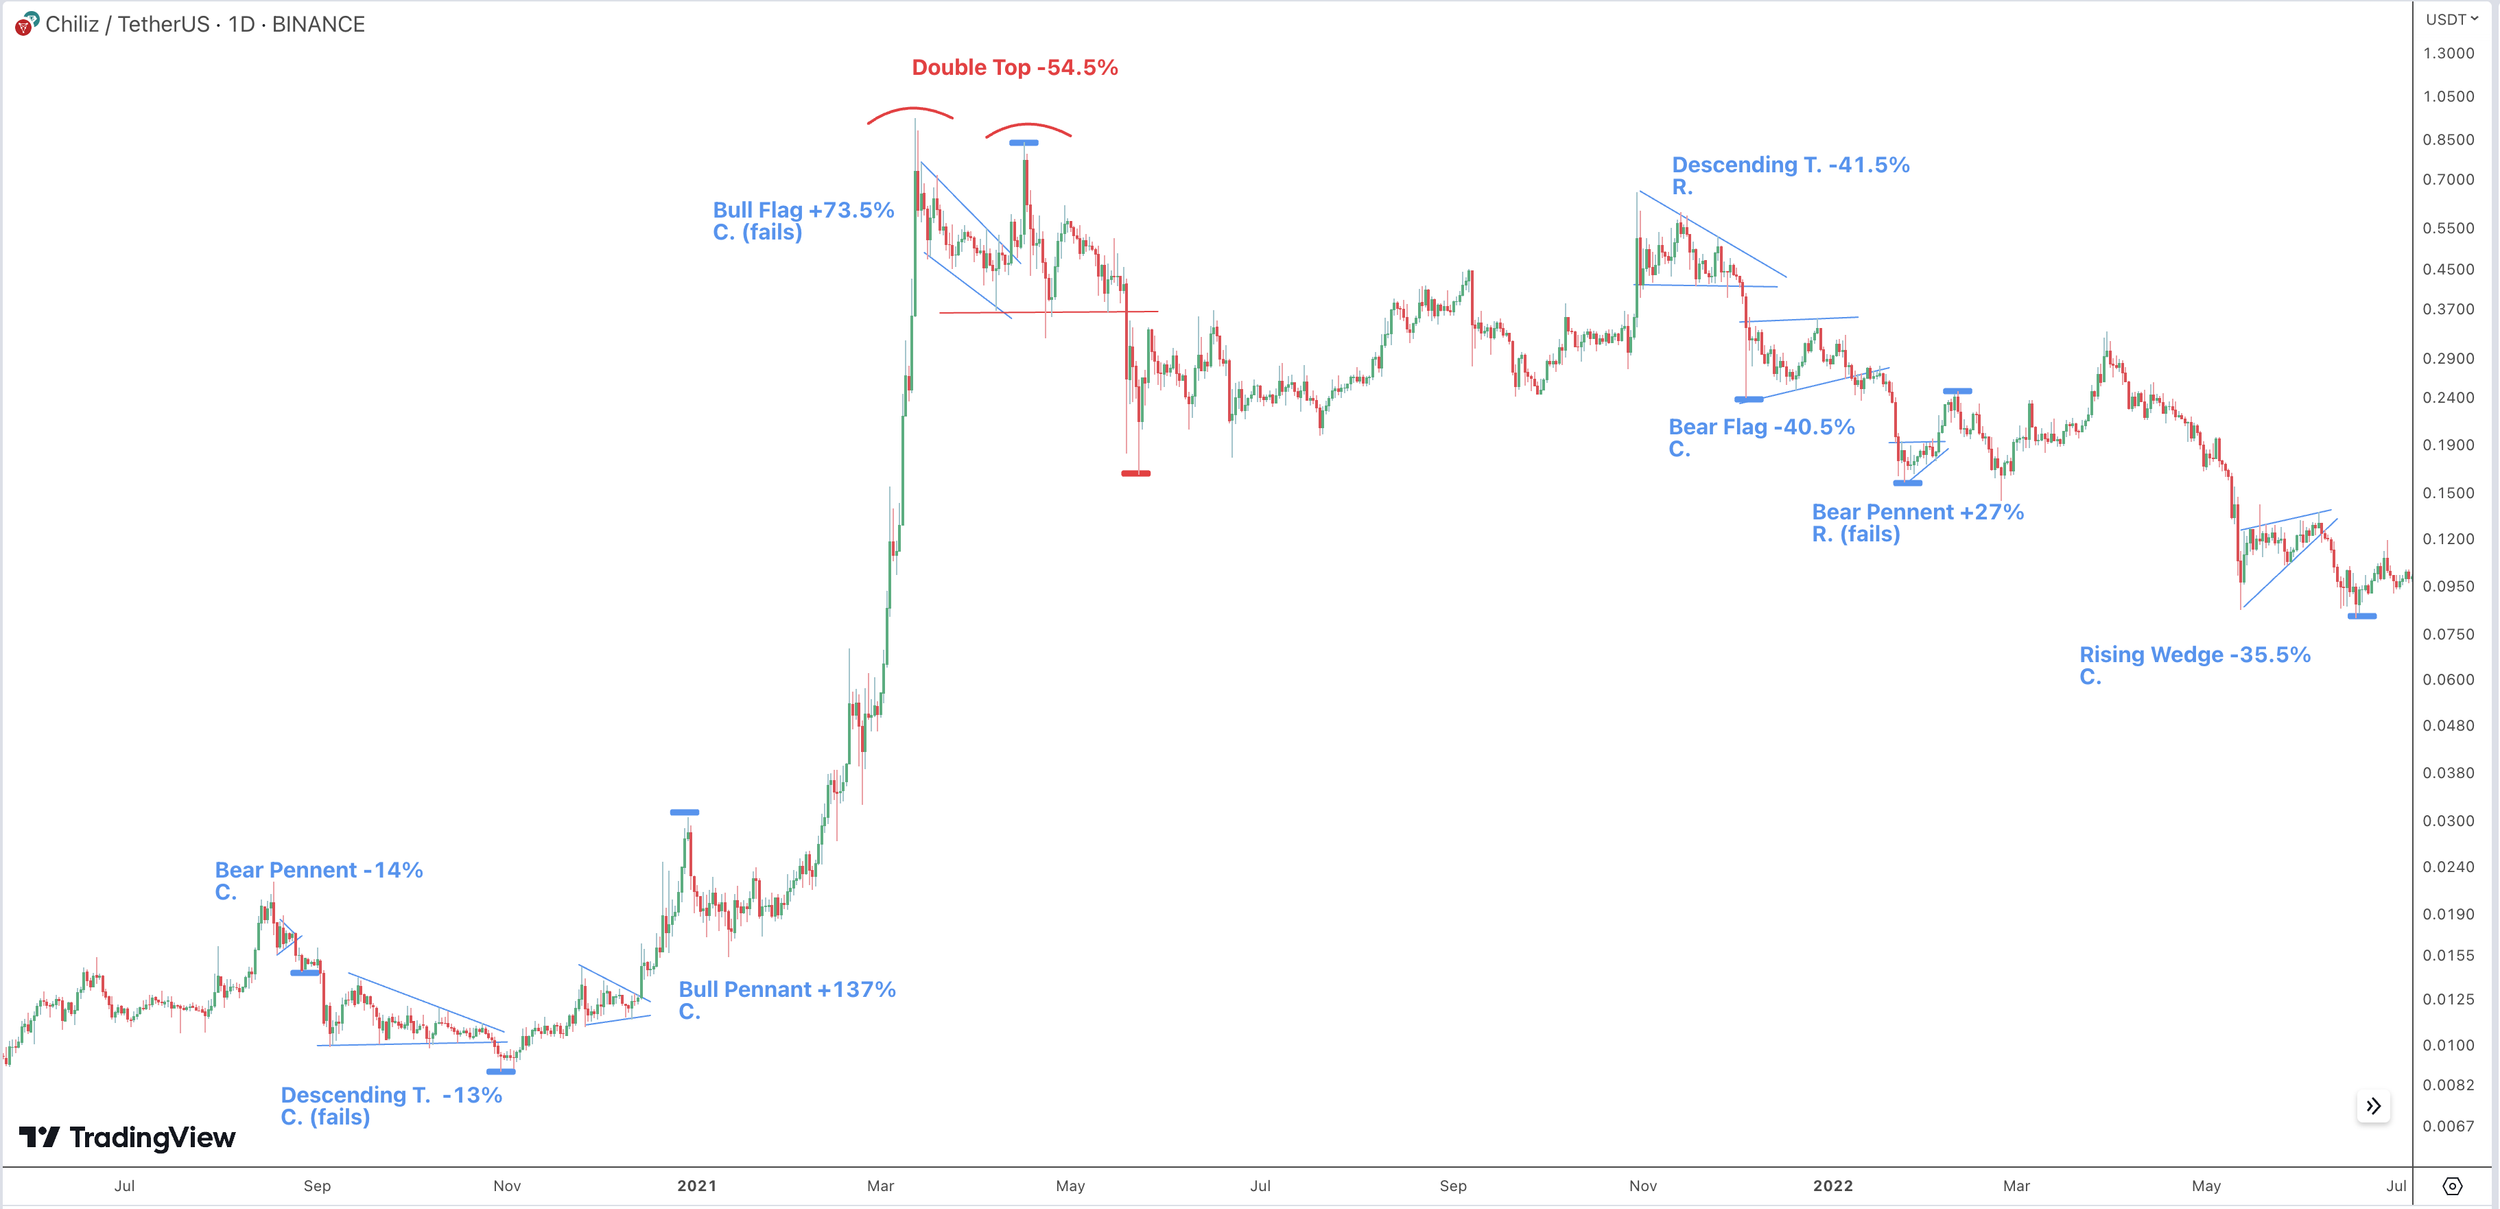
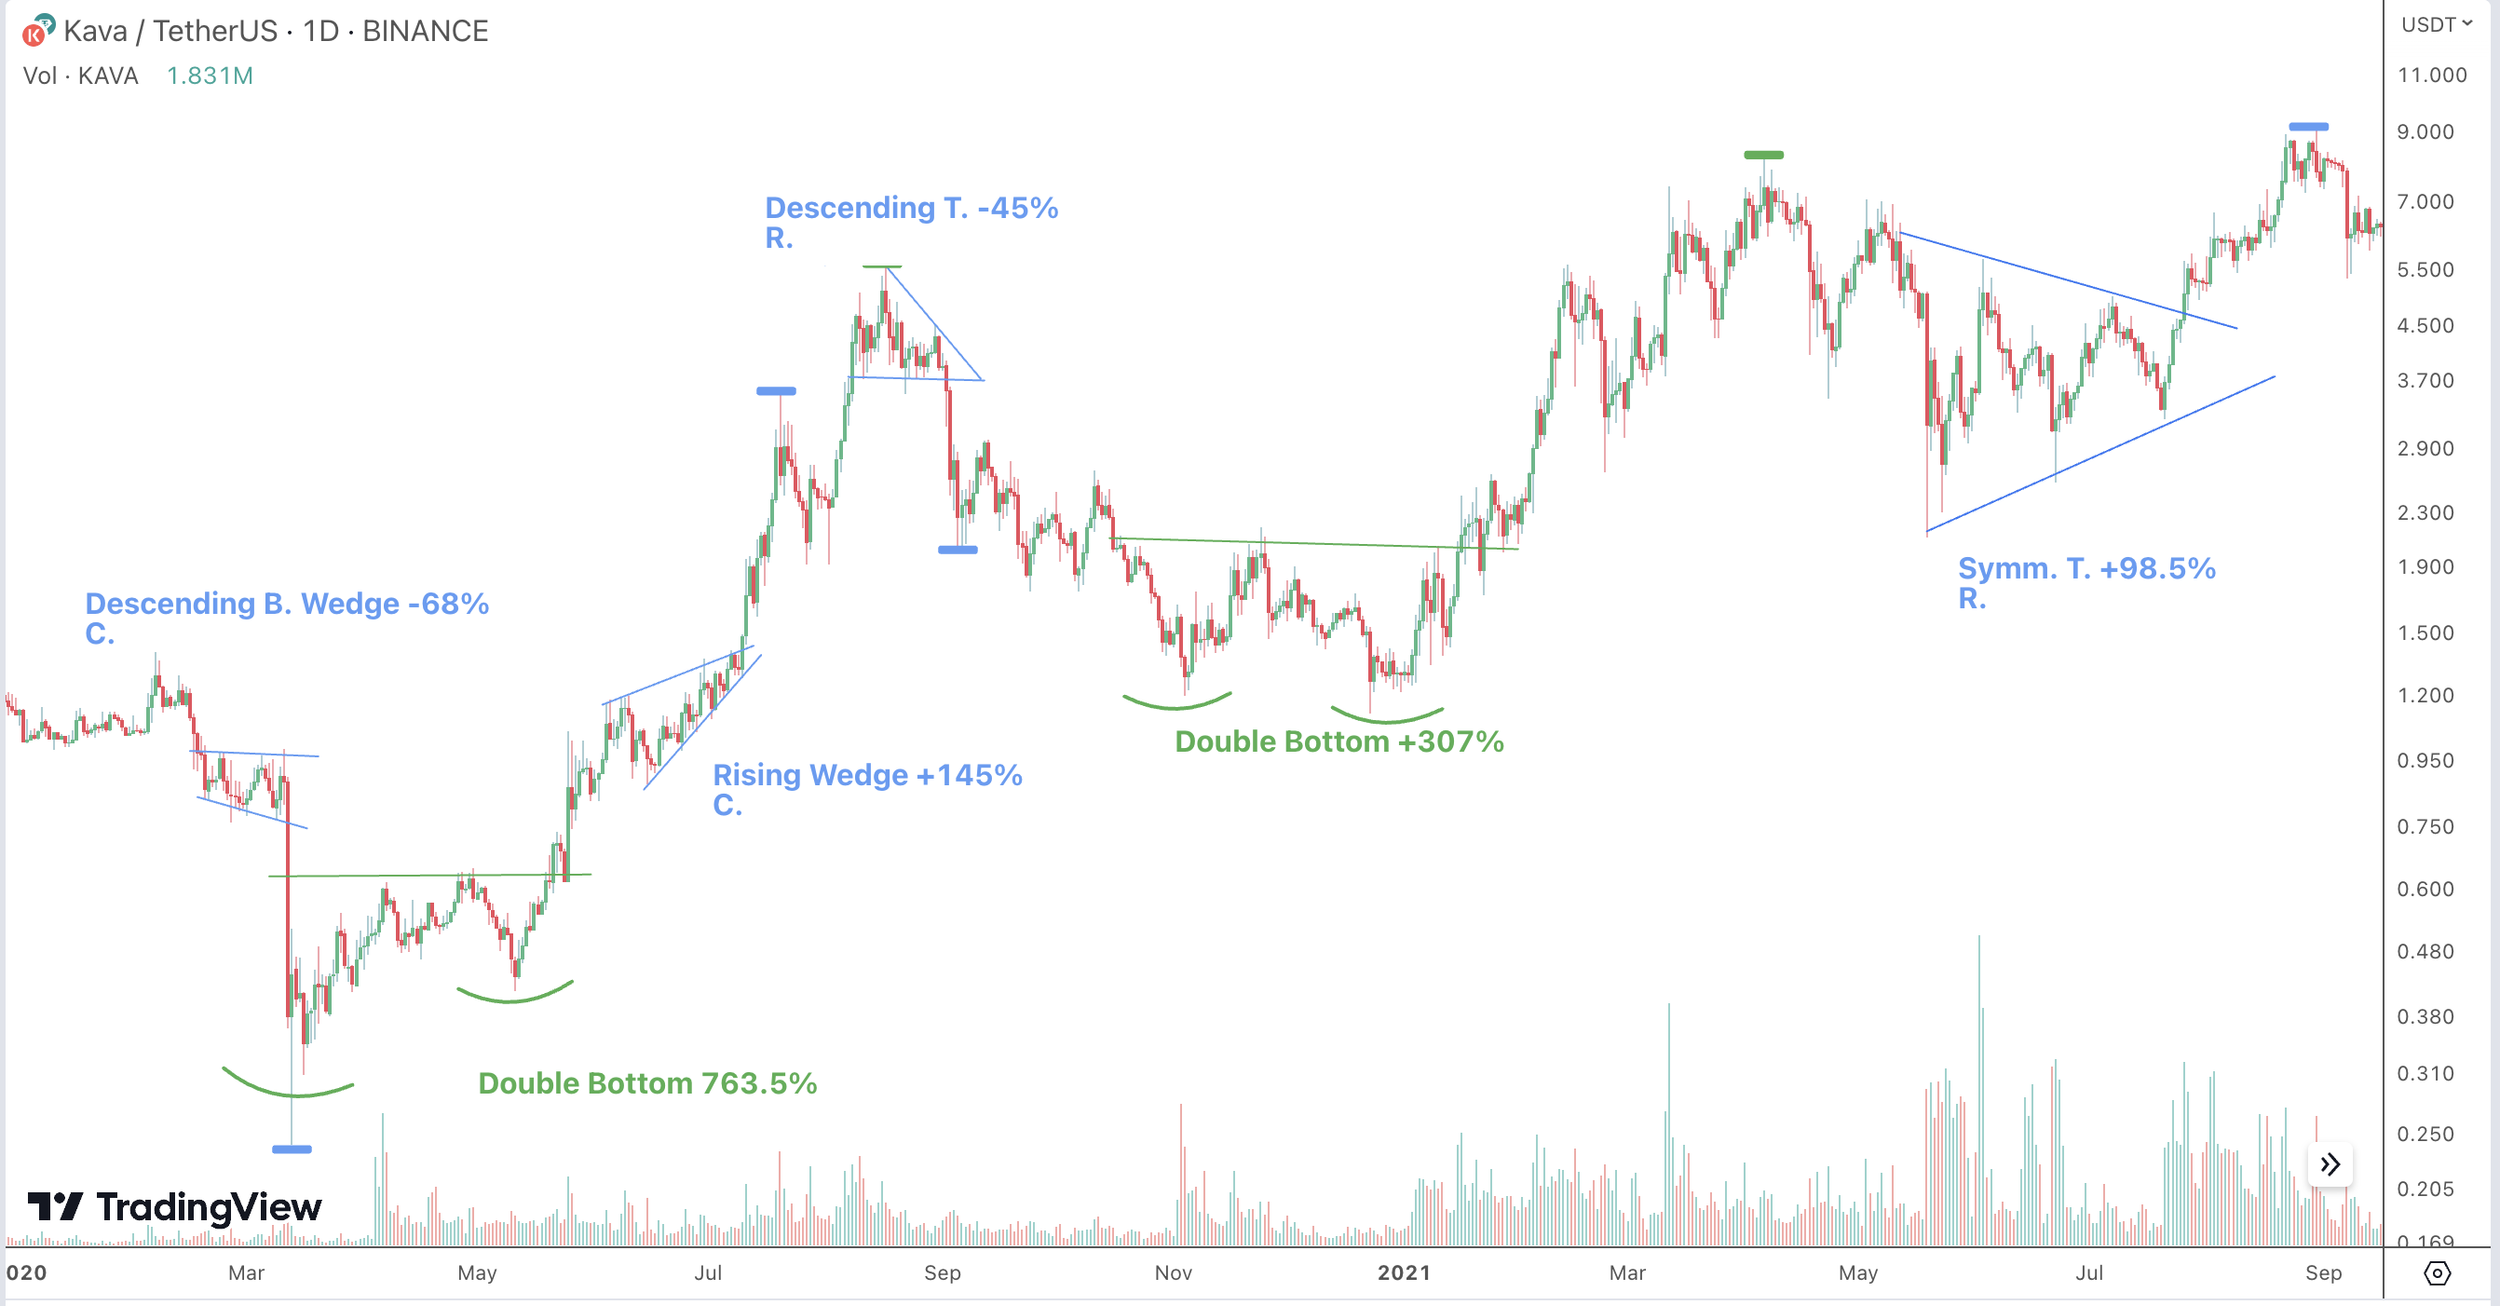
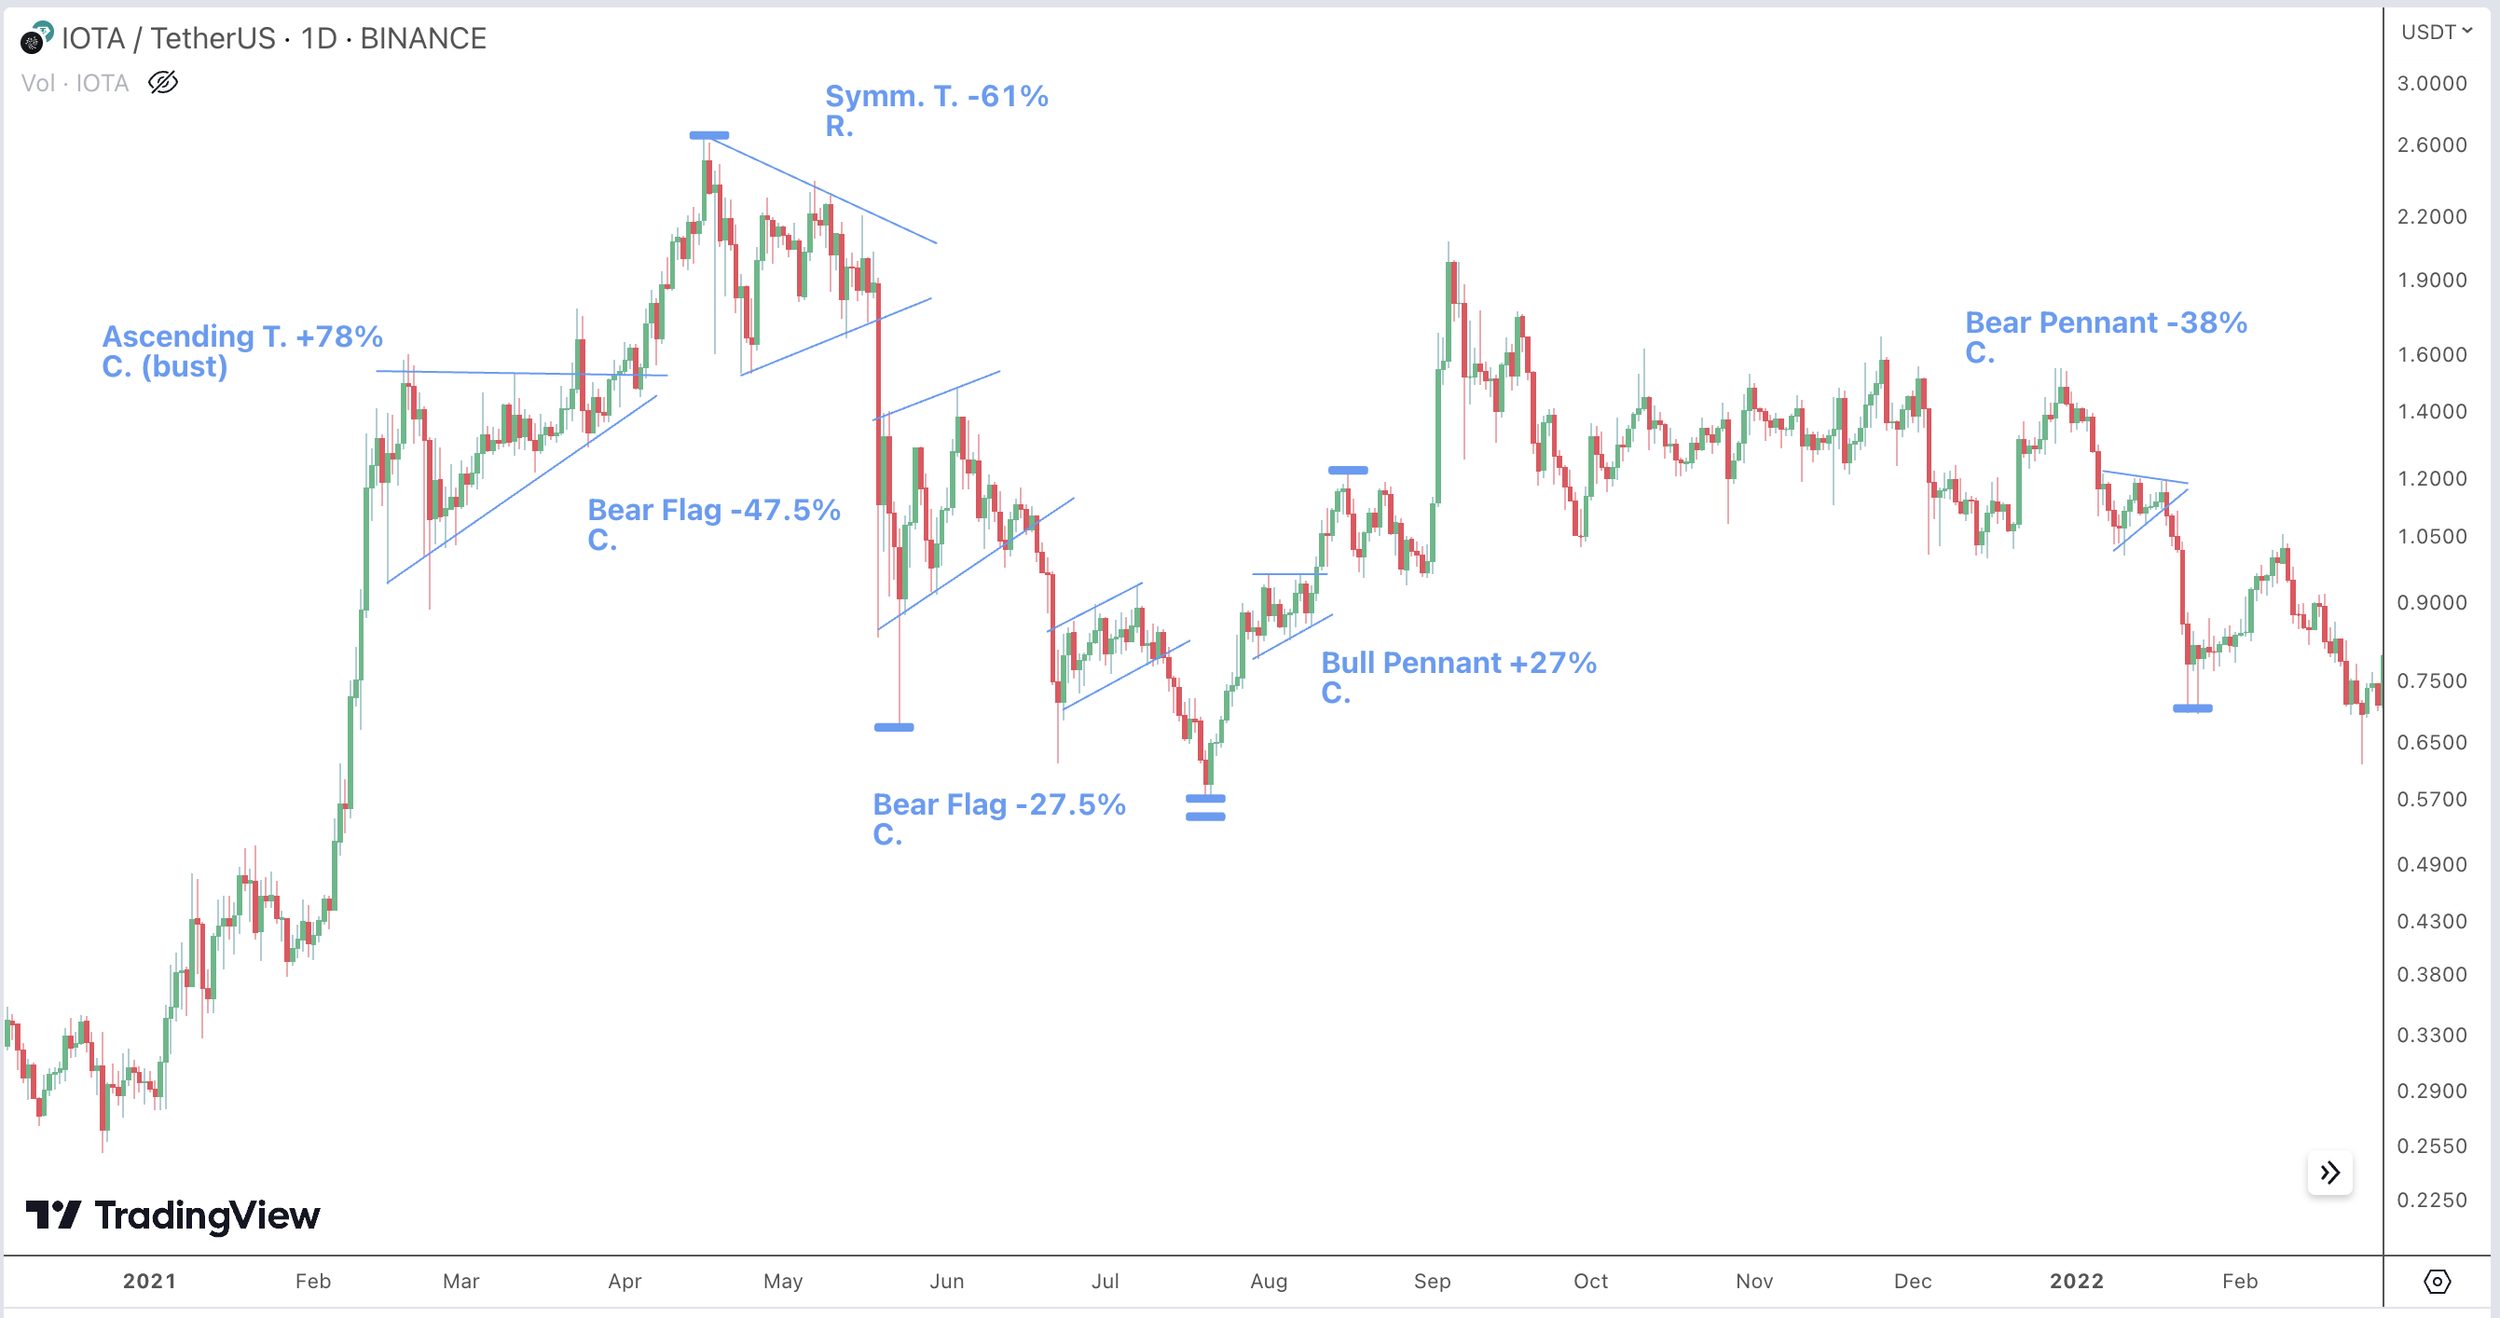
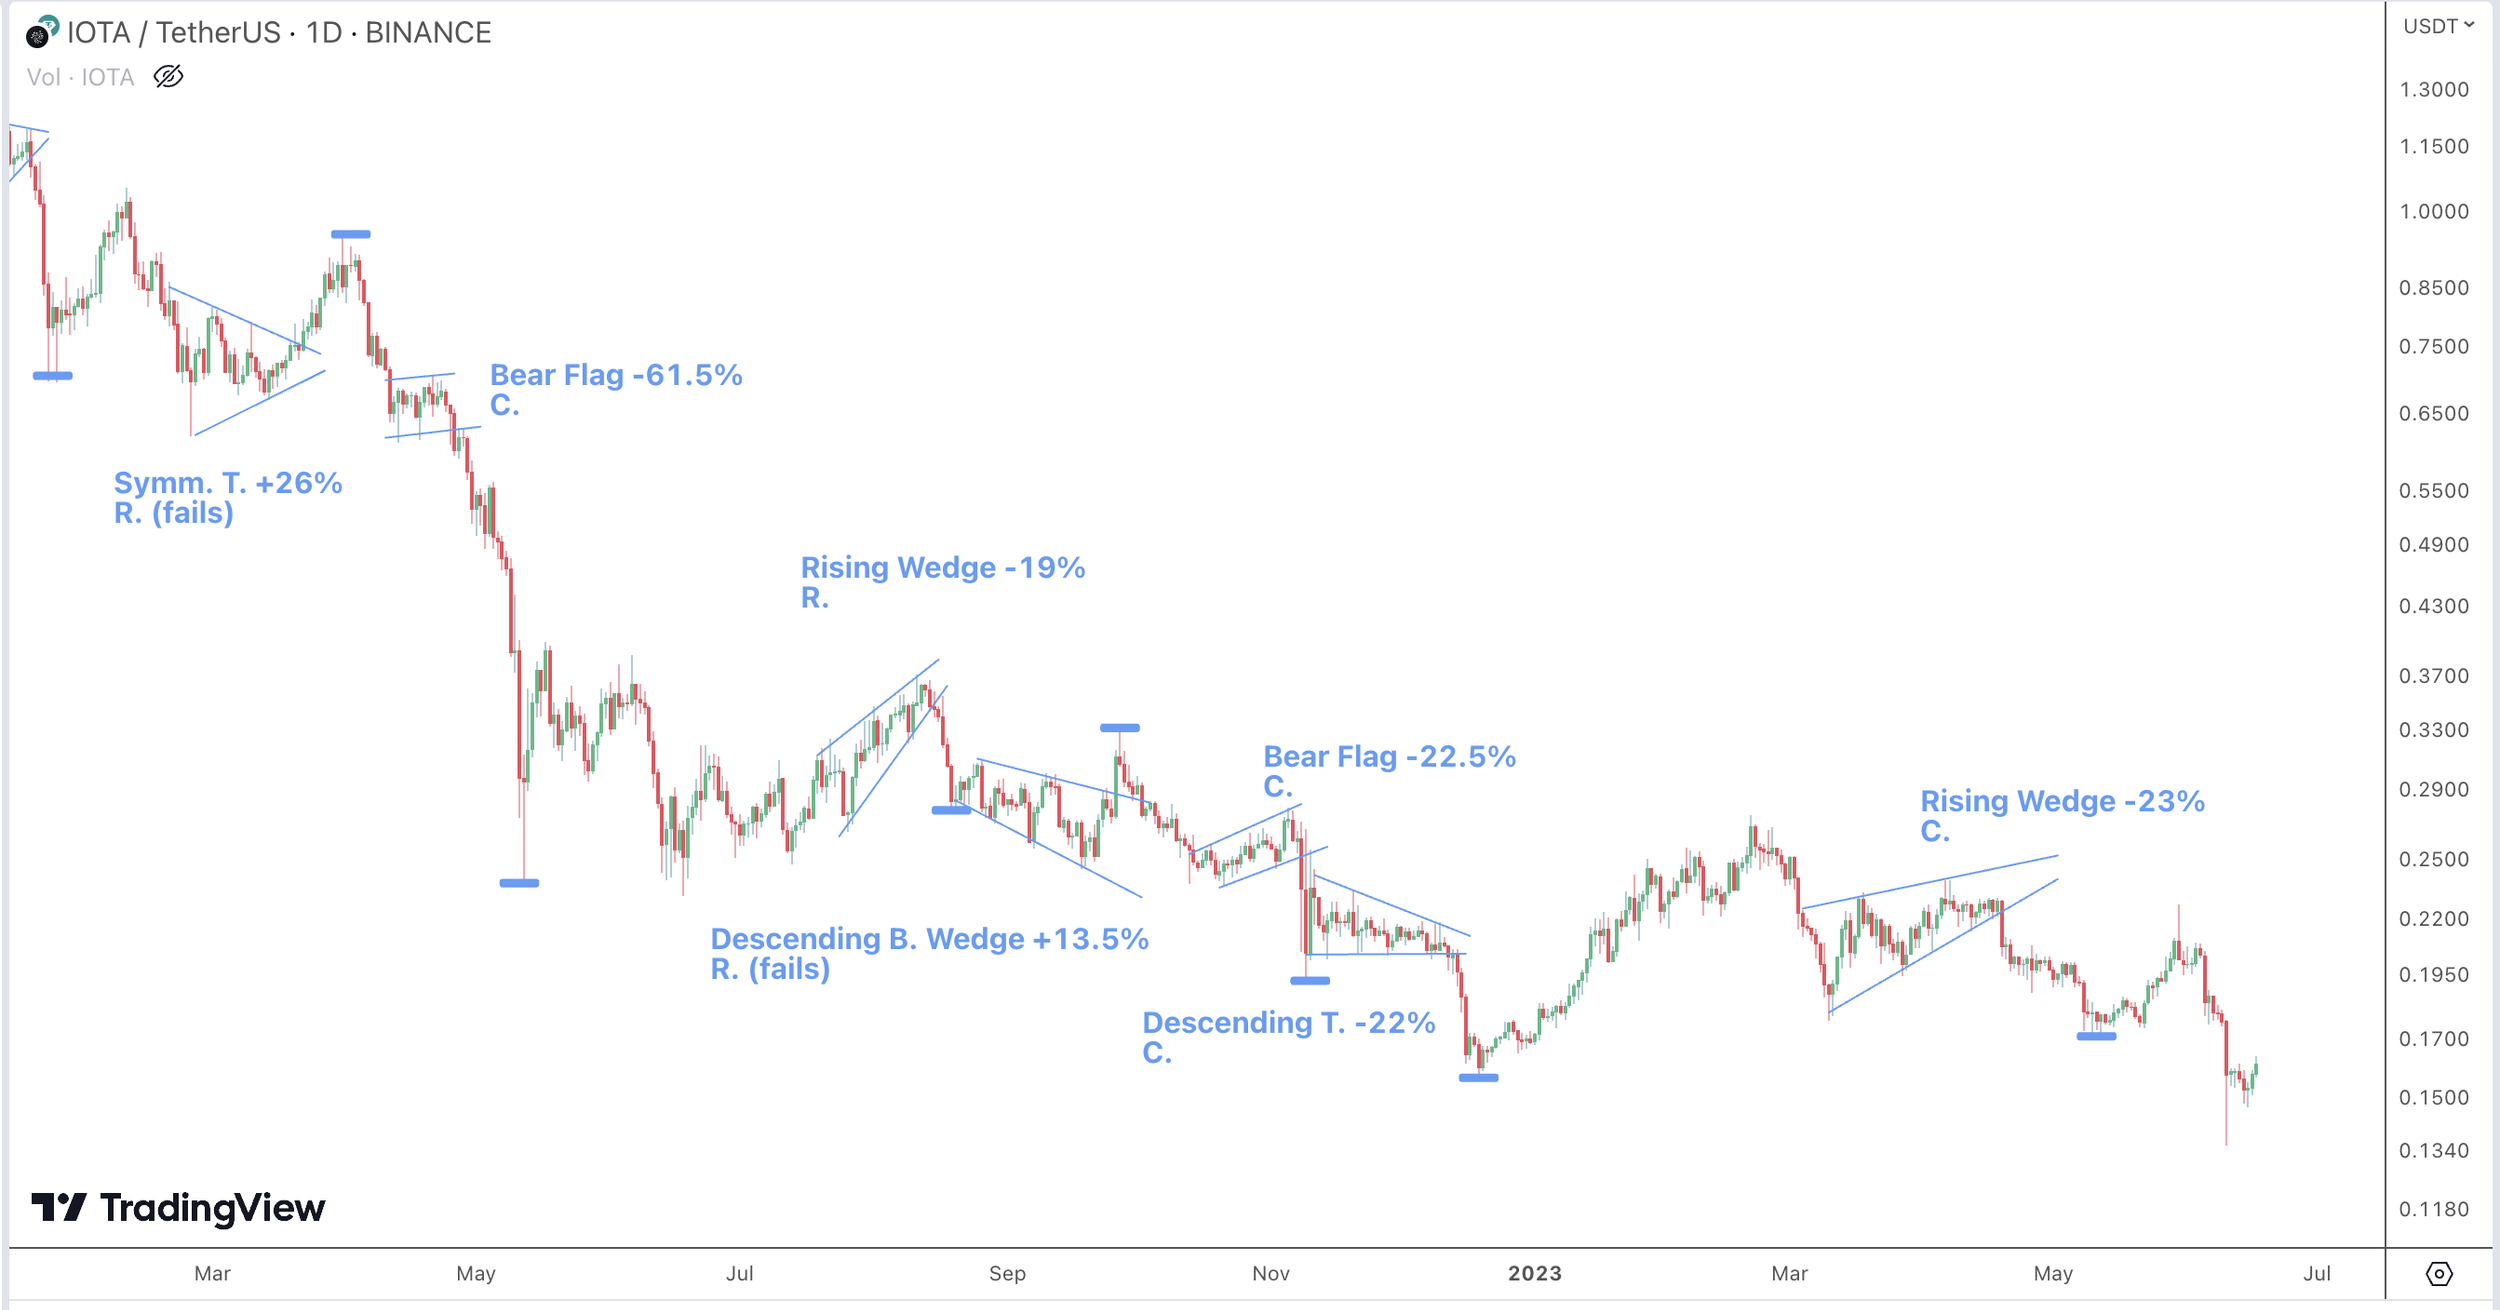
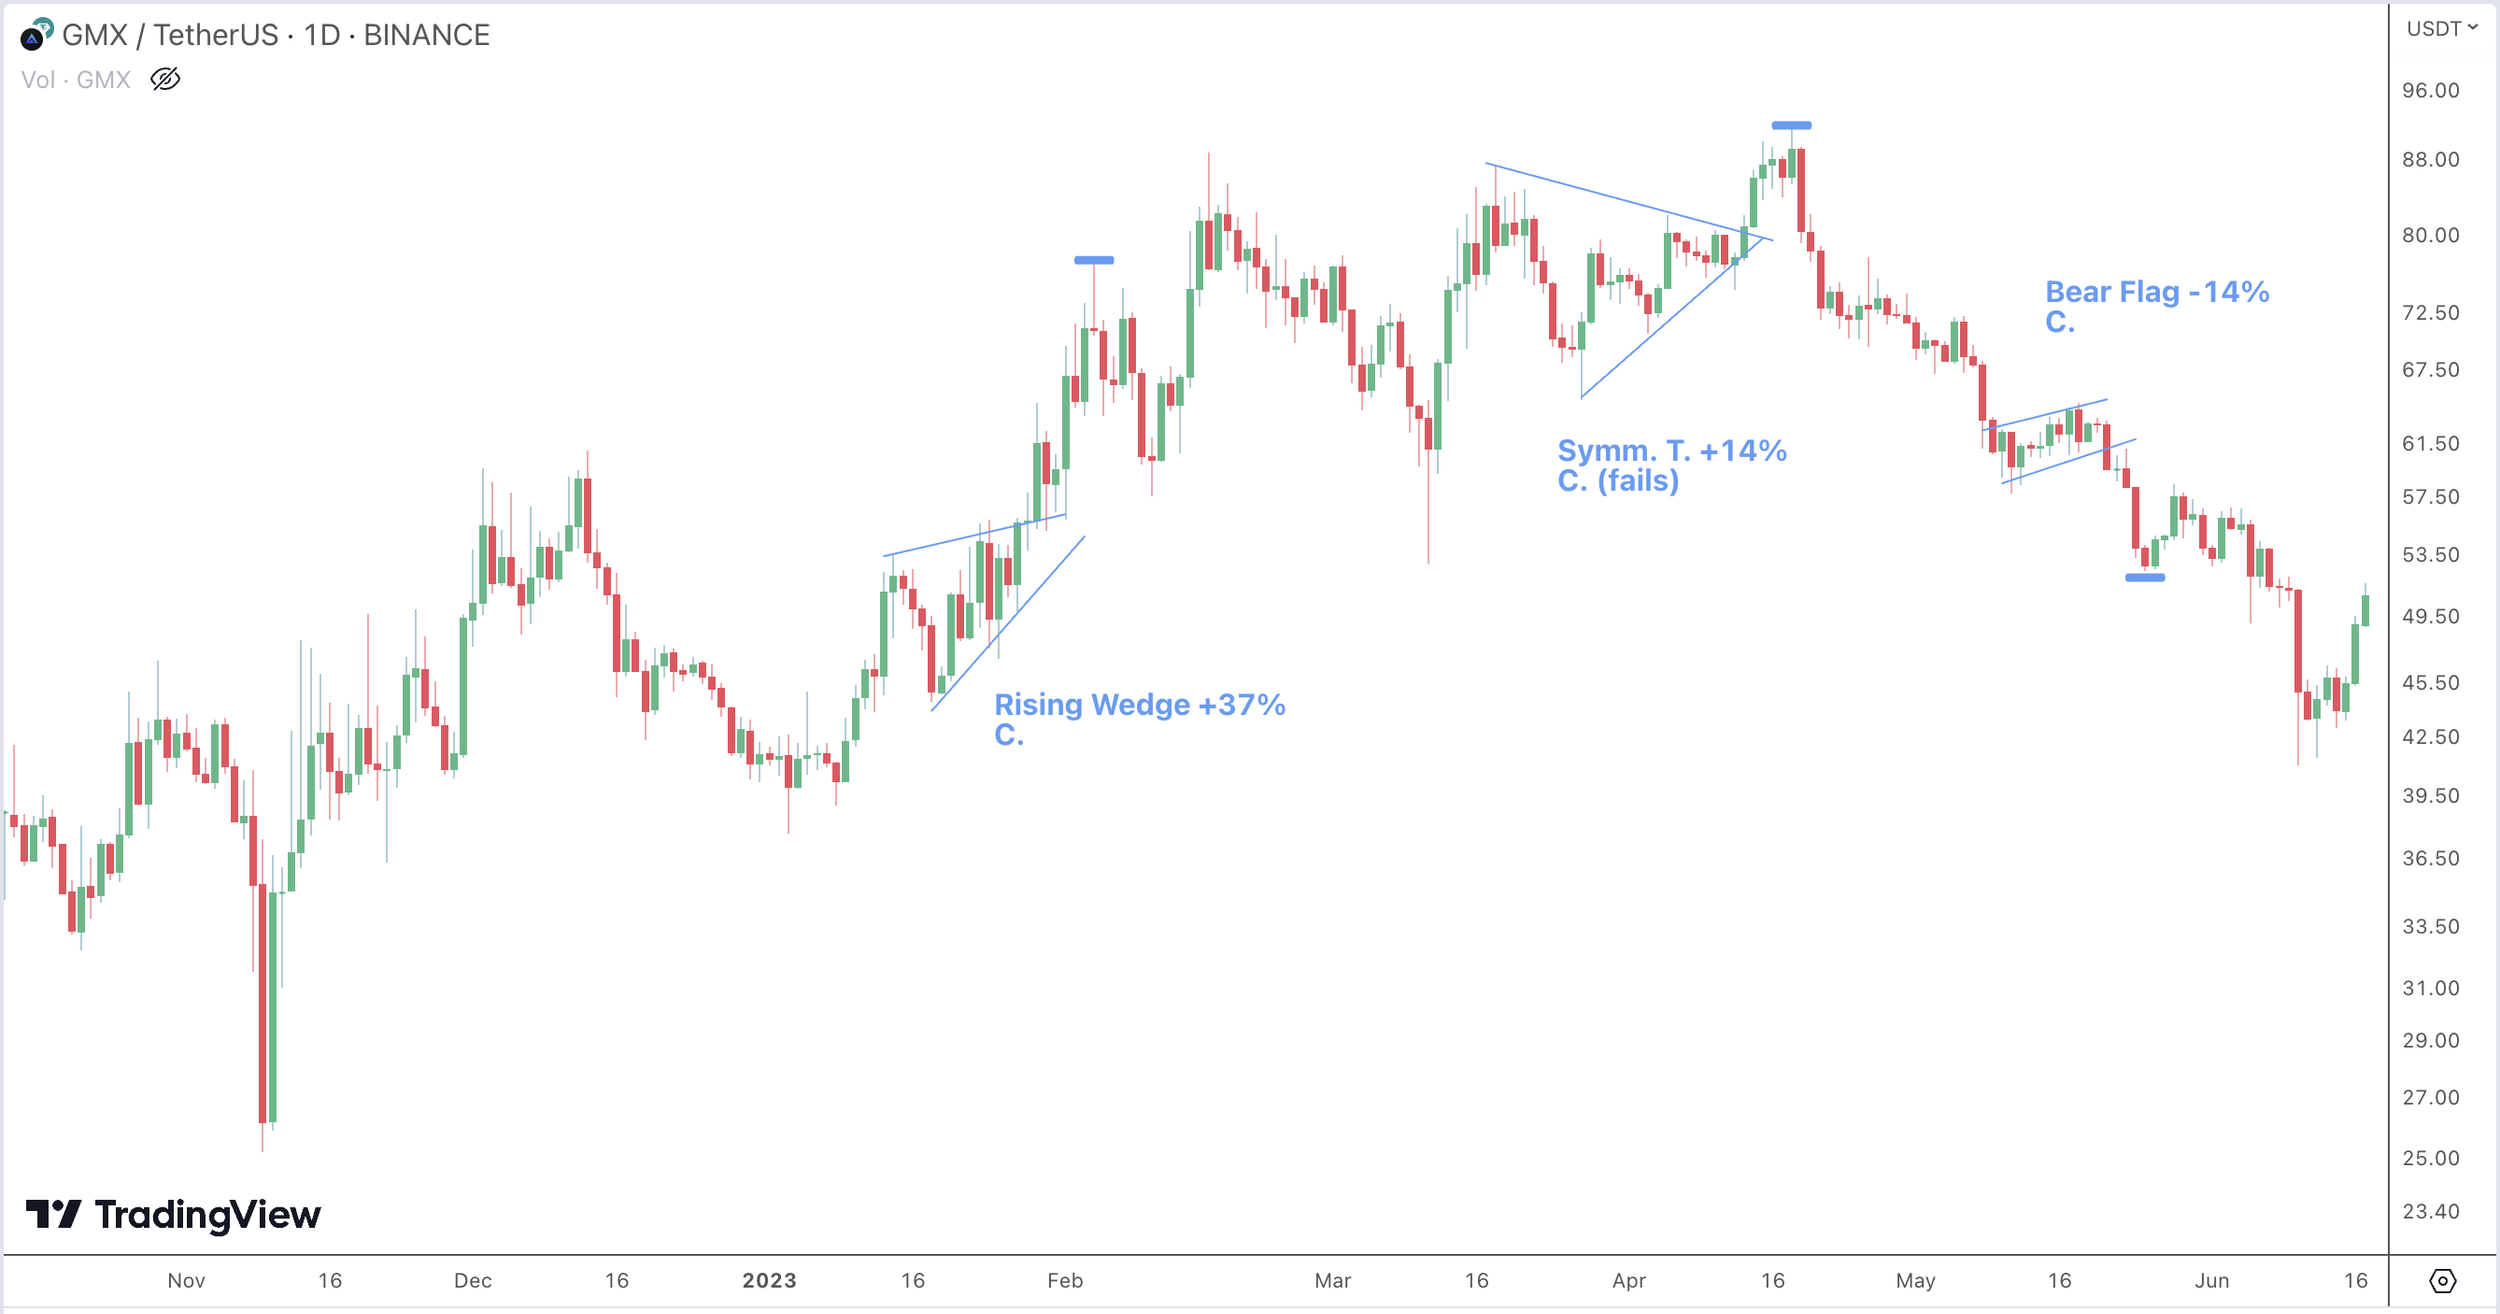
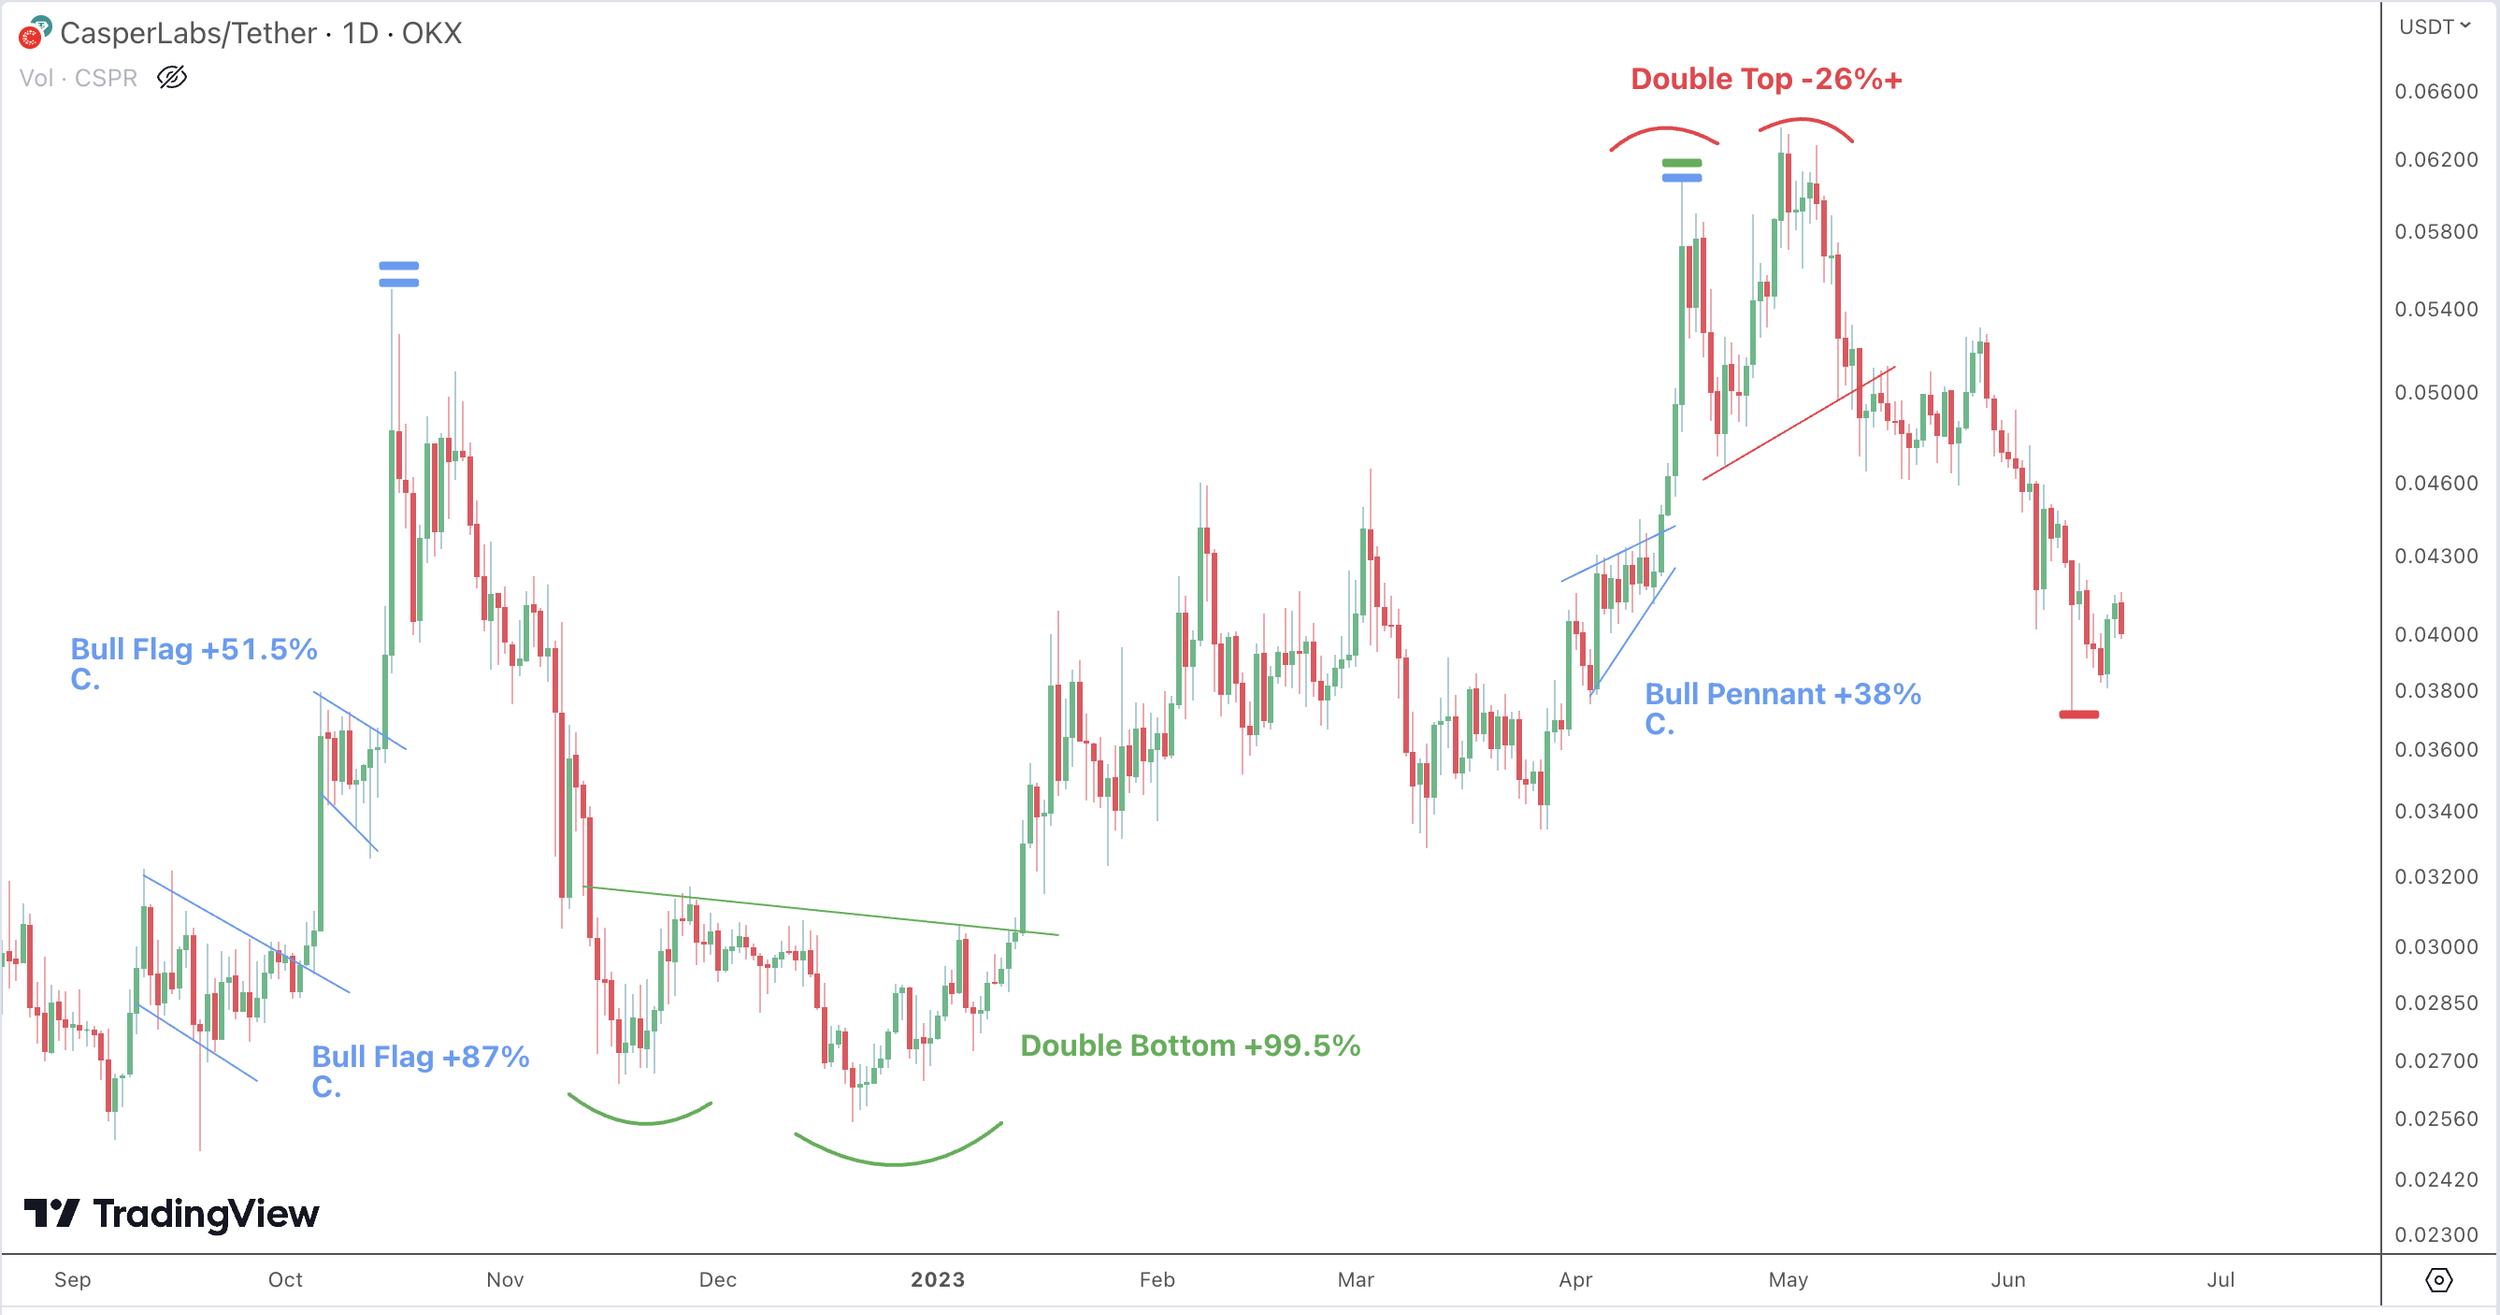
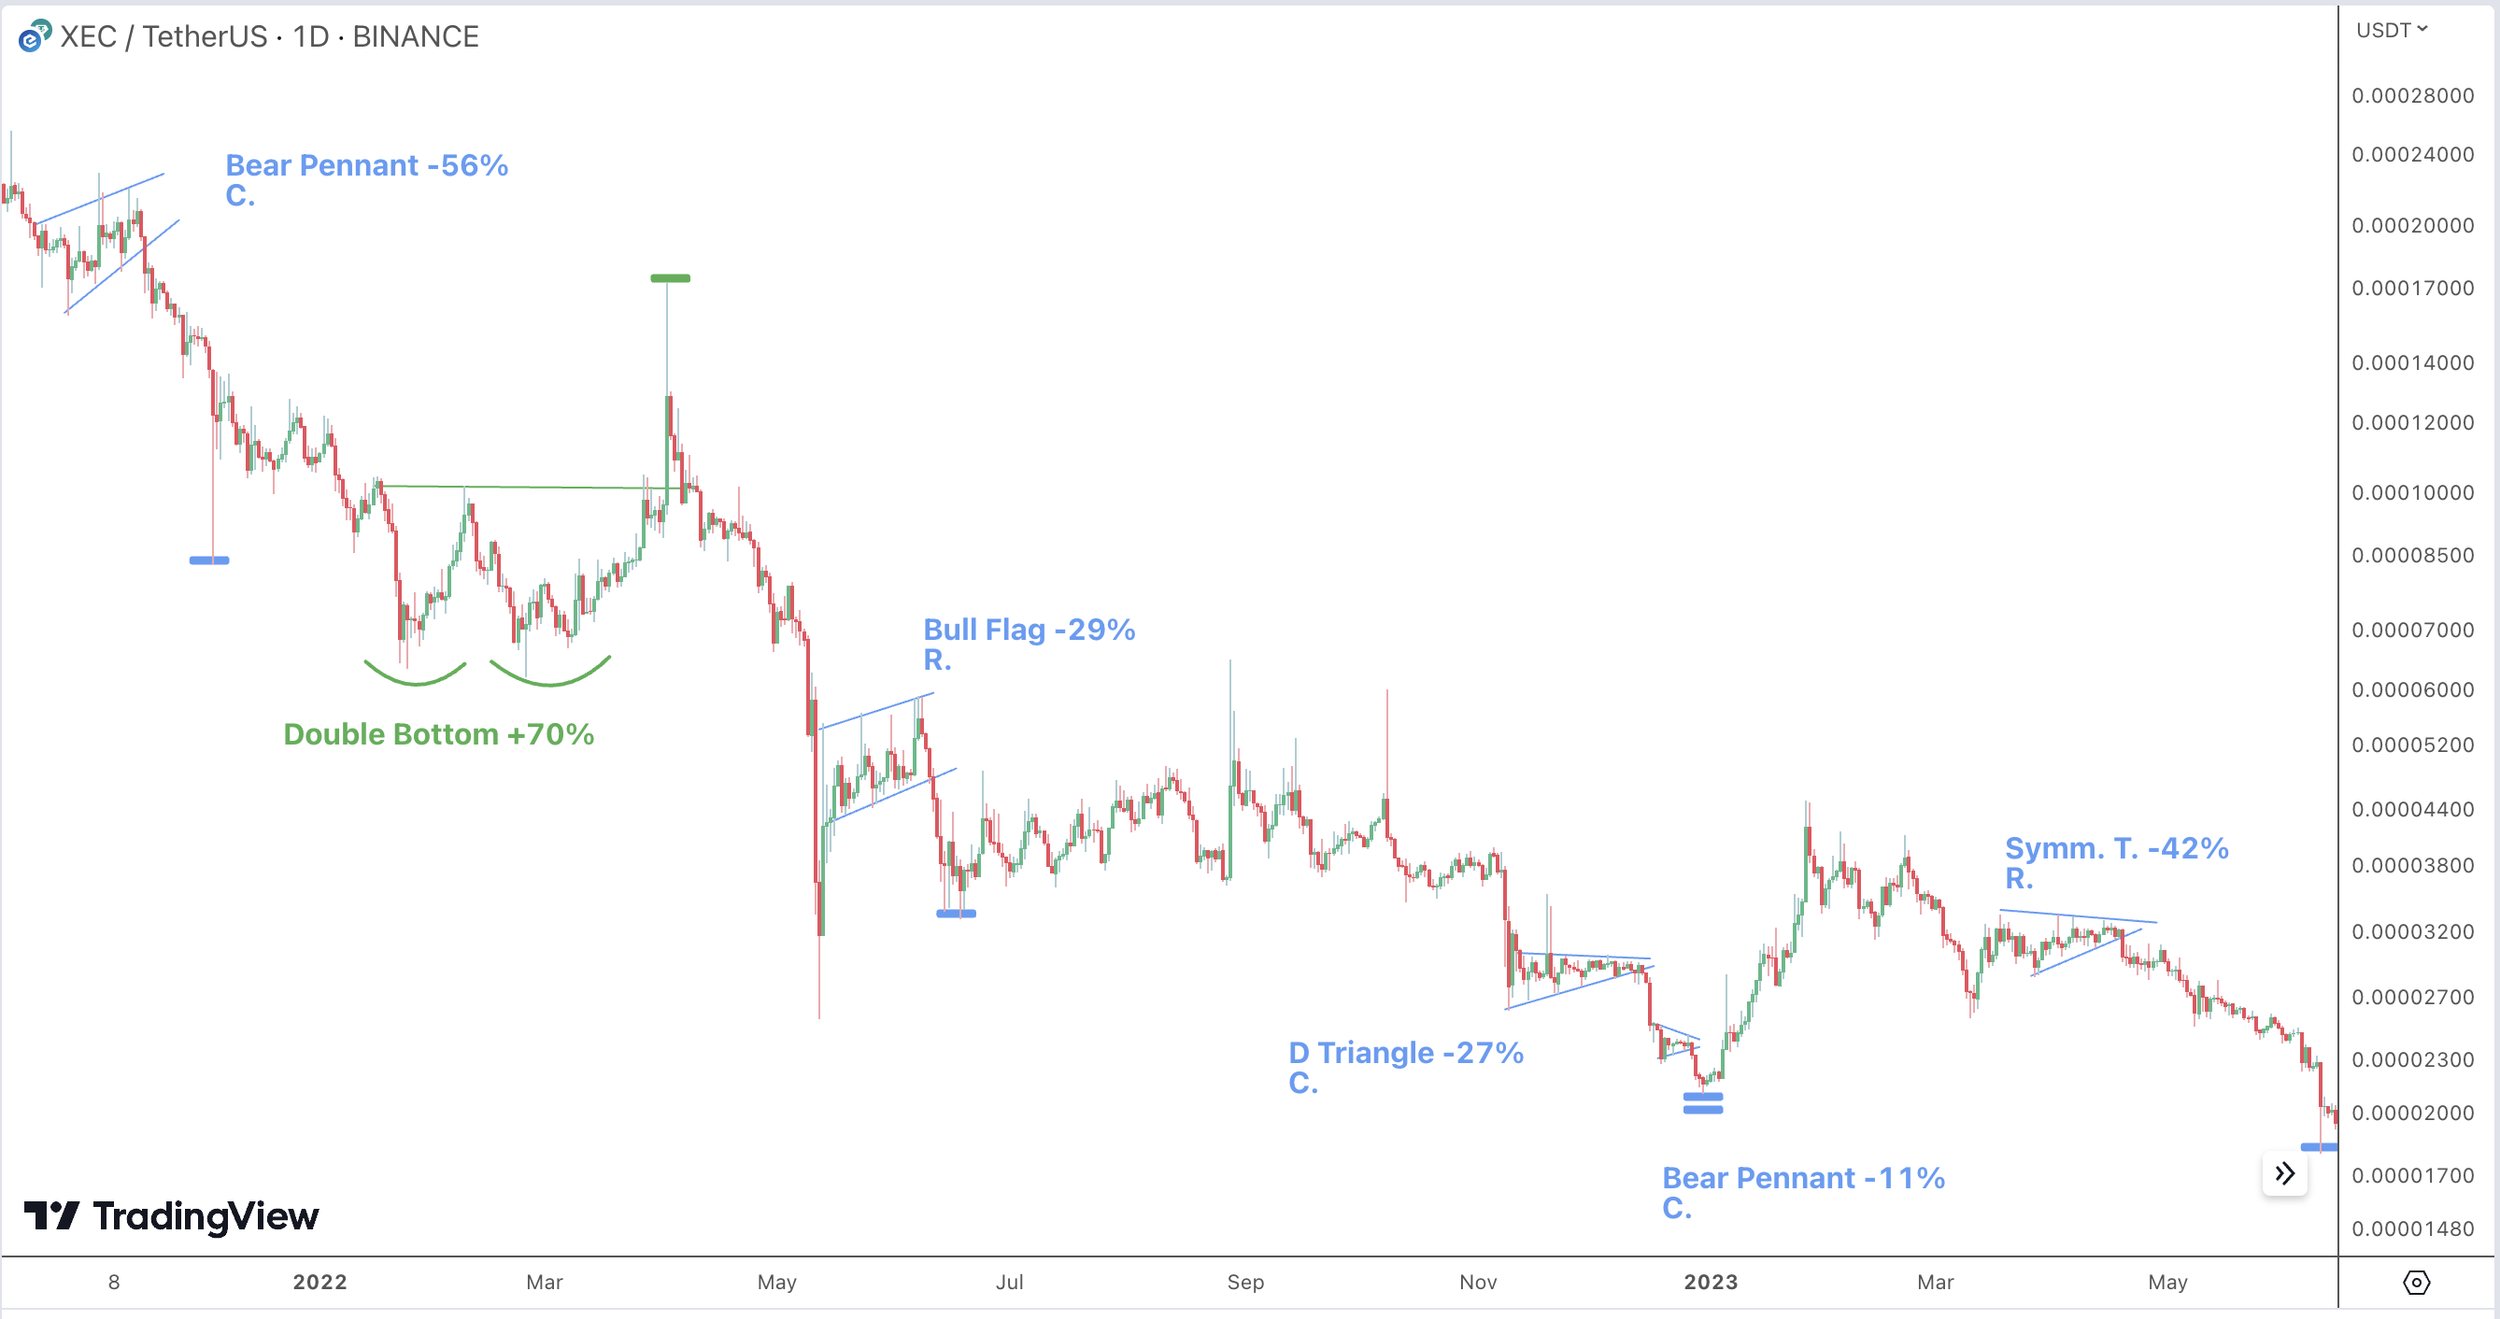
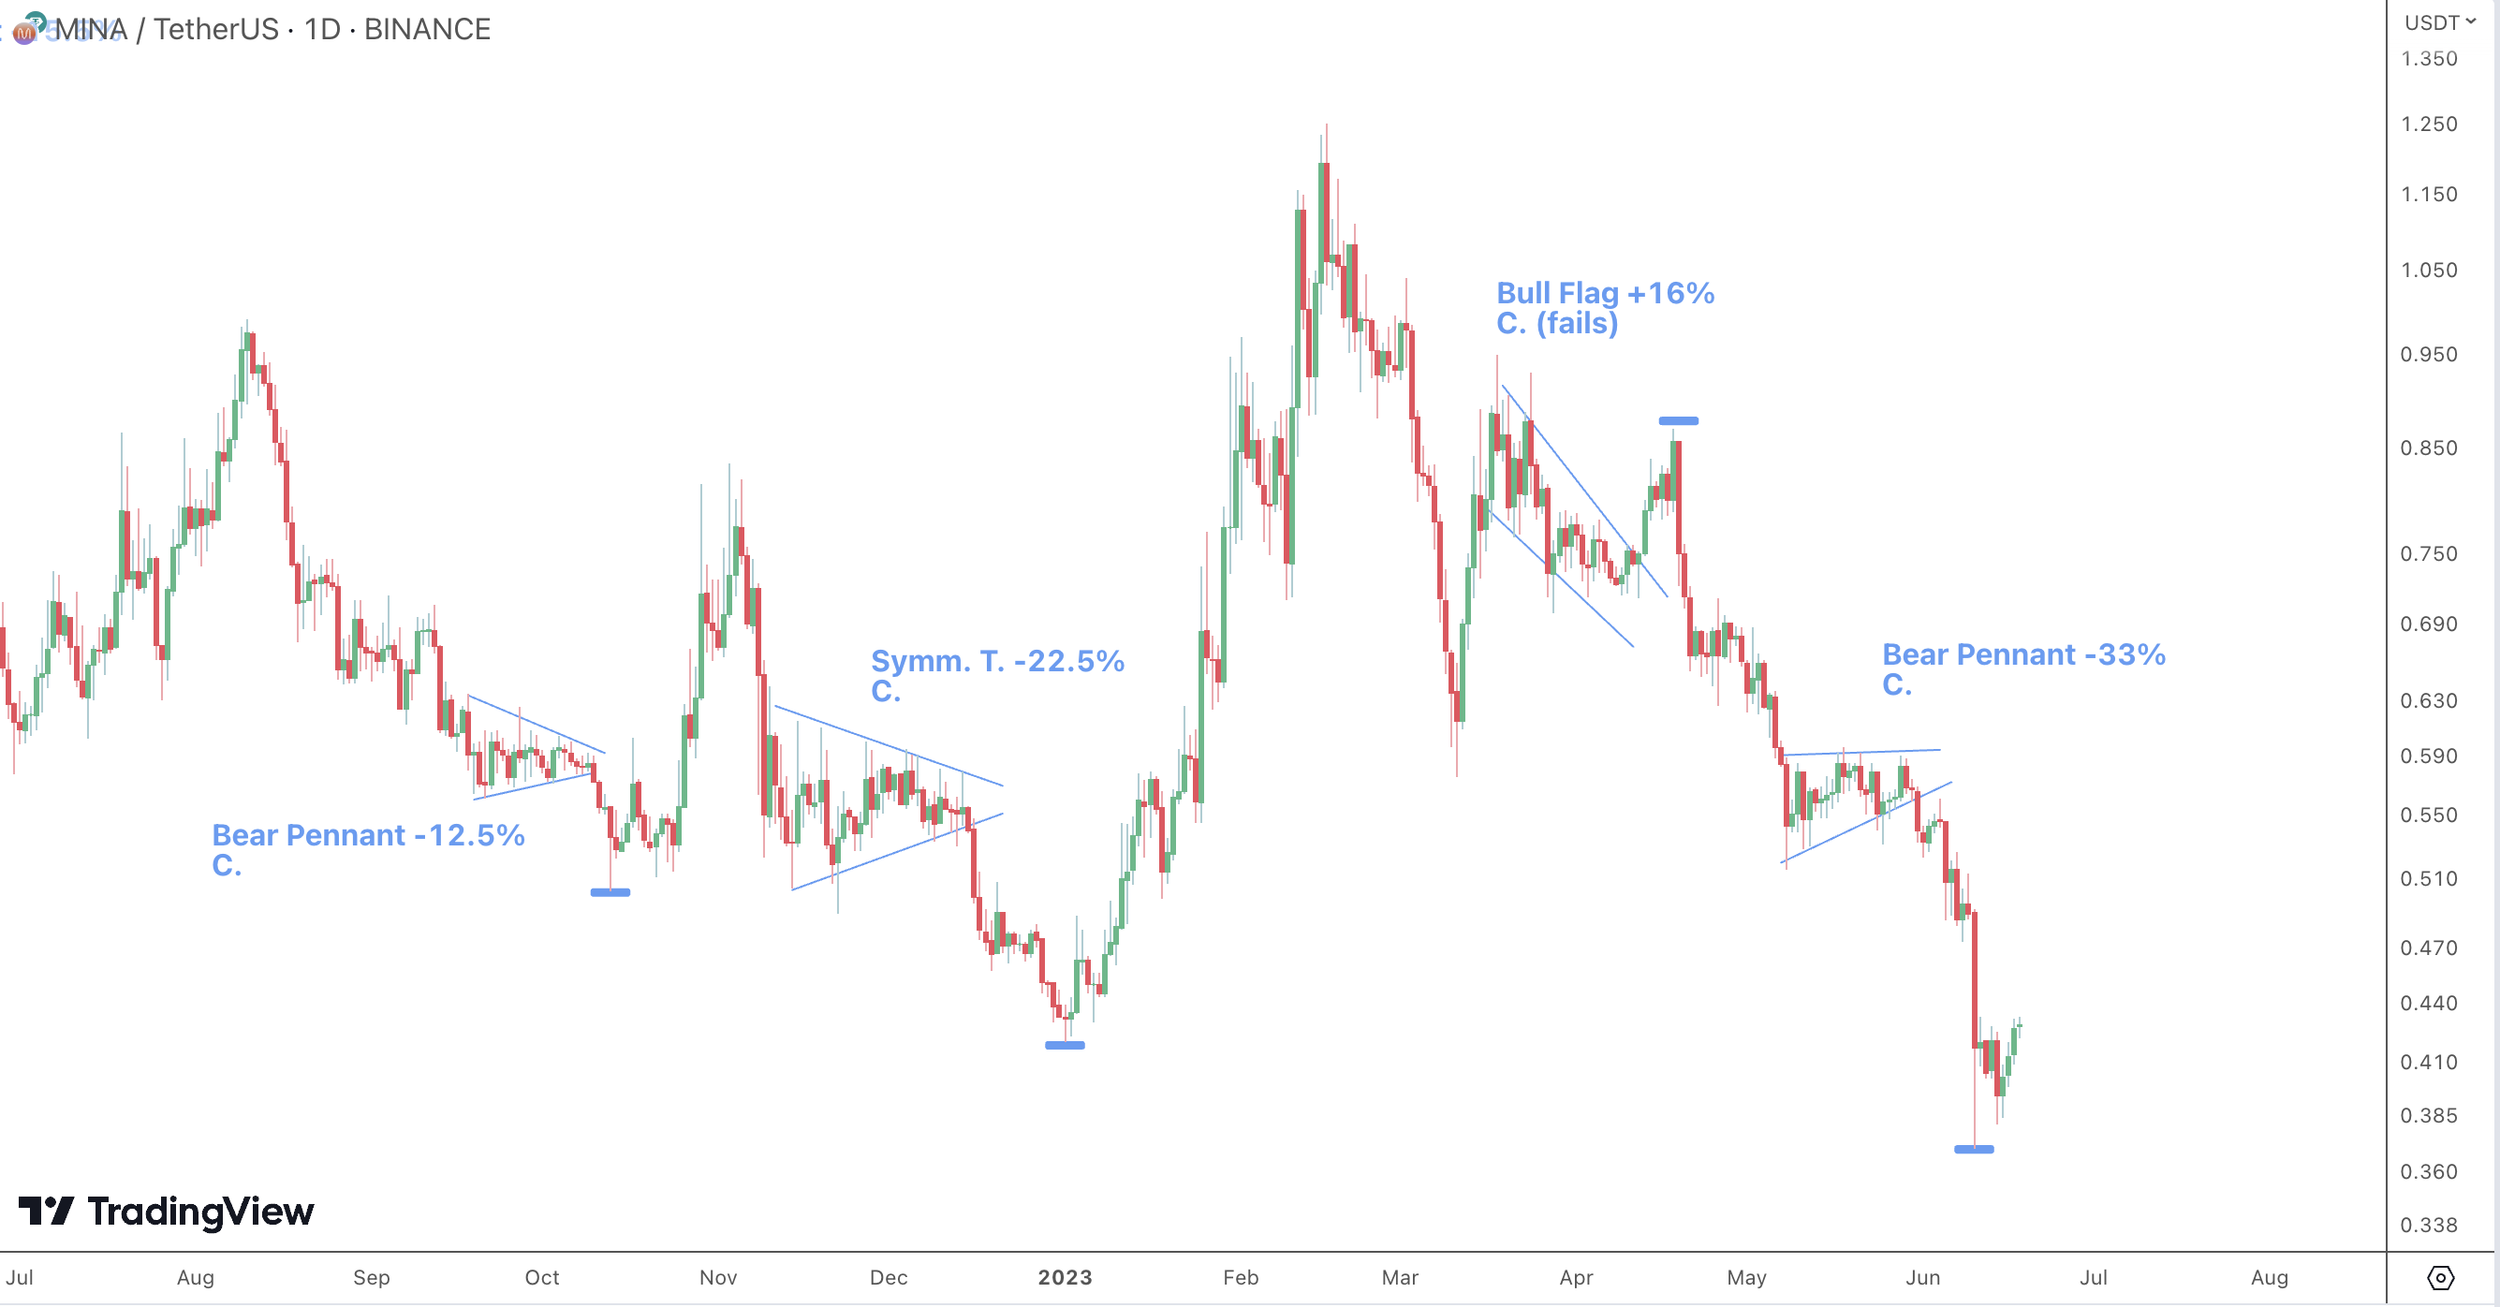
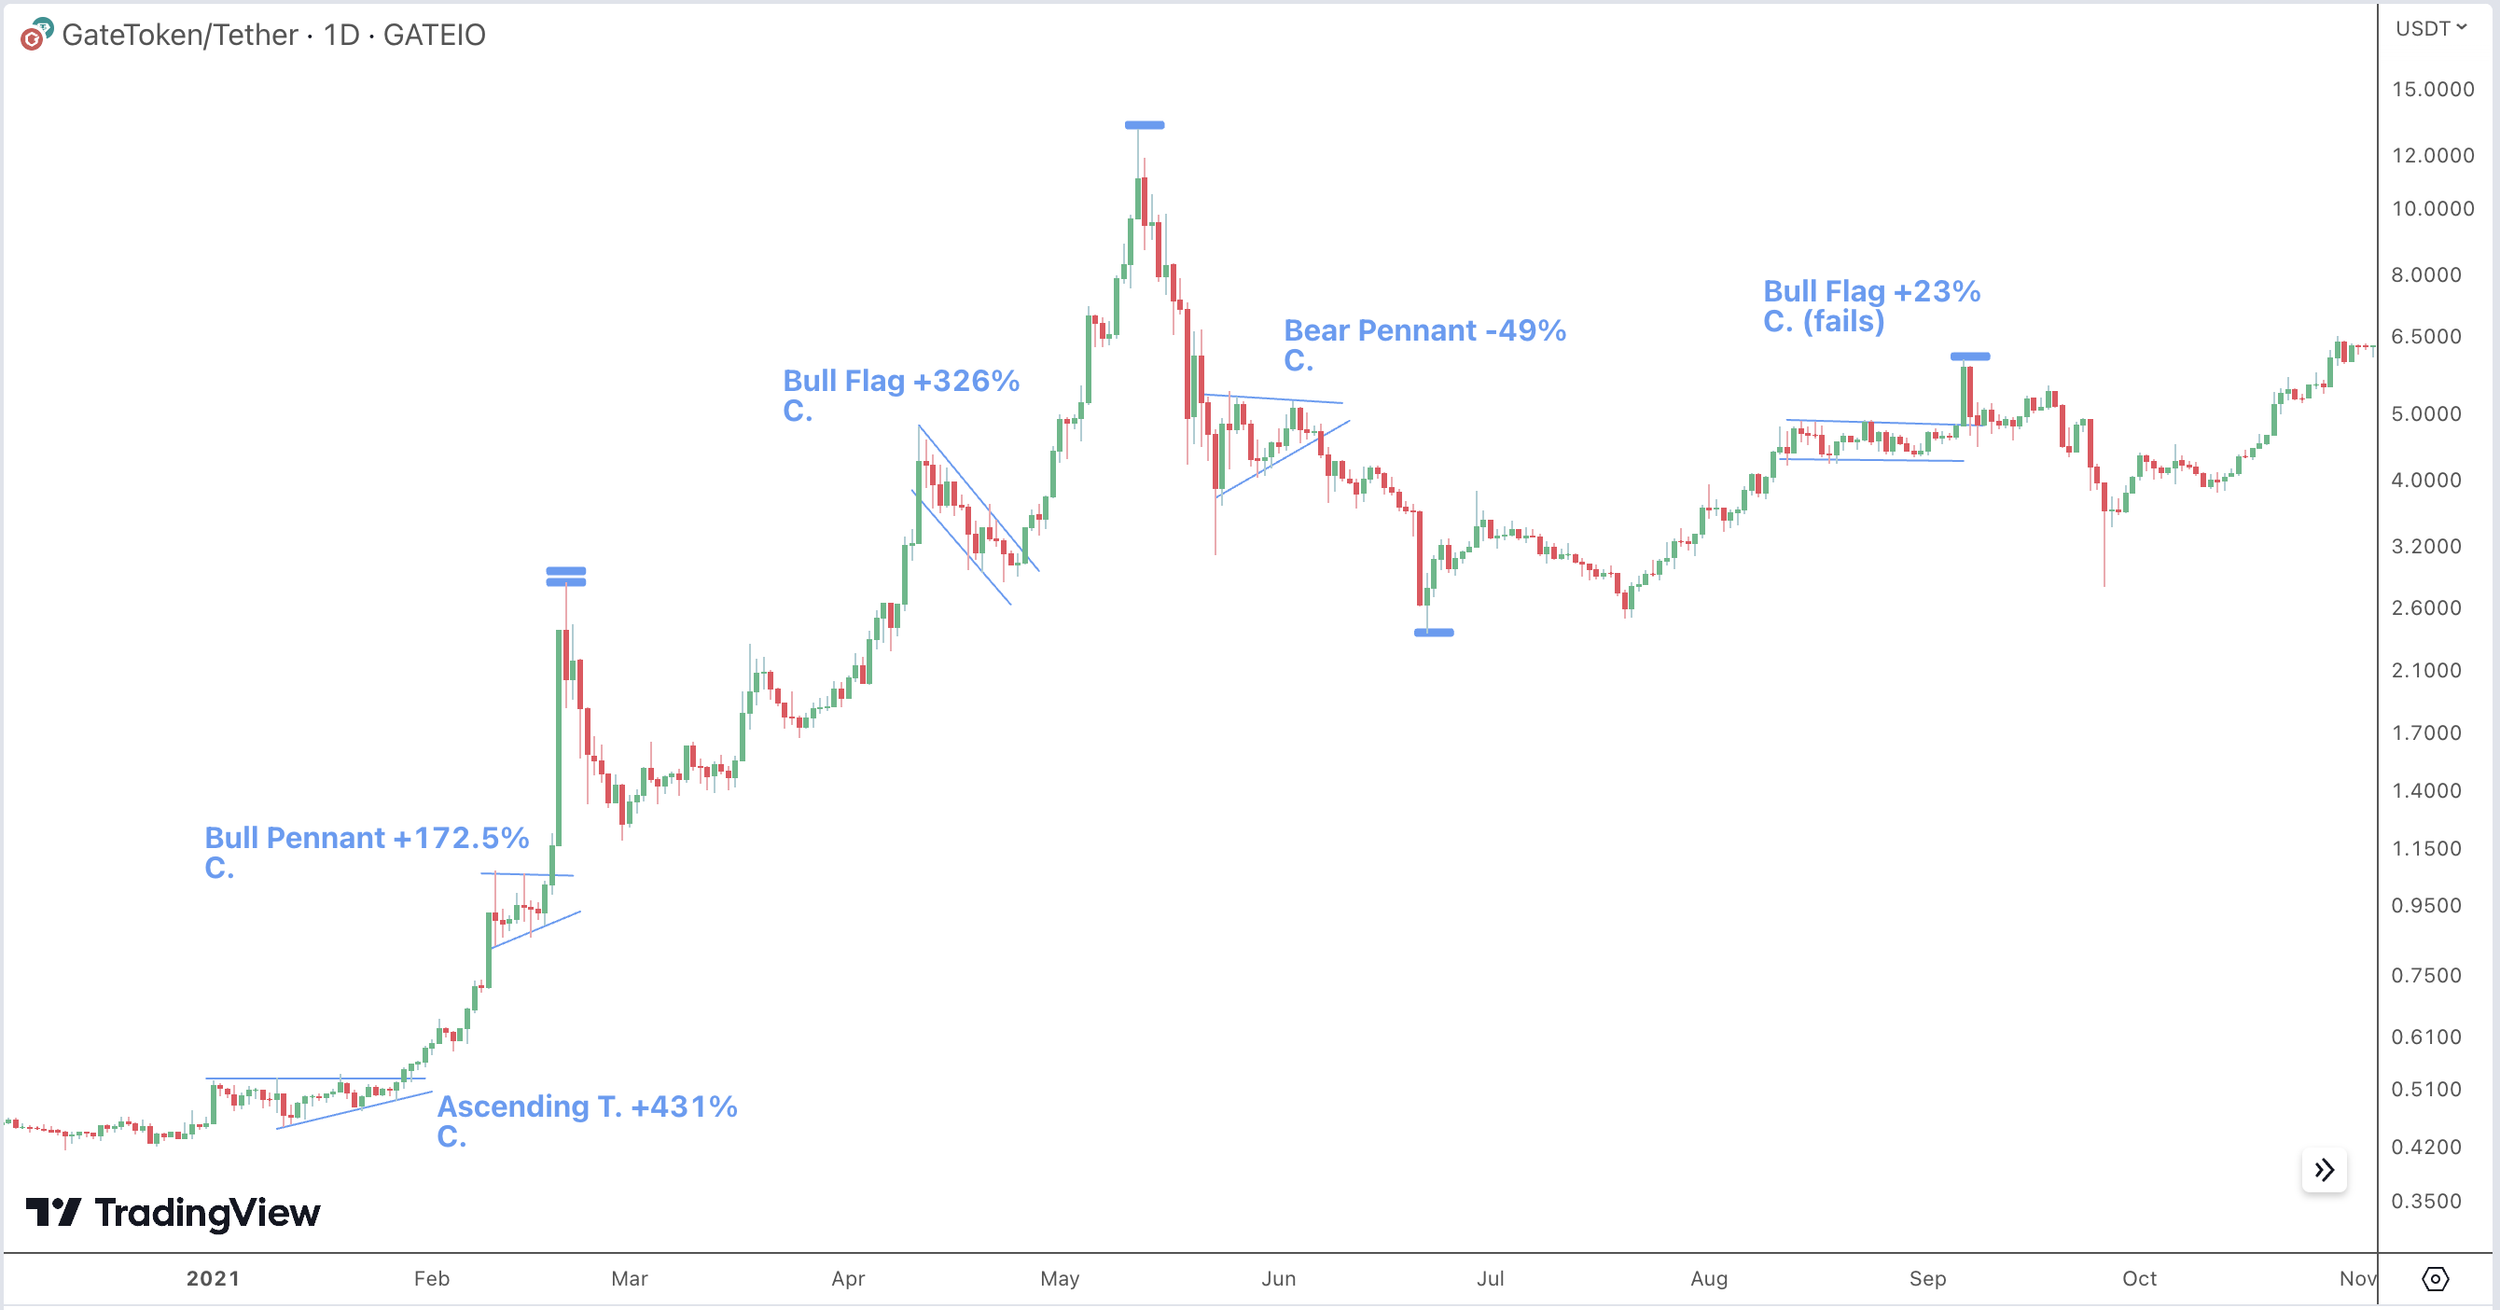
To date, pattern-based statistics are widely drawn from analysis of stock or forex markets and do not accurately reflect the beautiful magnitude of cryptocurrency market volatility. Noticing a lack of research done in this area, I have tediously and painfully cataloged the occurrence and resolutions of major continuation and reversal patterns for the top 100 cryptocurrencies! Individual statistics are provided for both fiat (USD) and Bitcoin traded pairs!
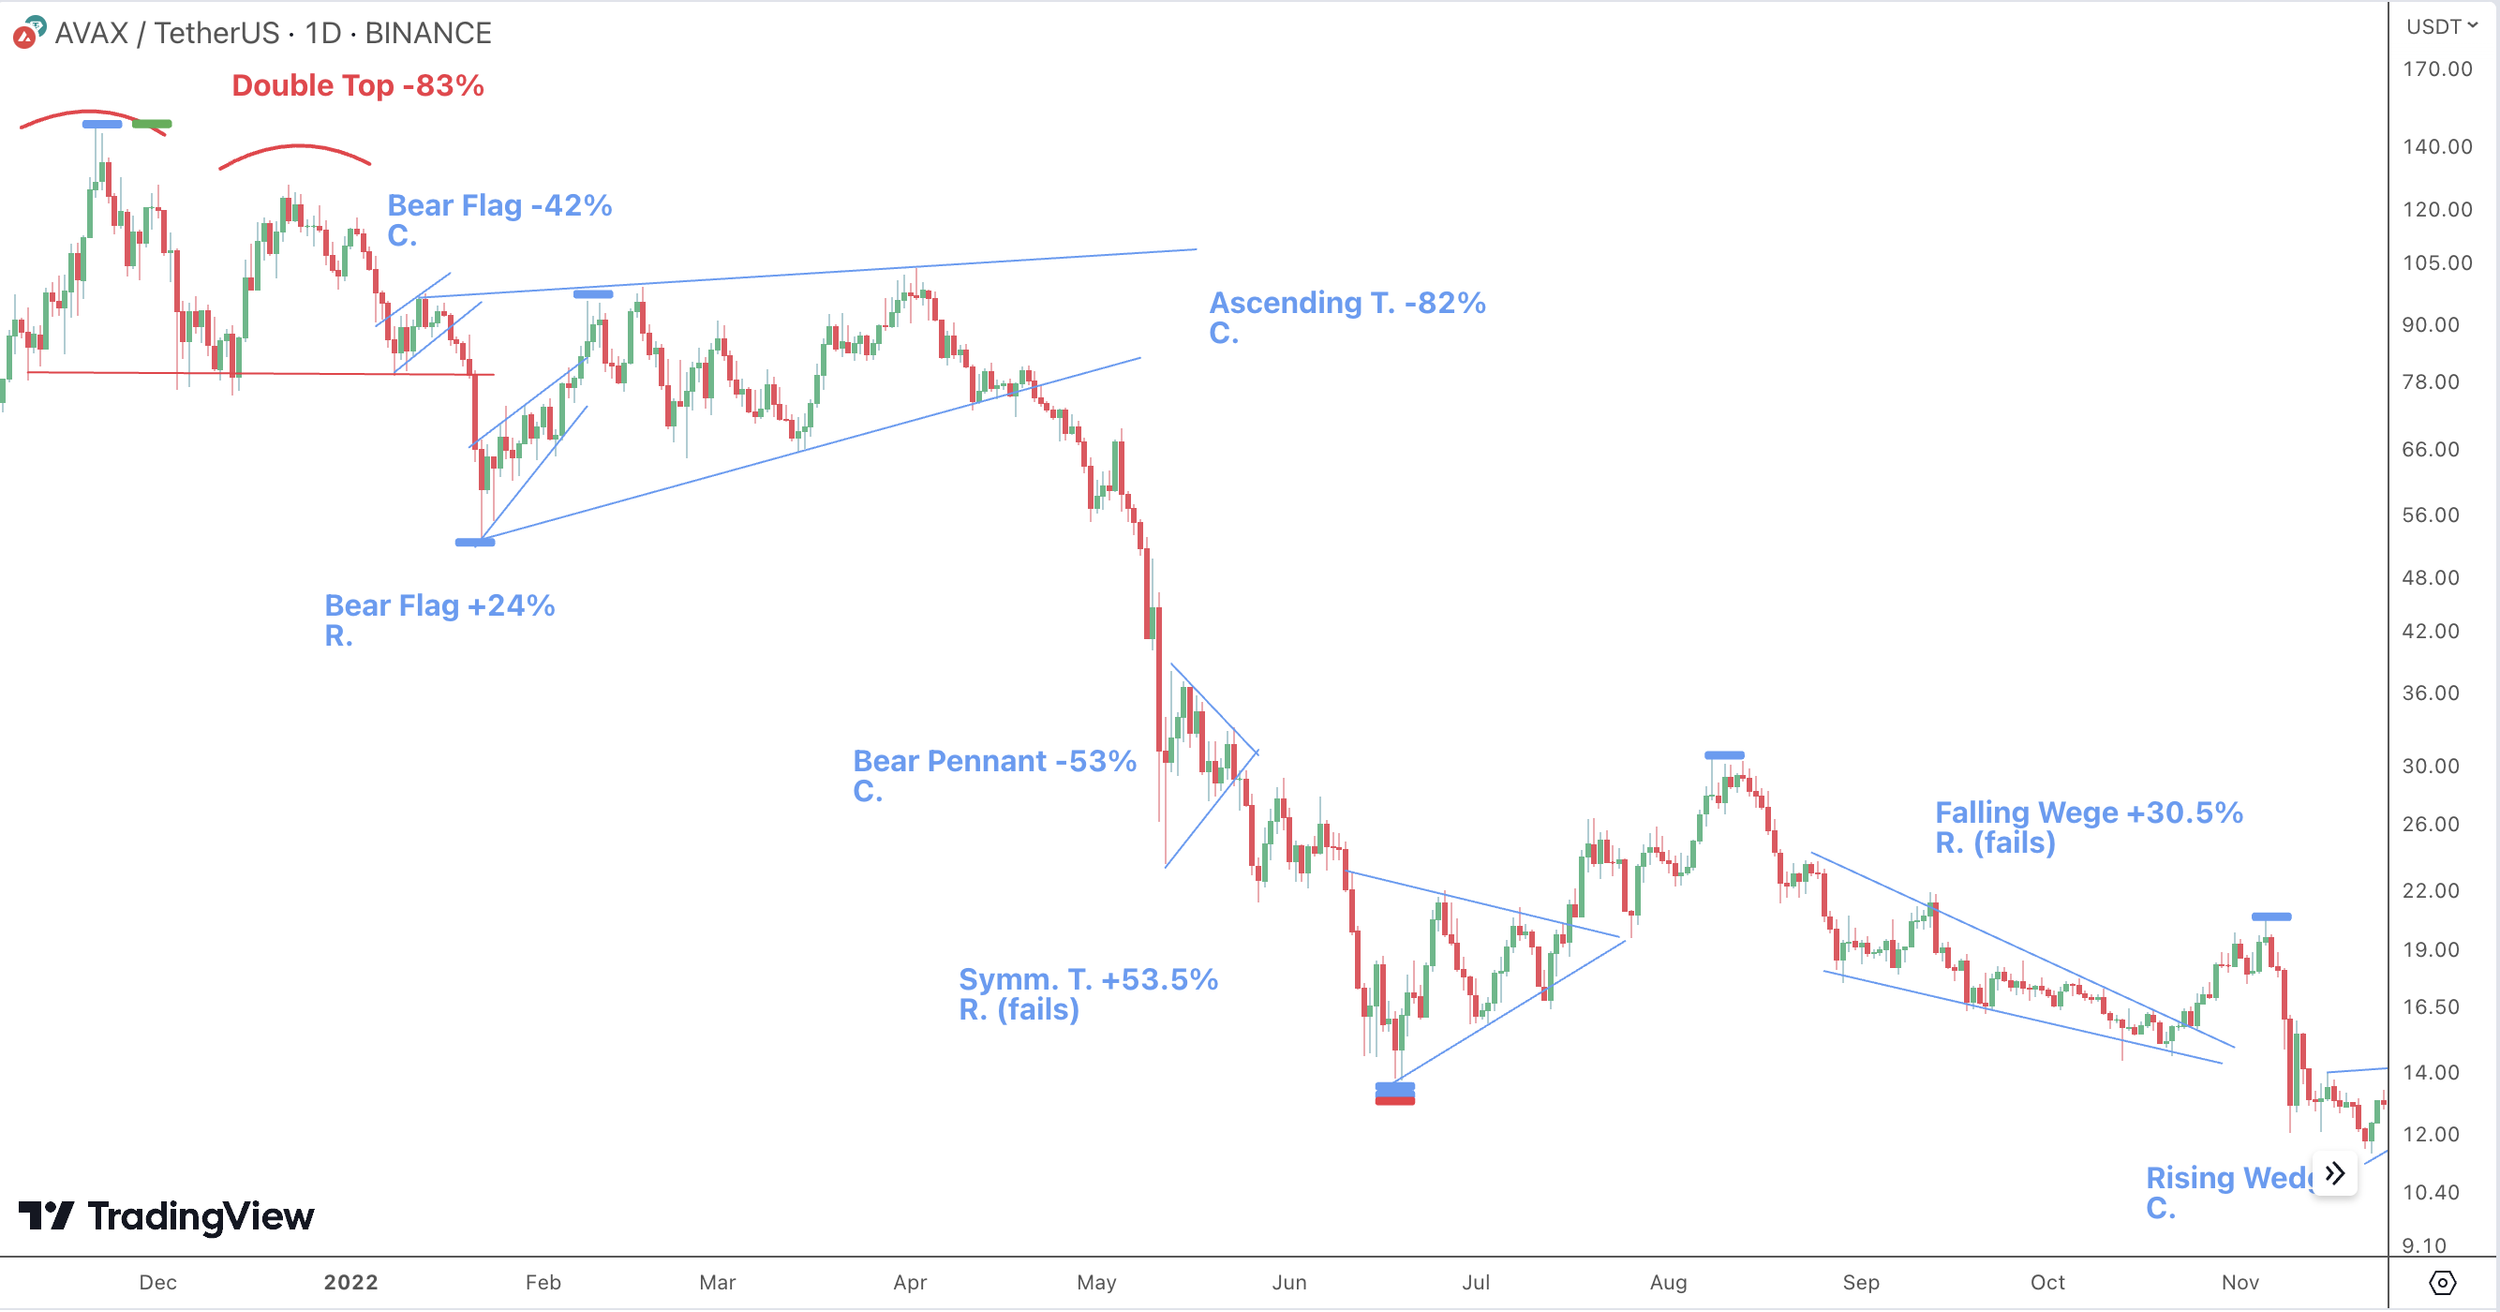
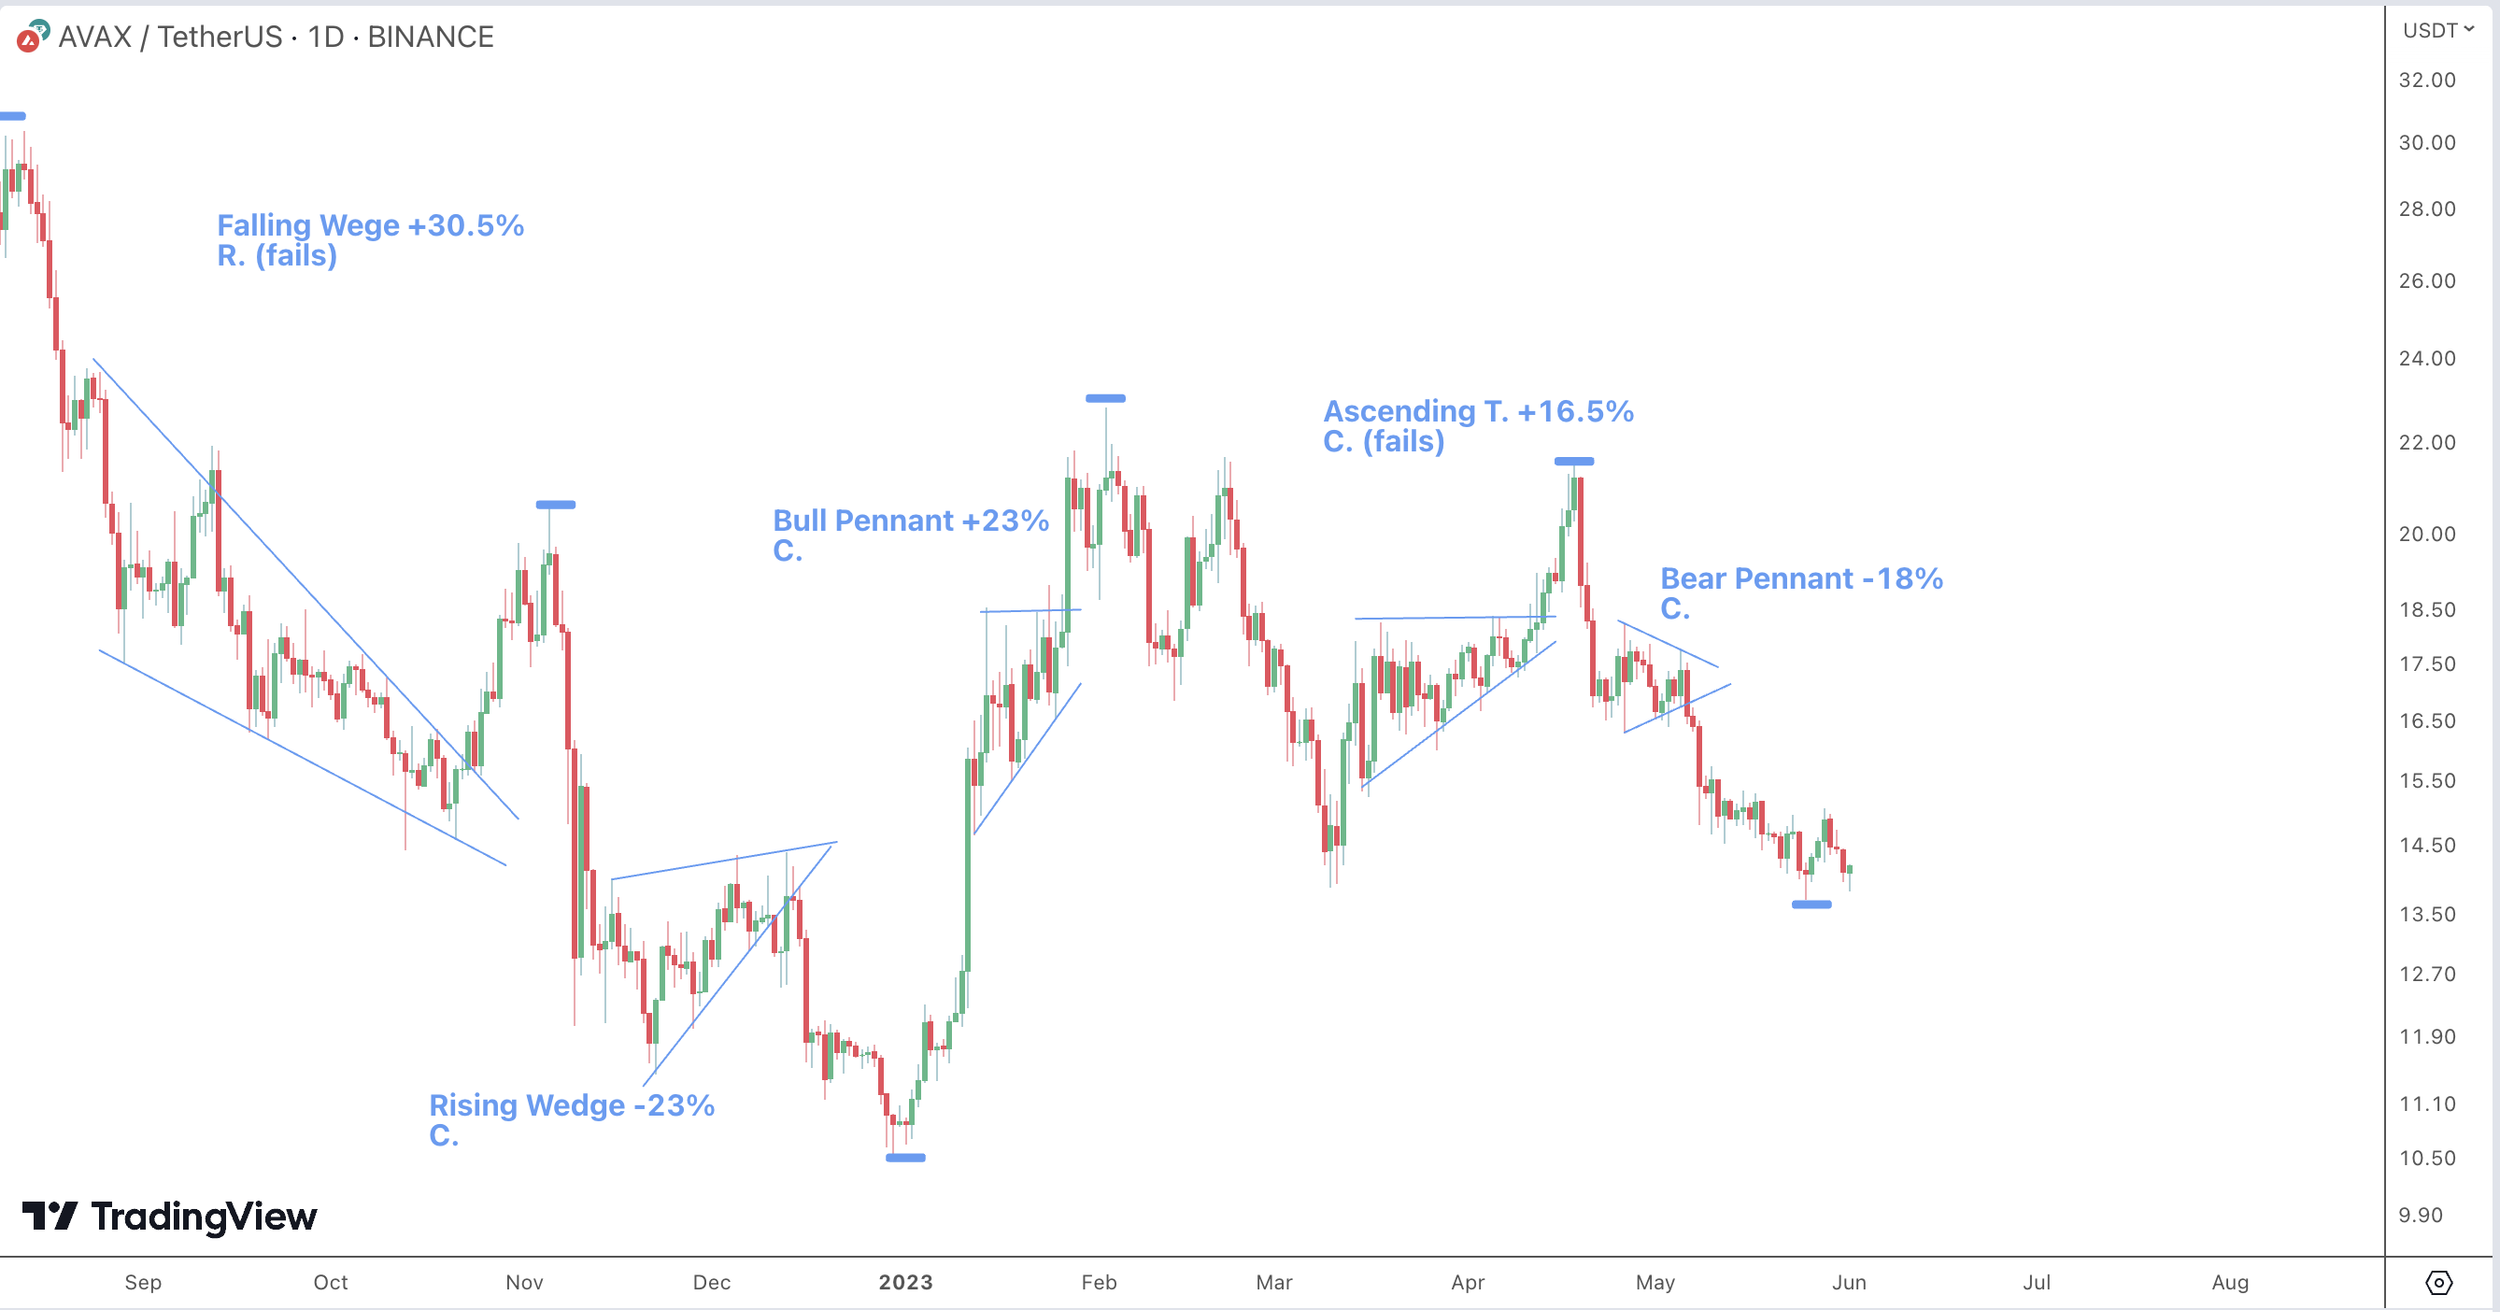
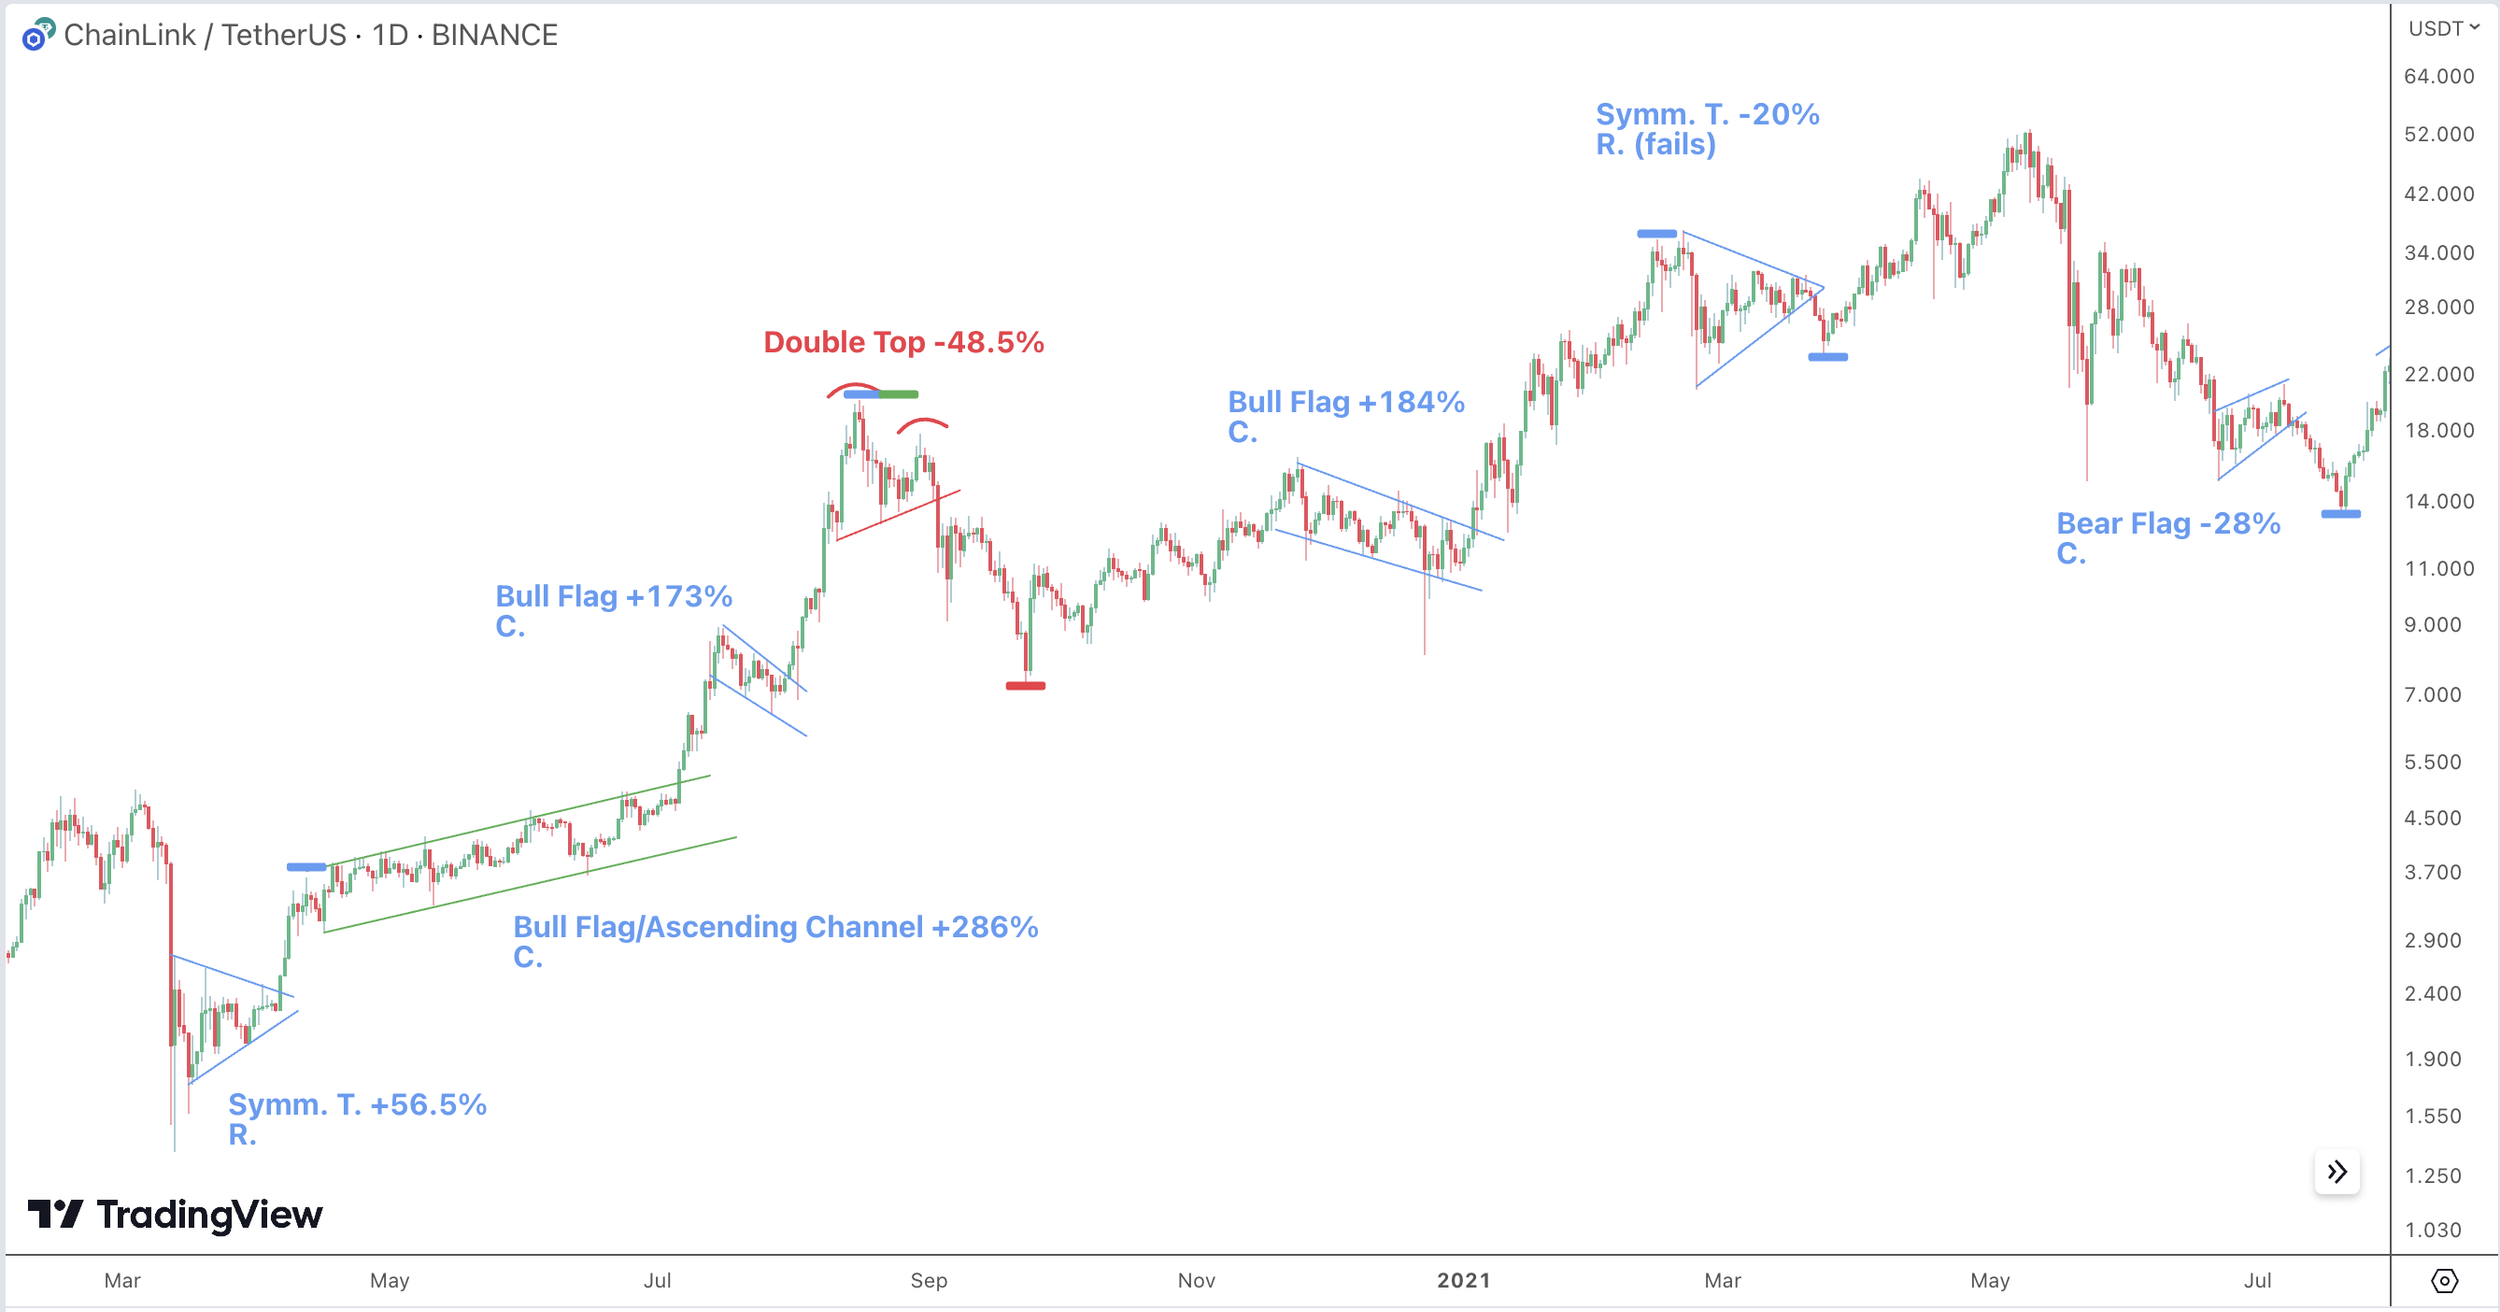
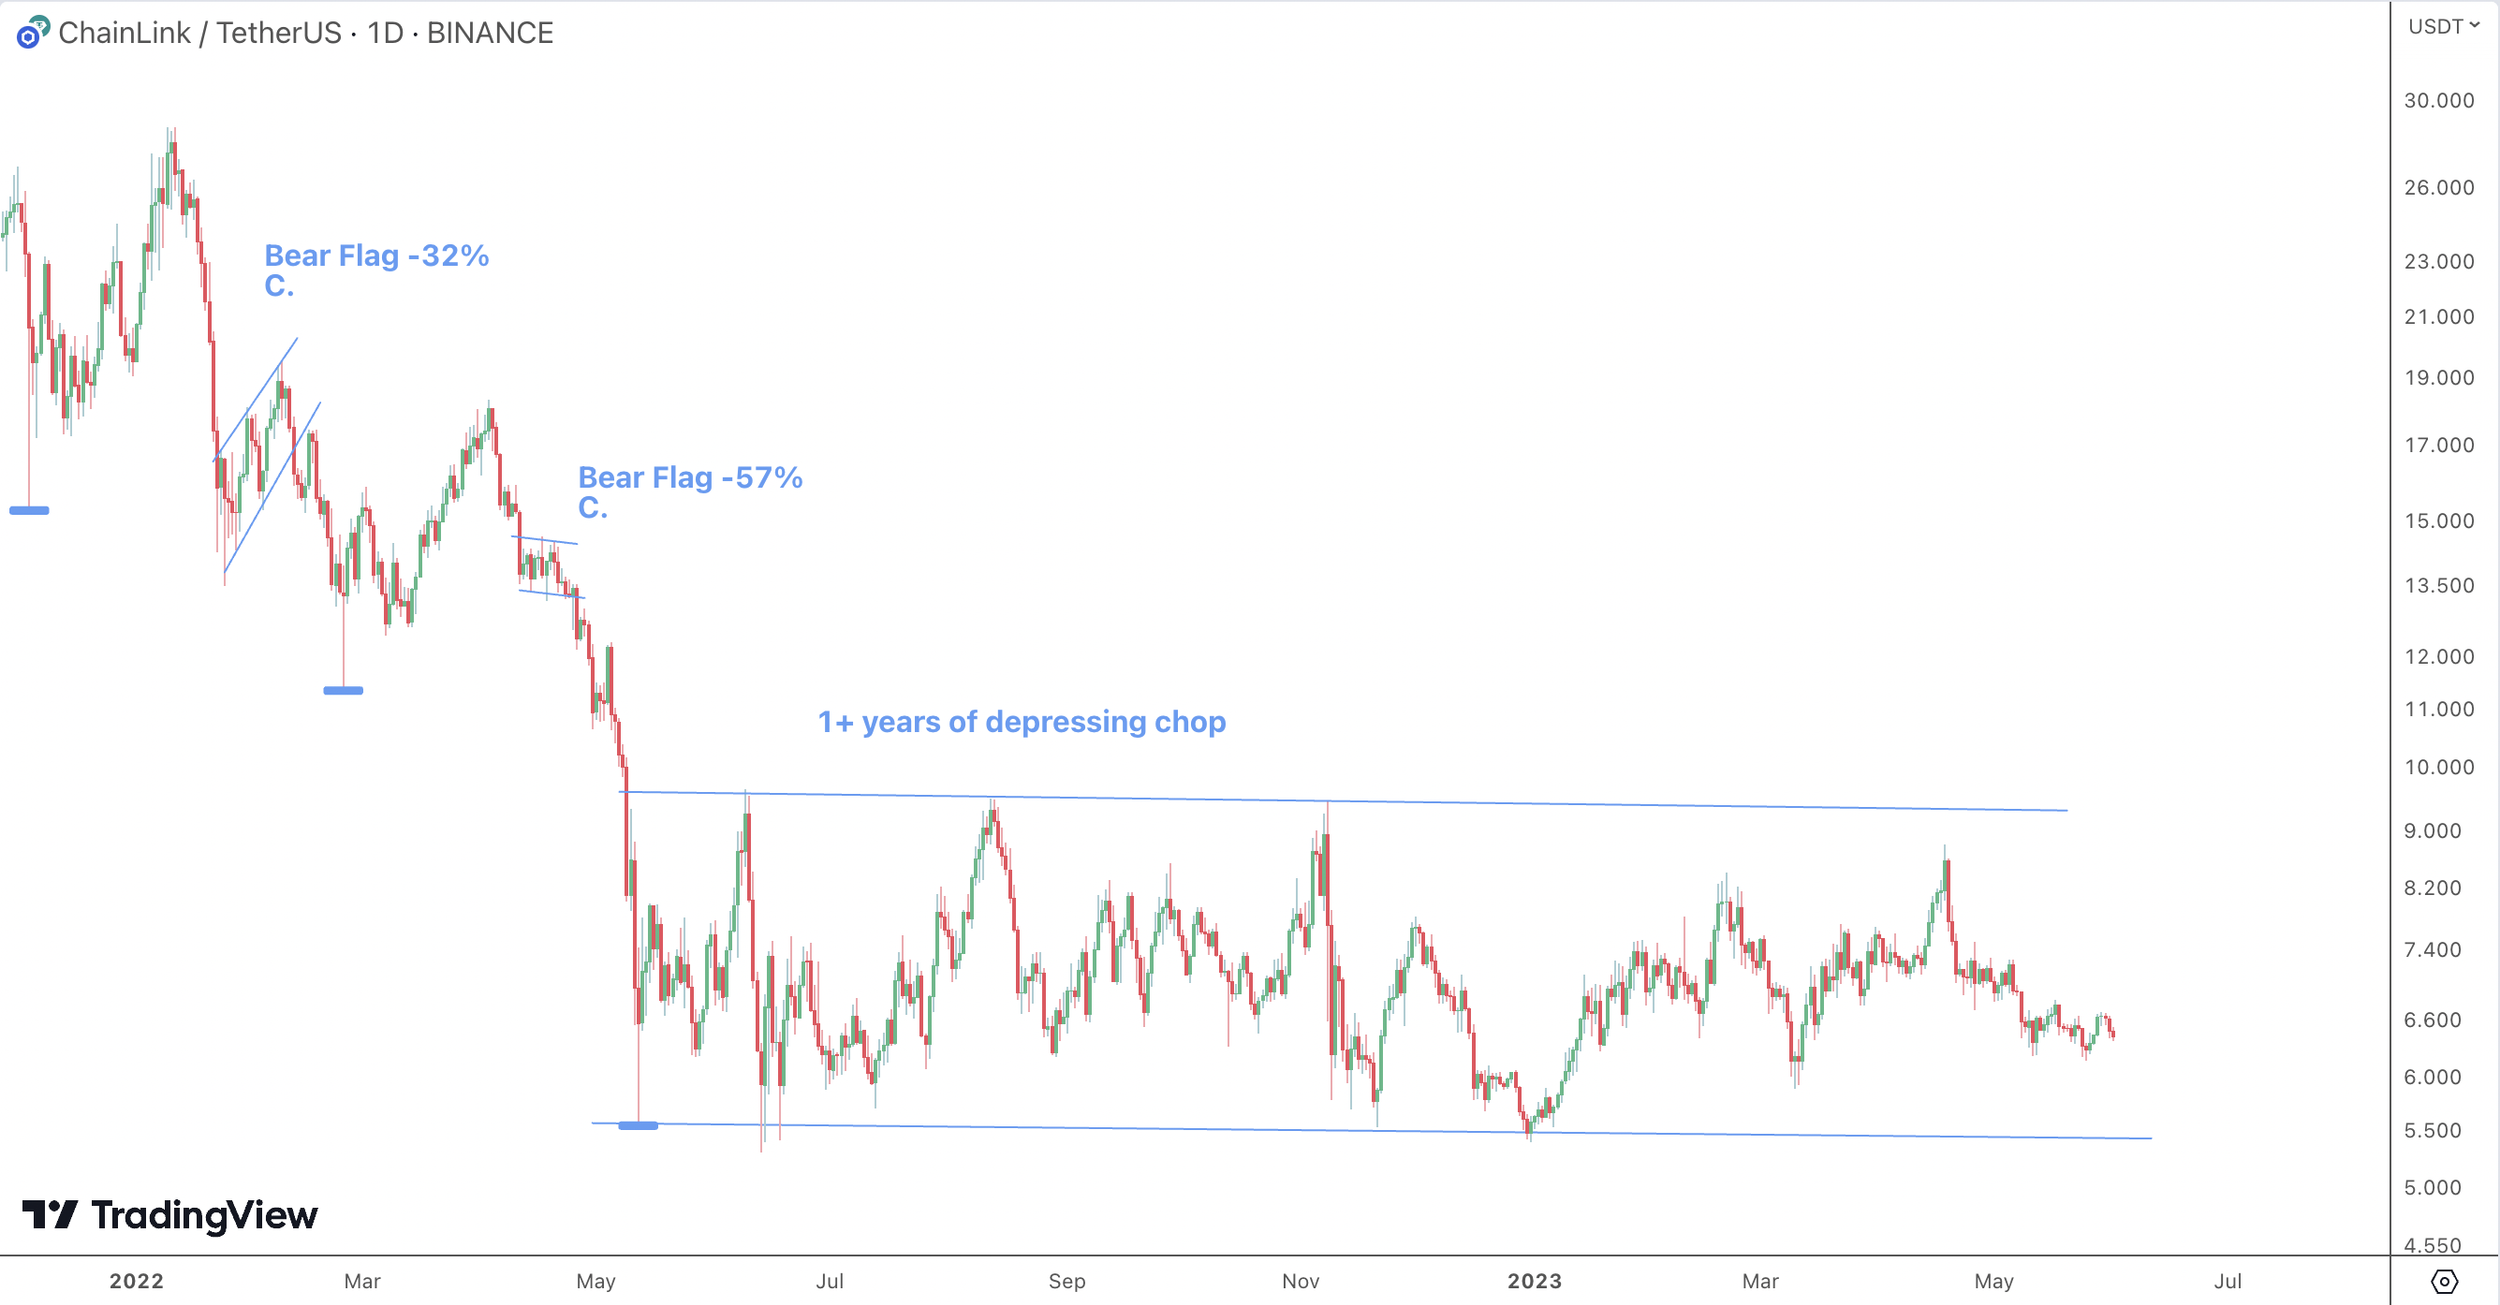
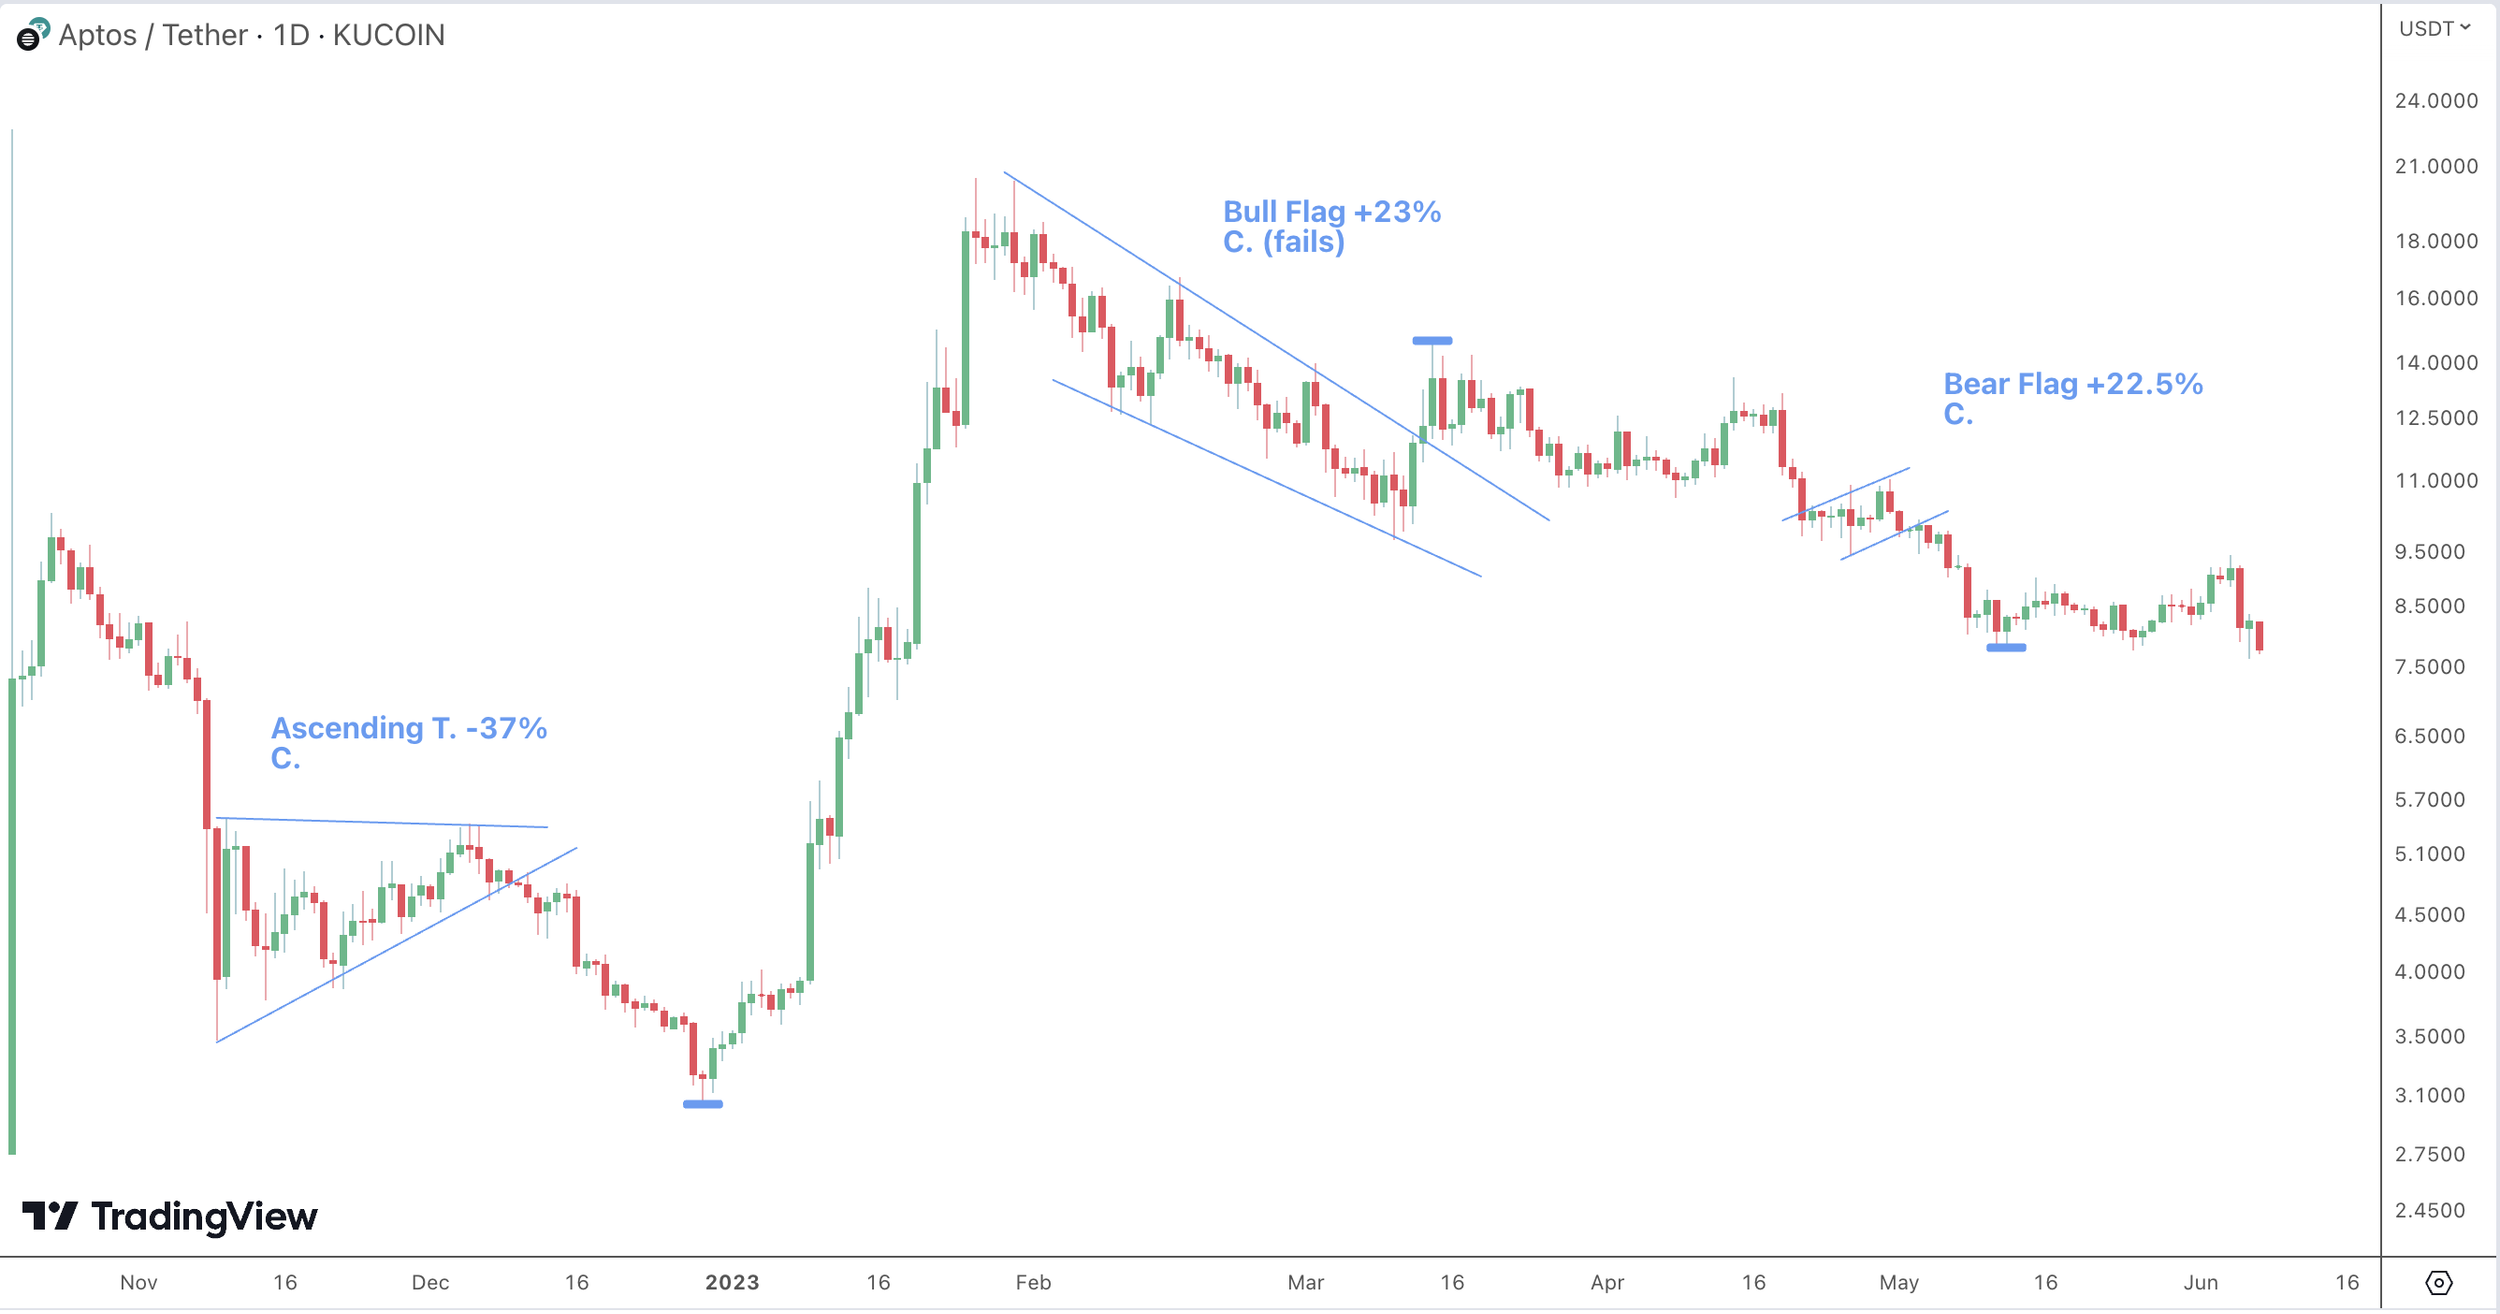
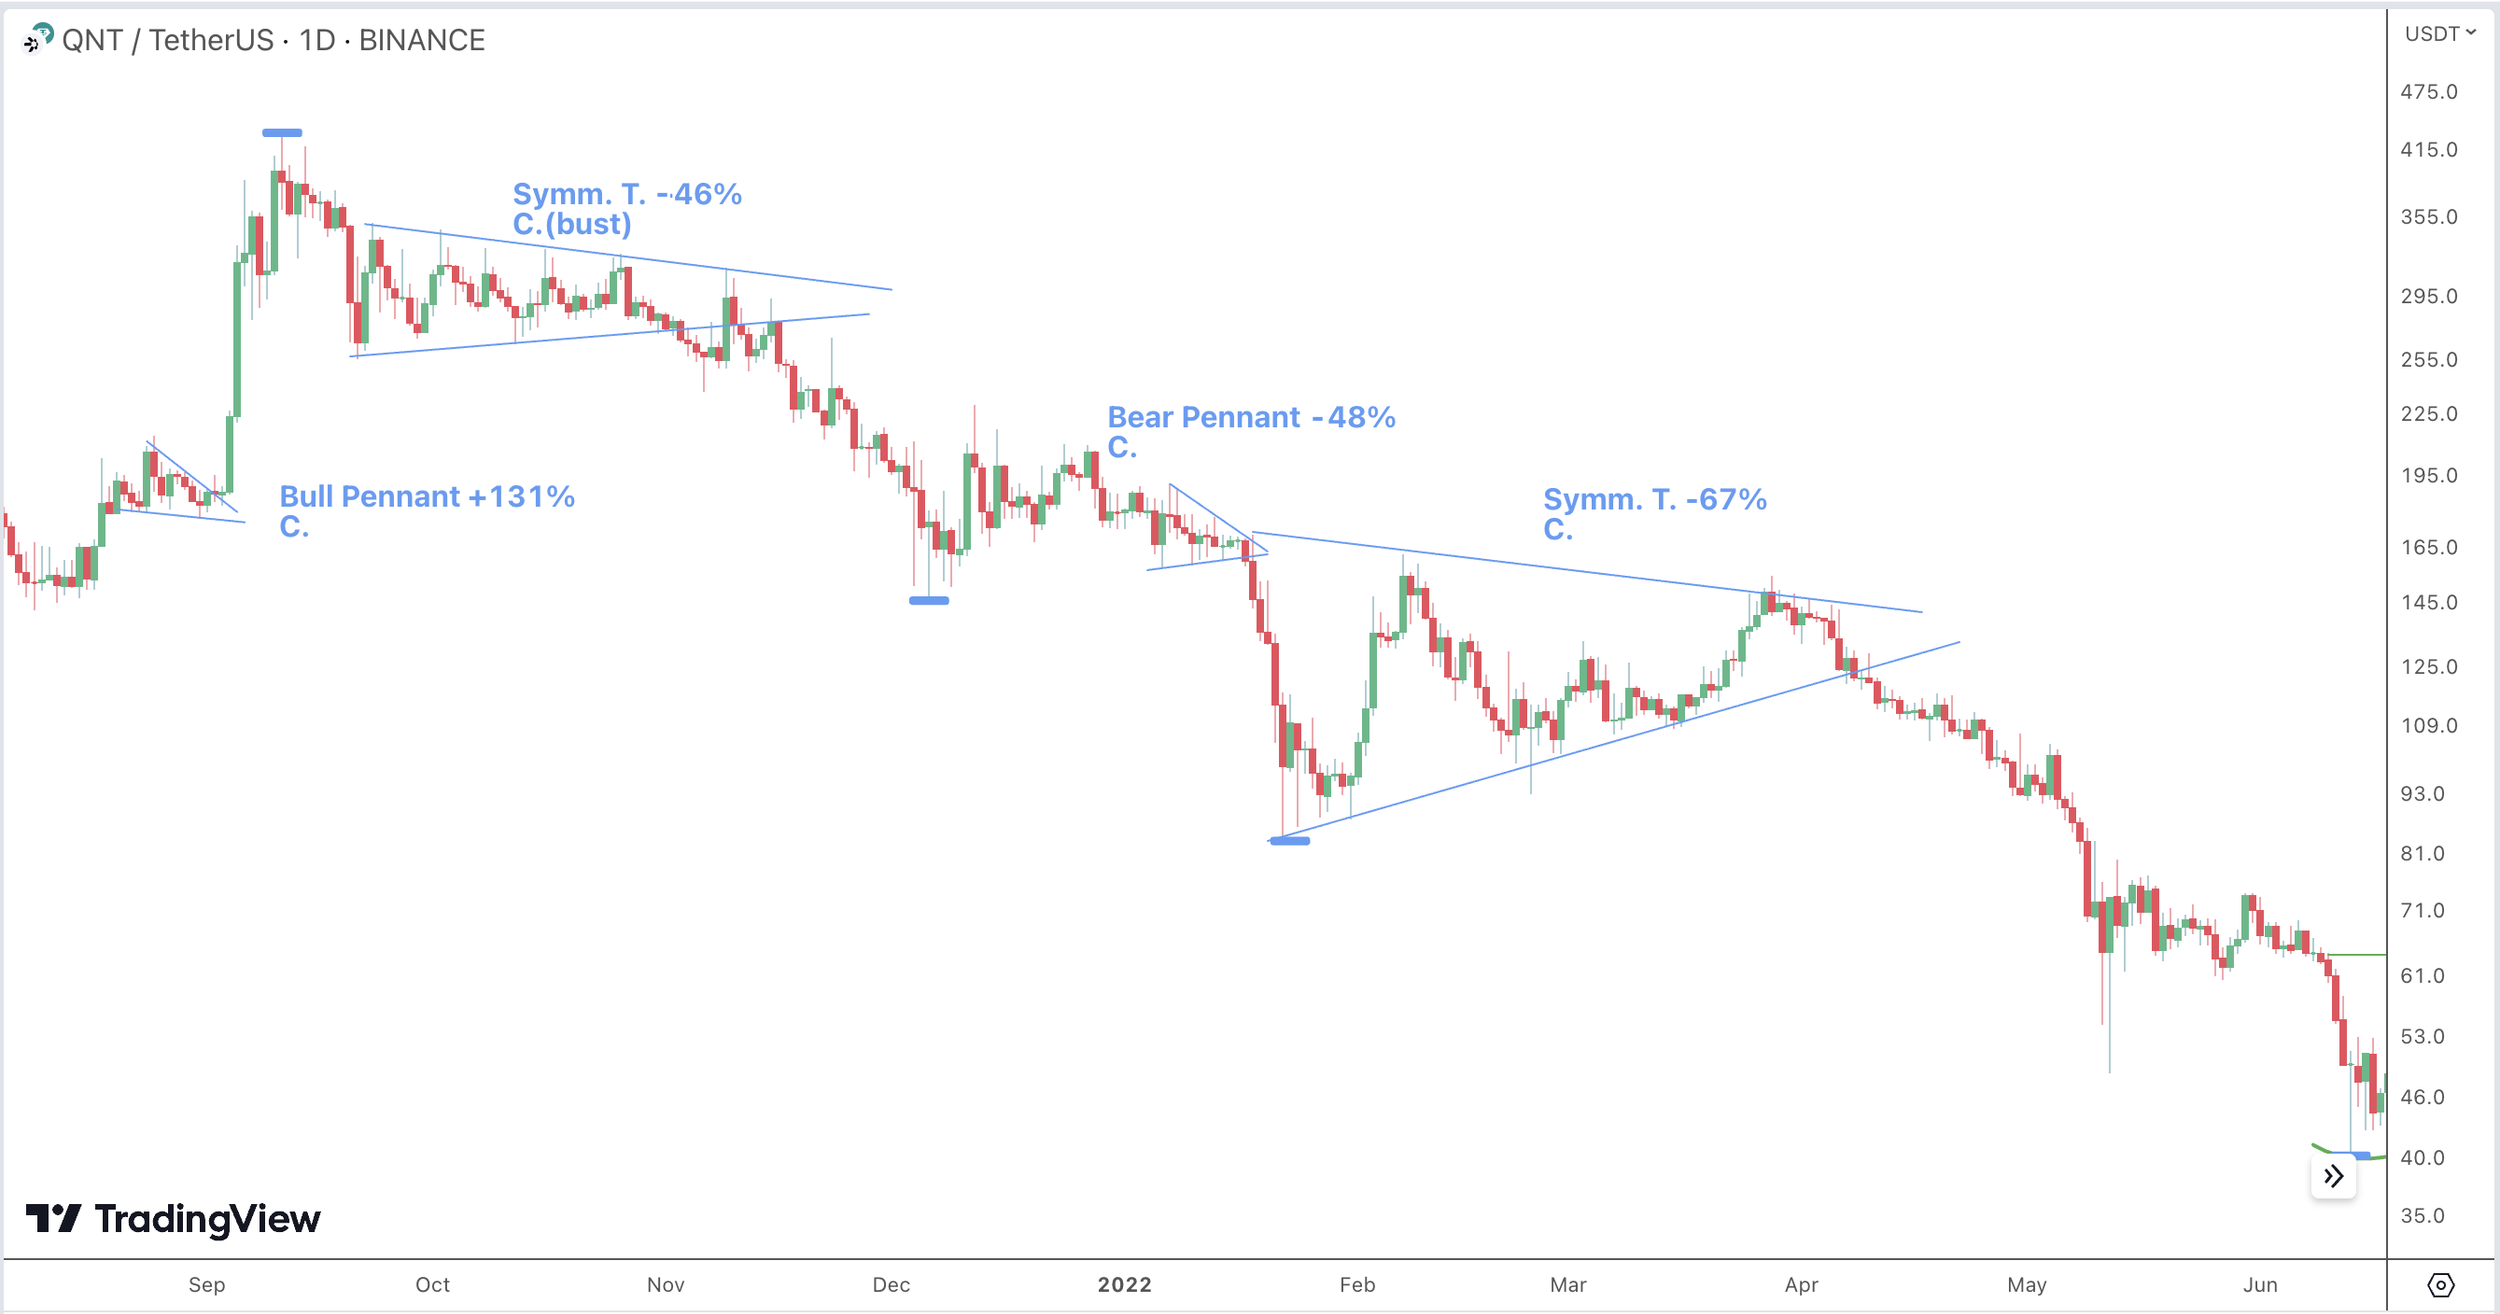
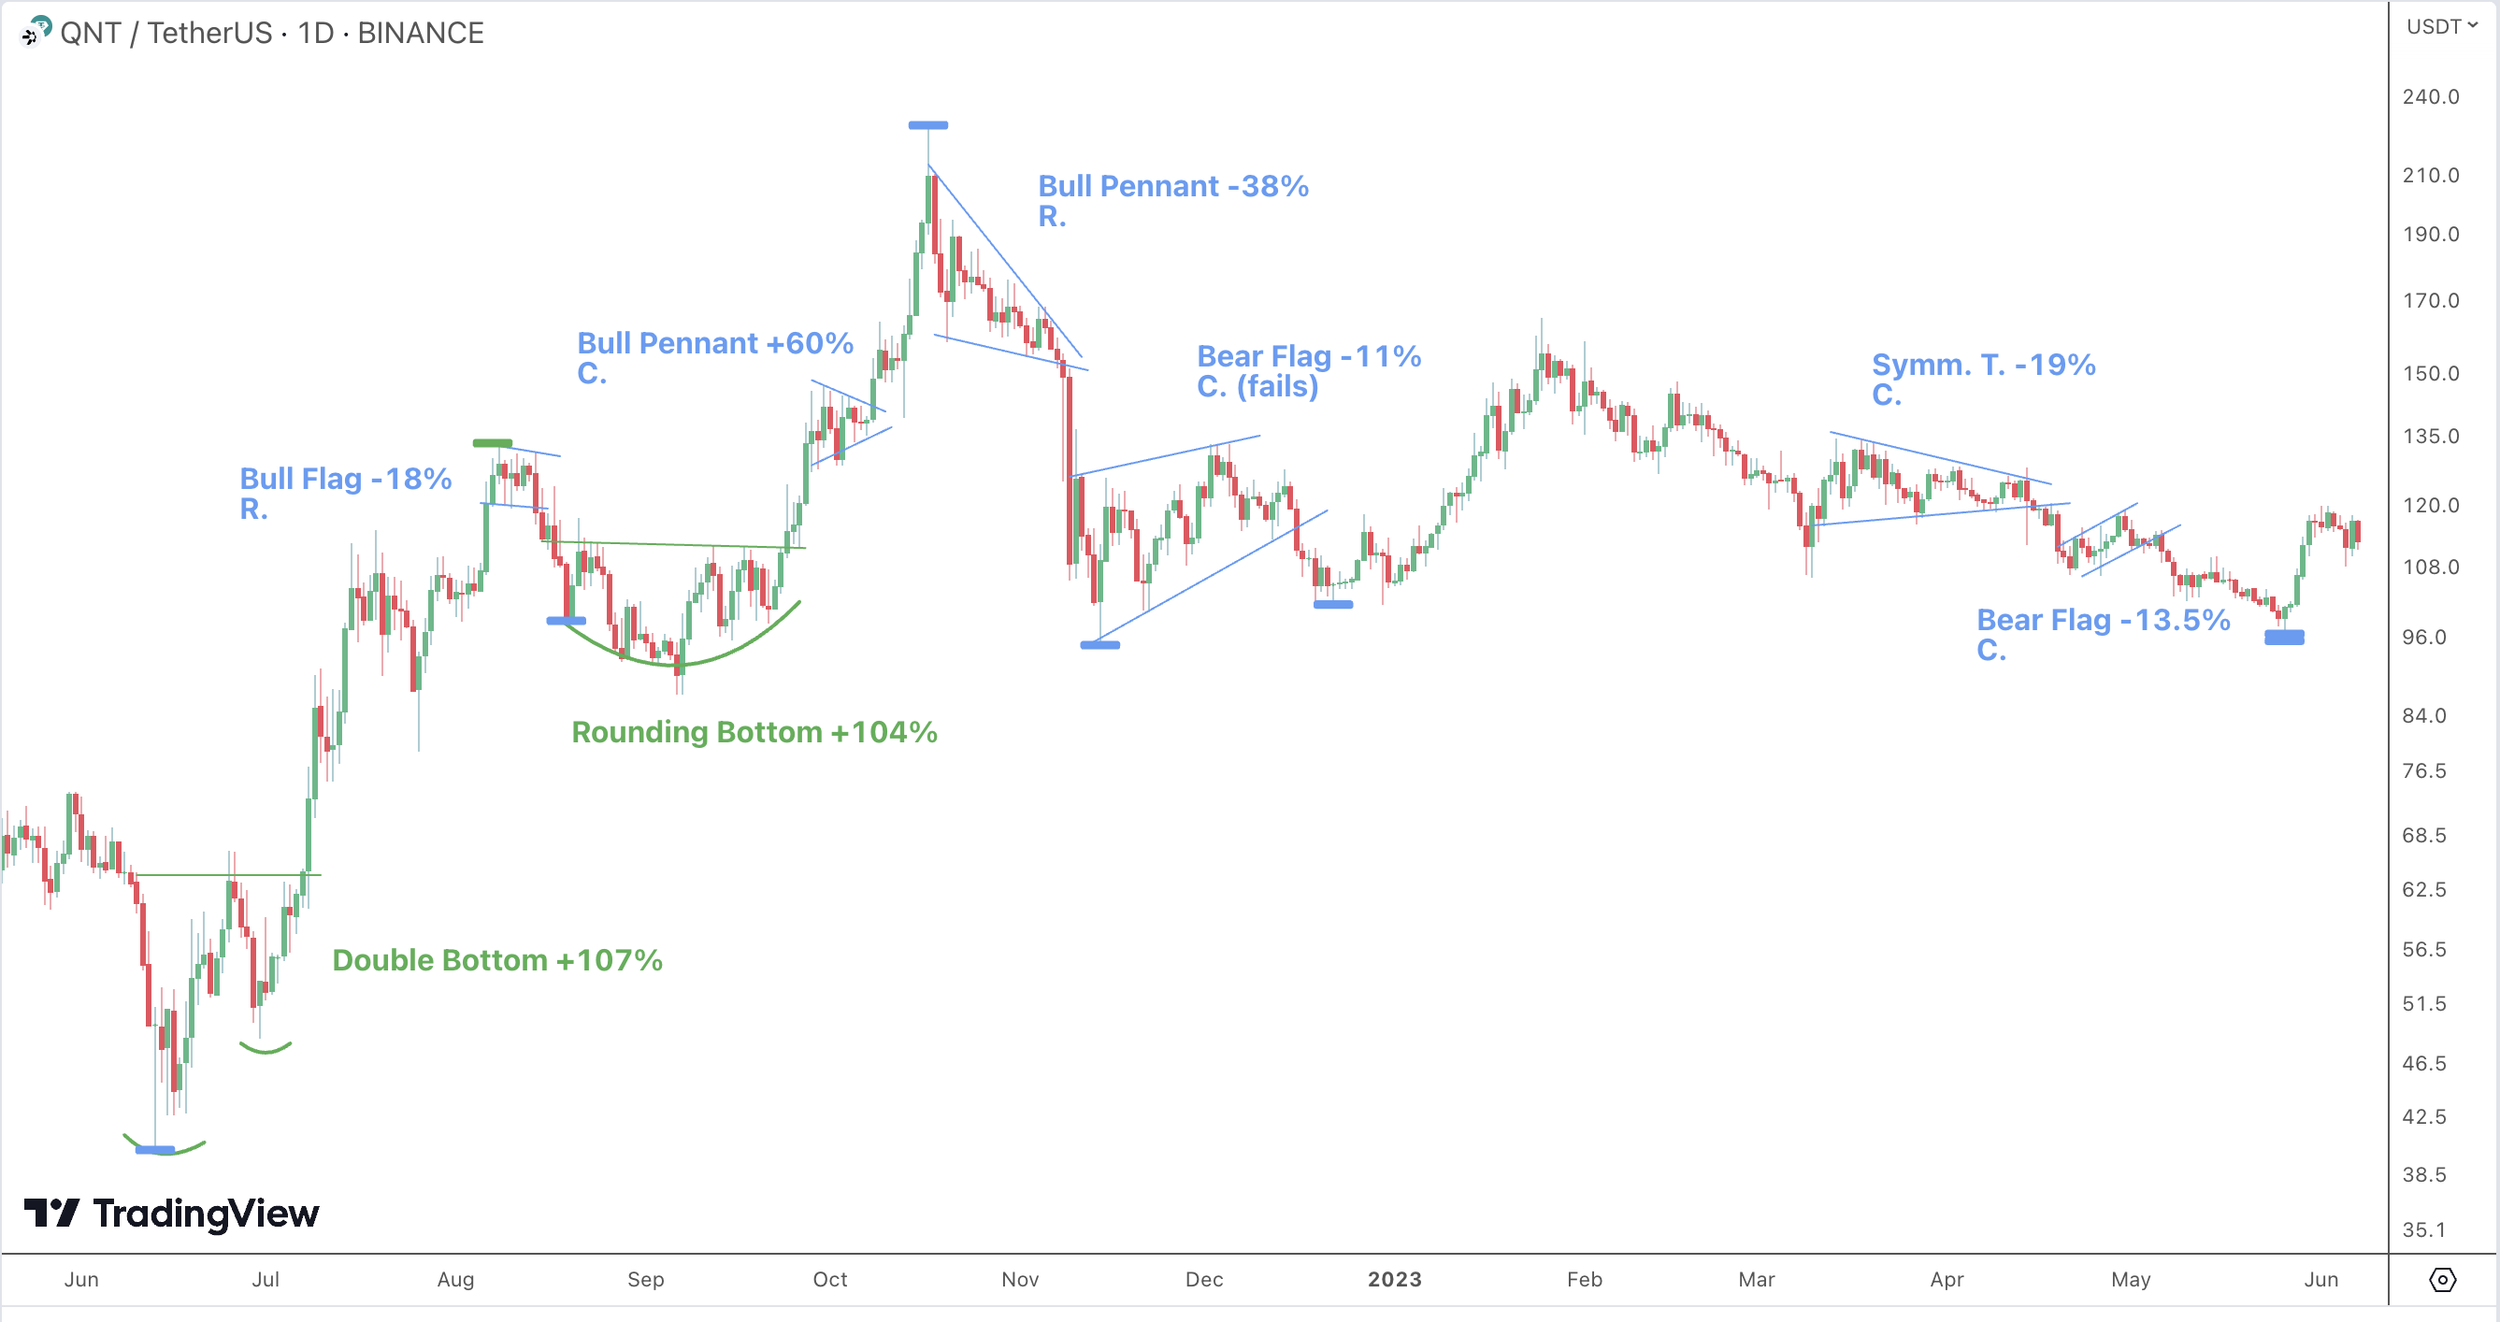
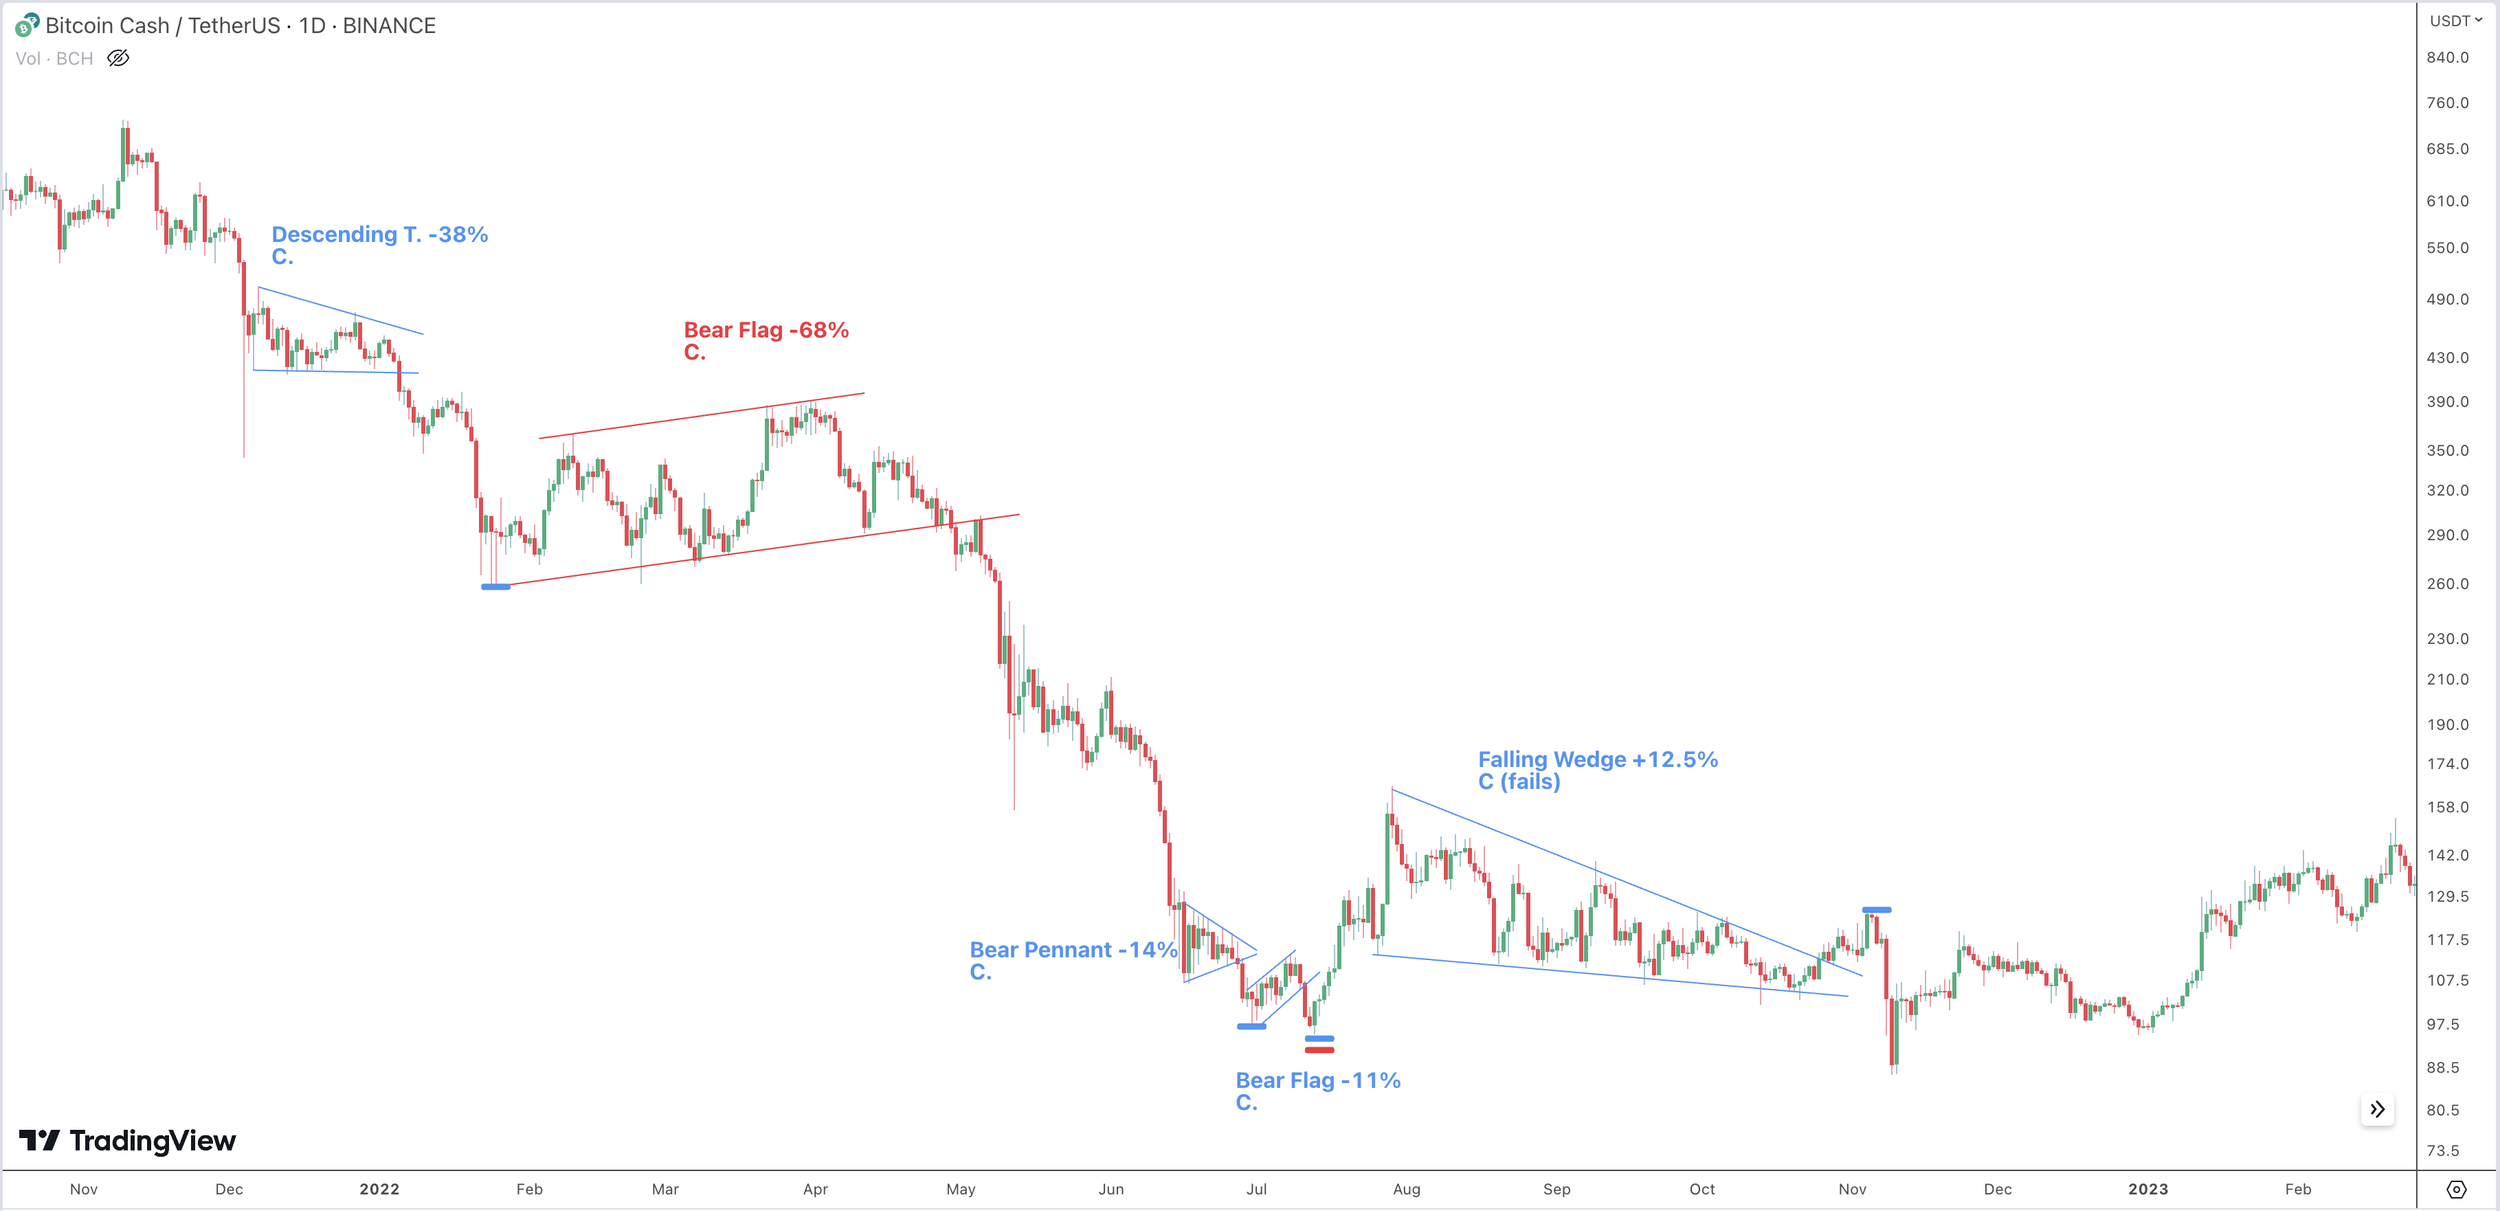
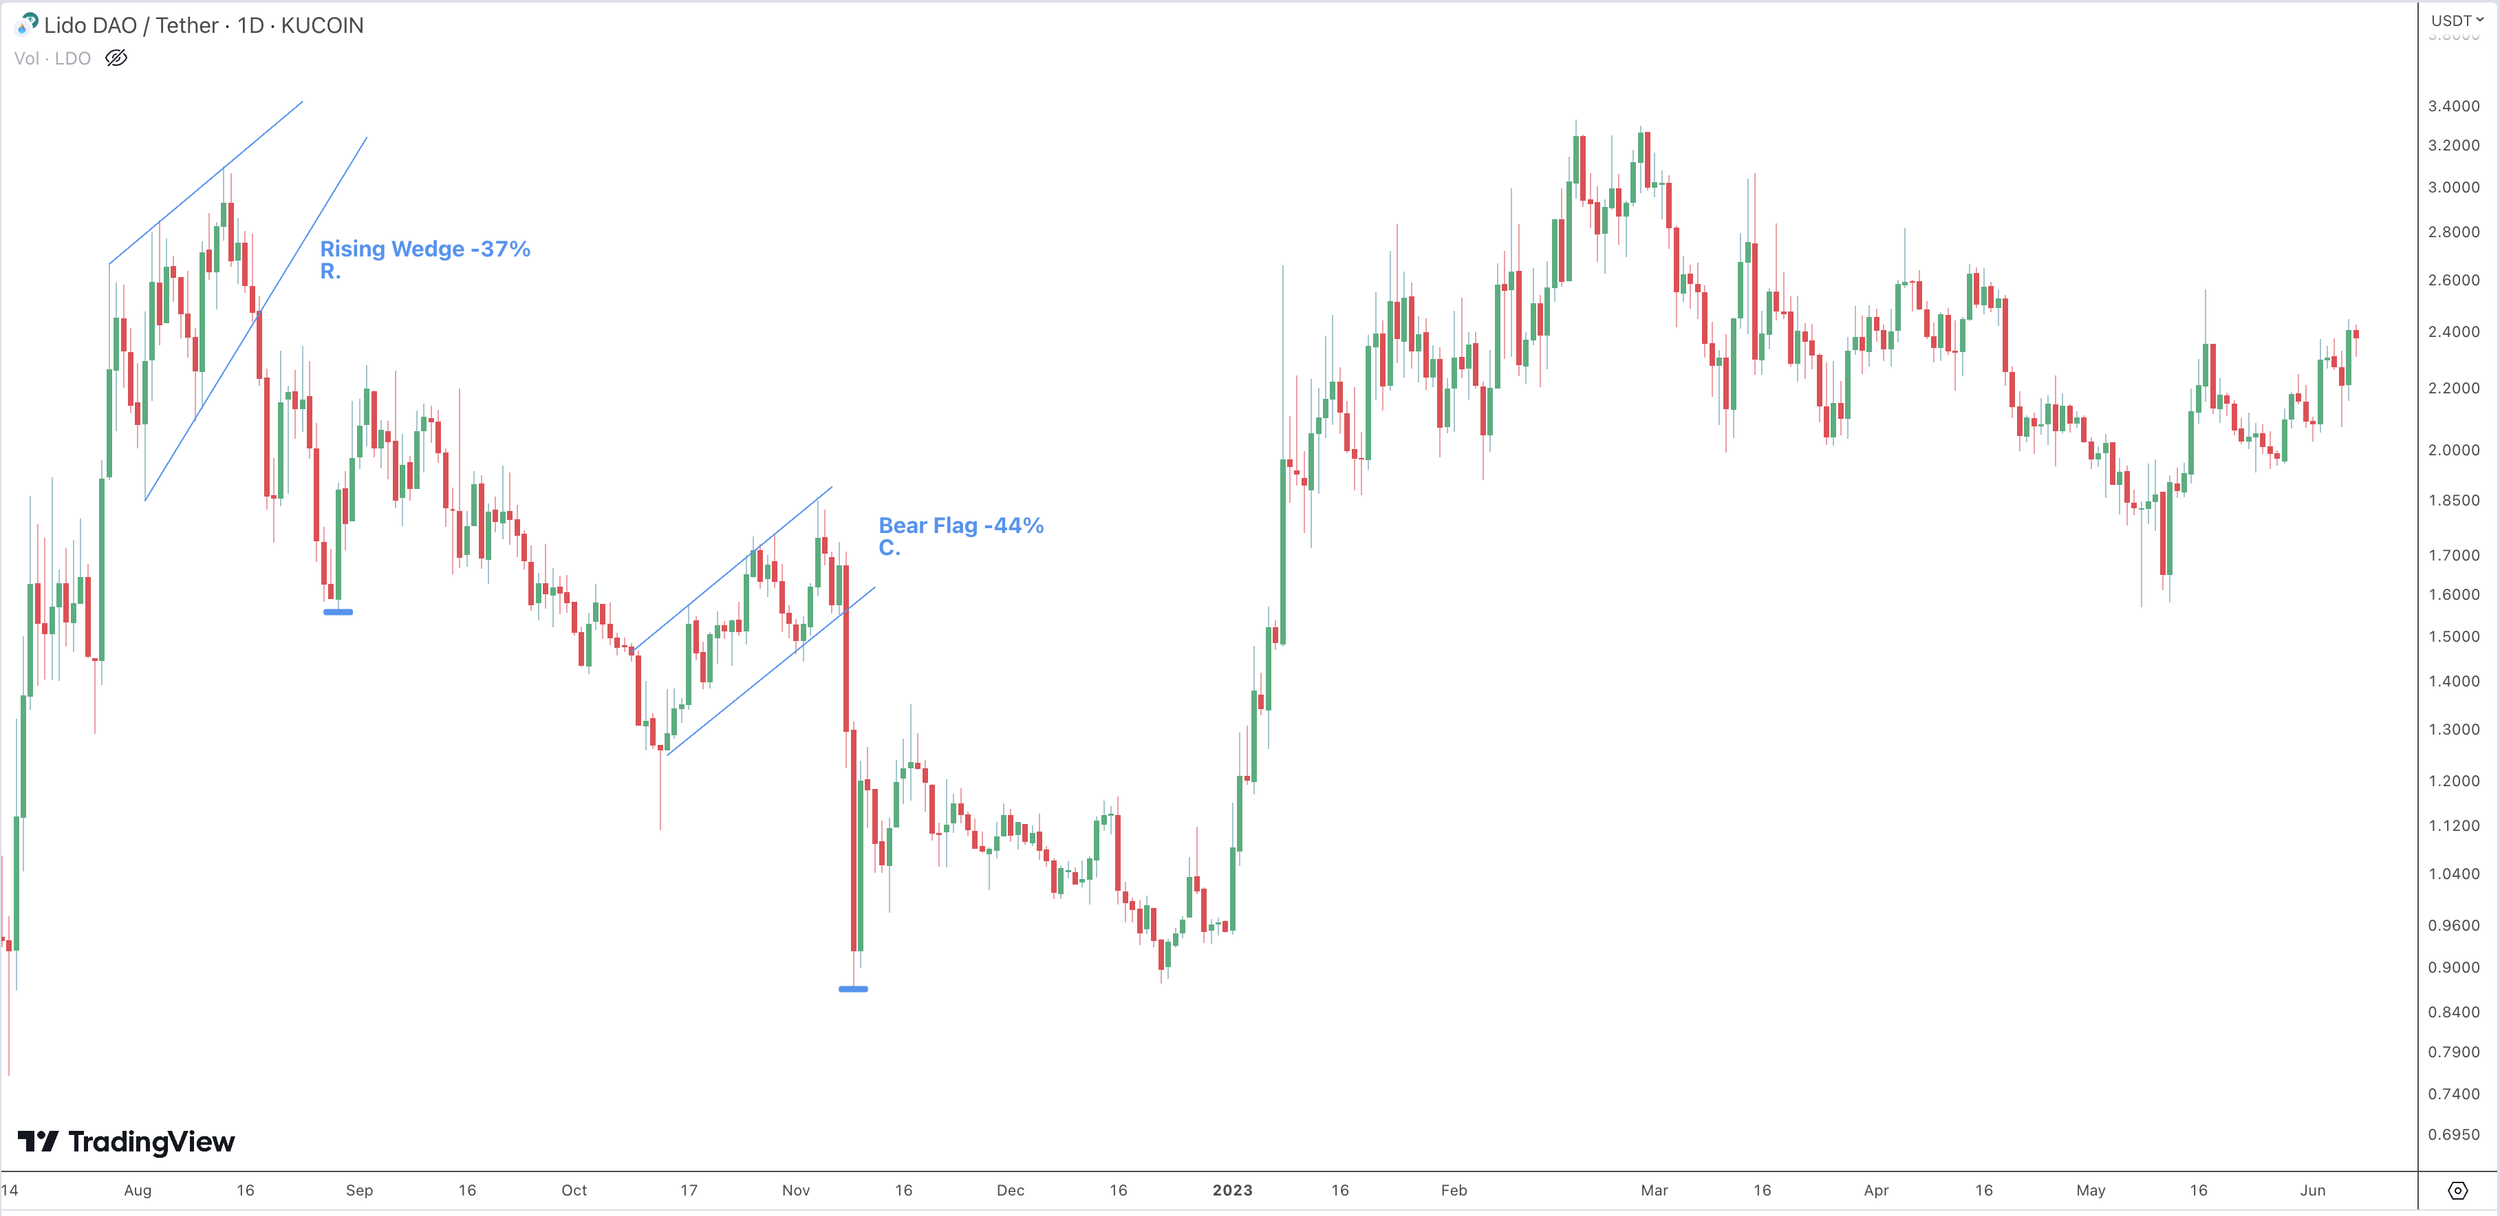
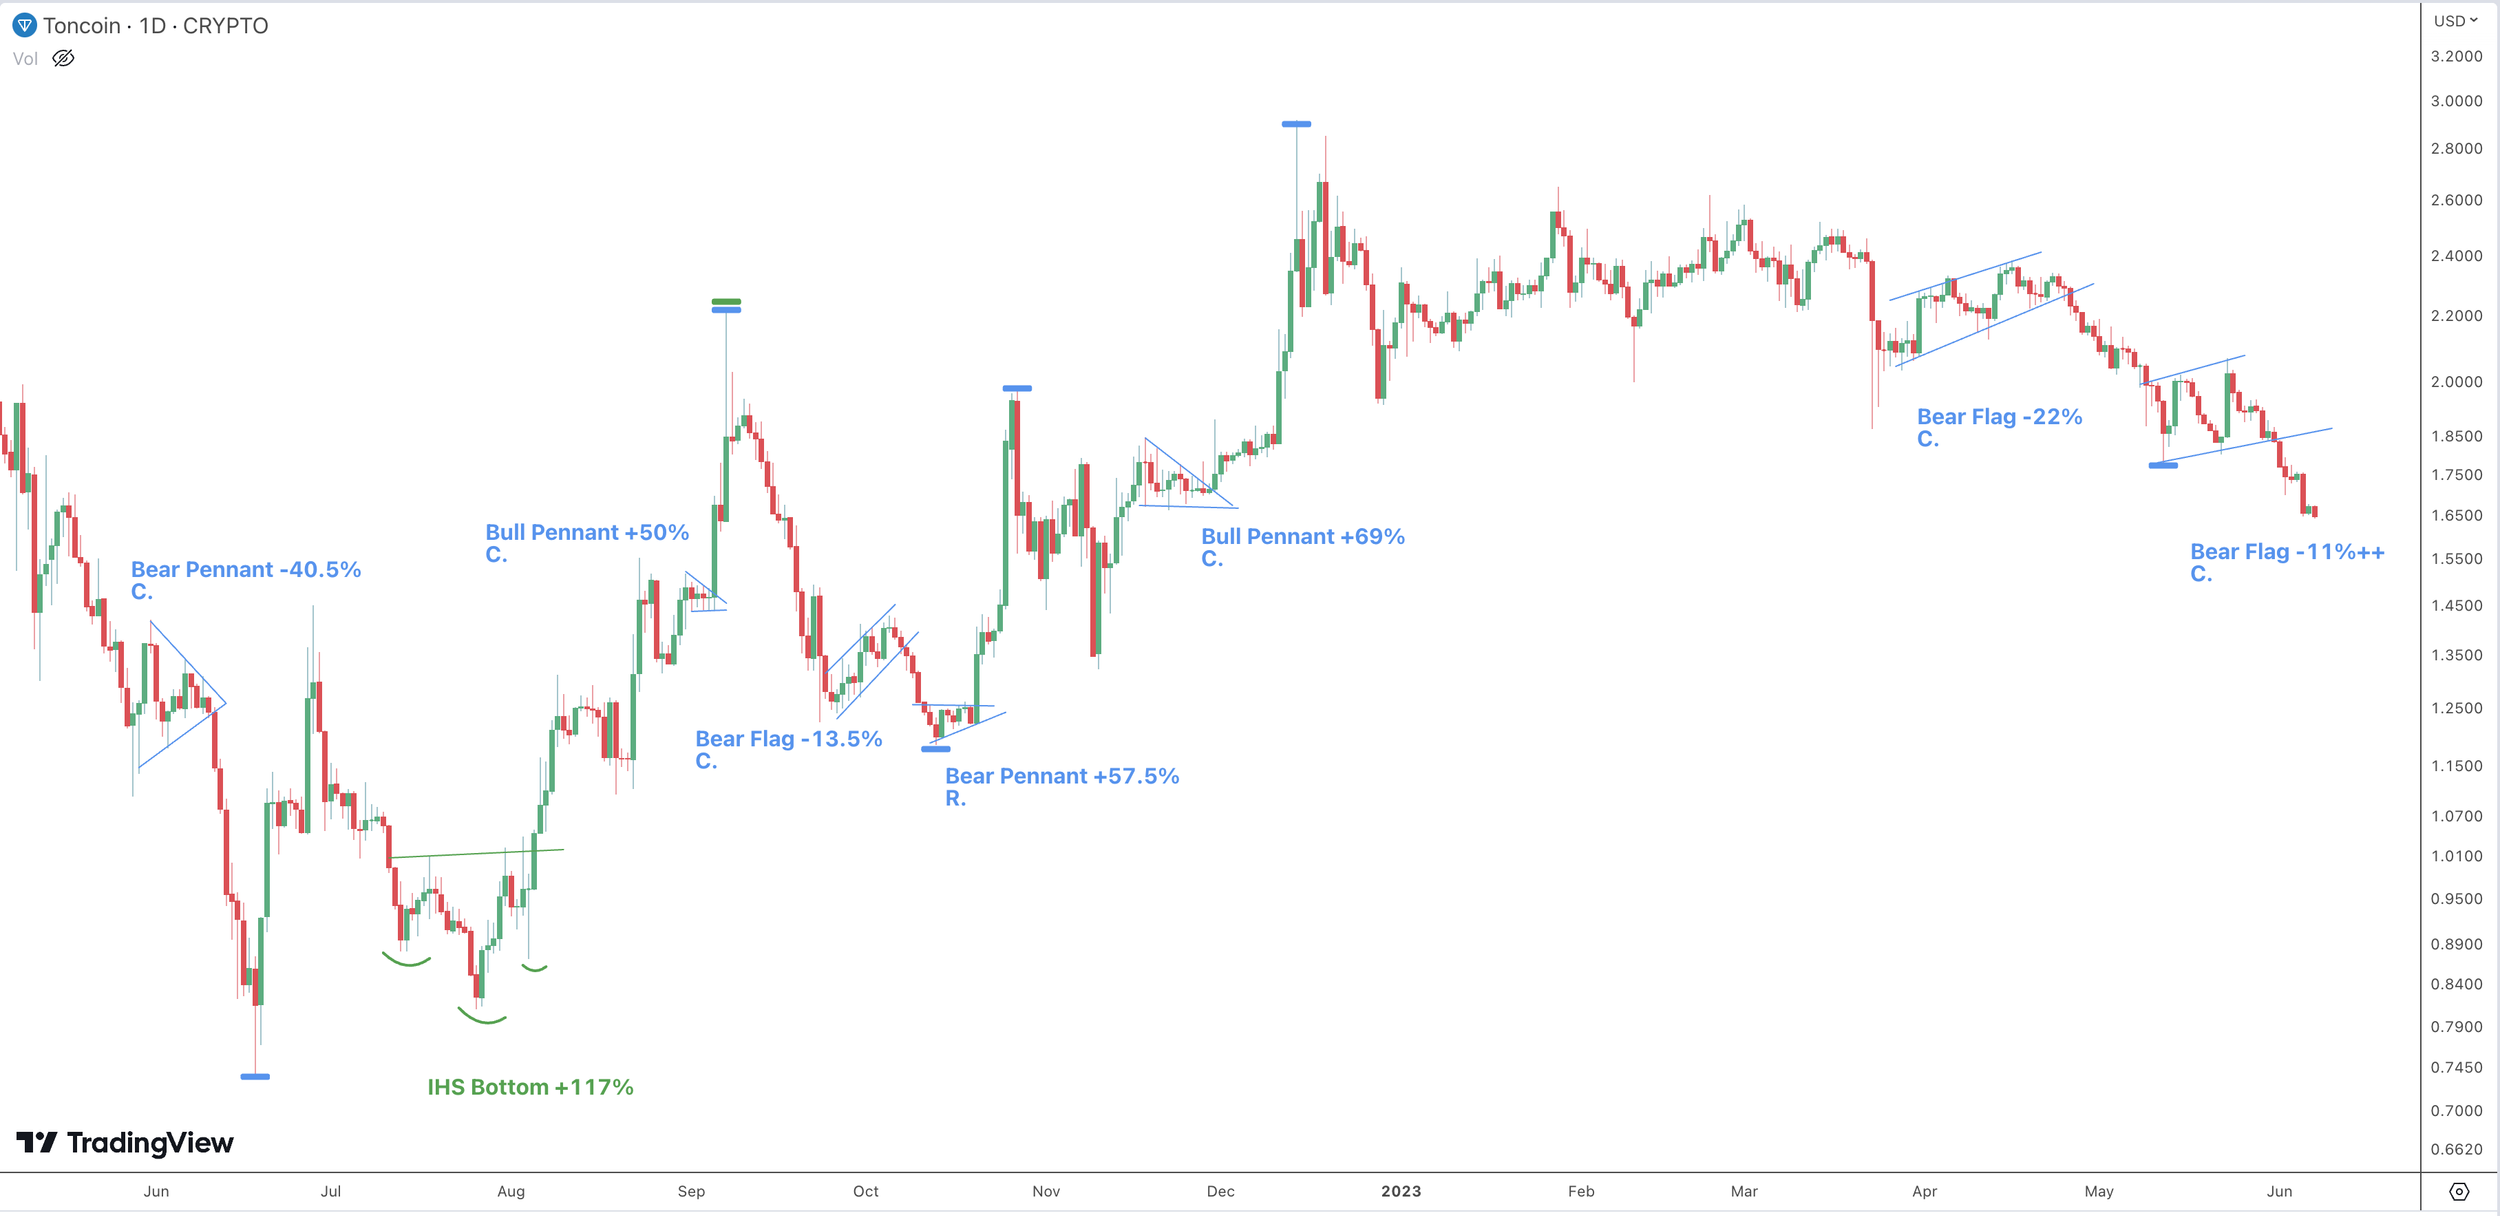
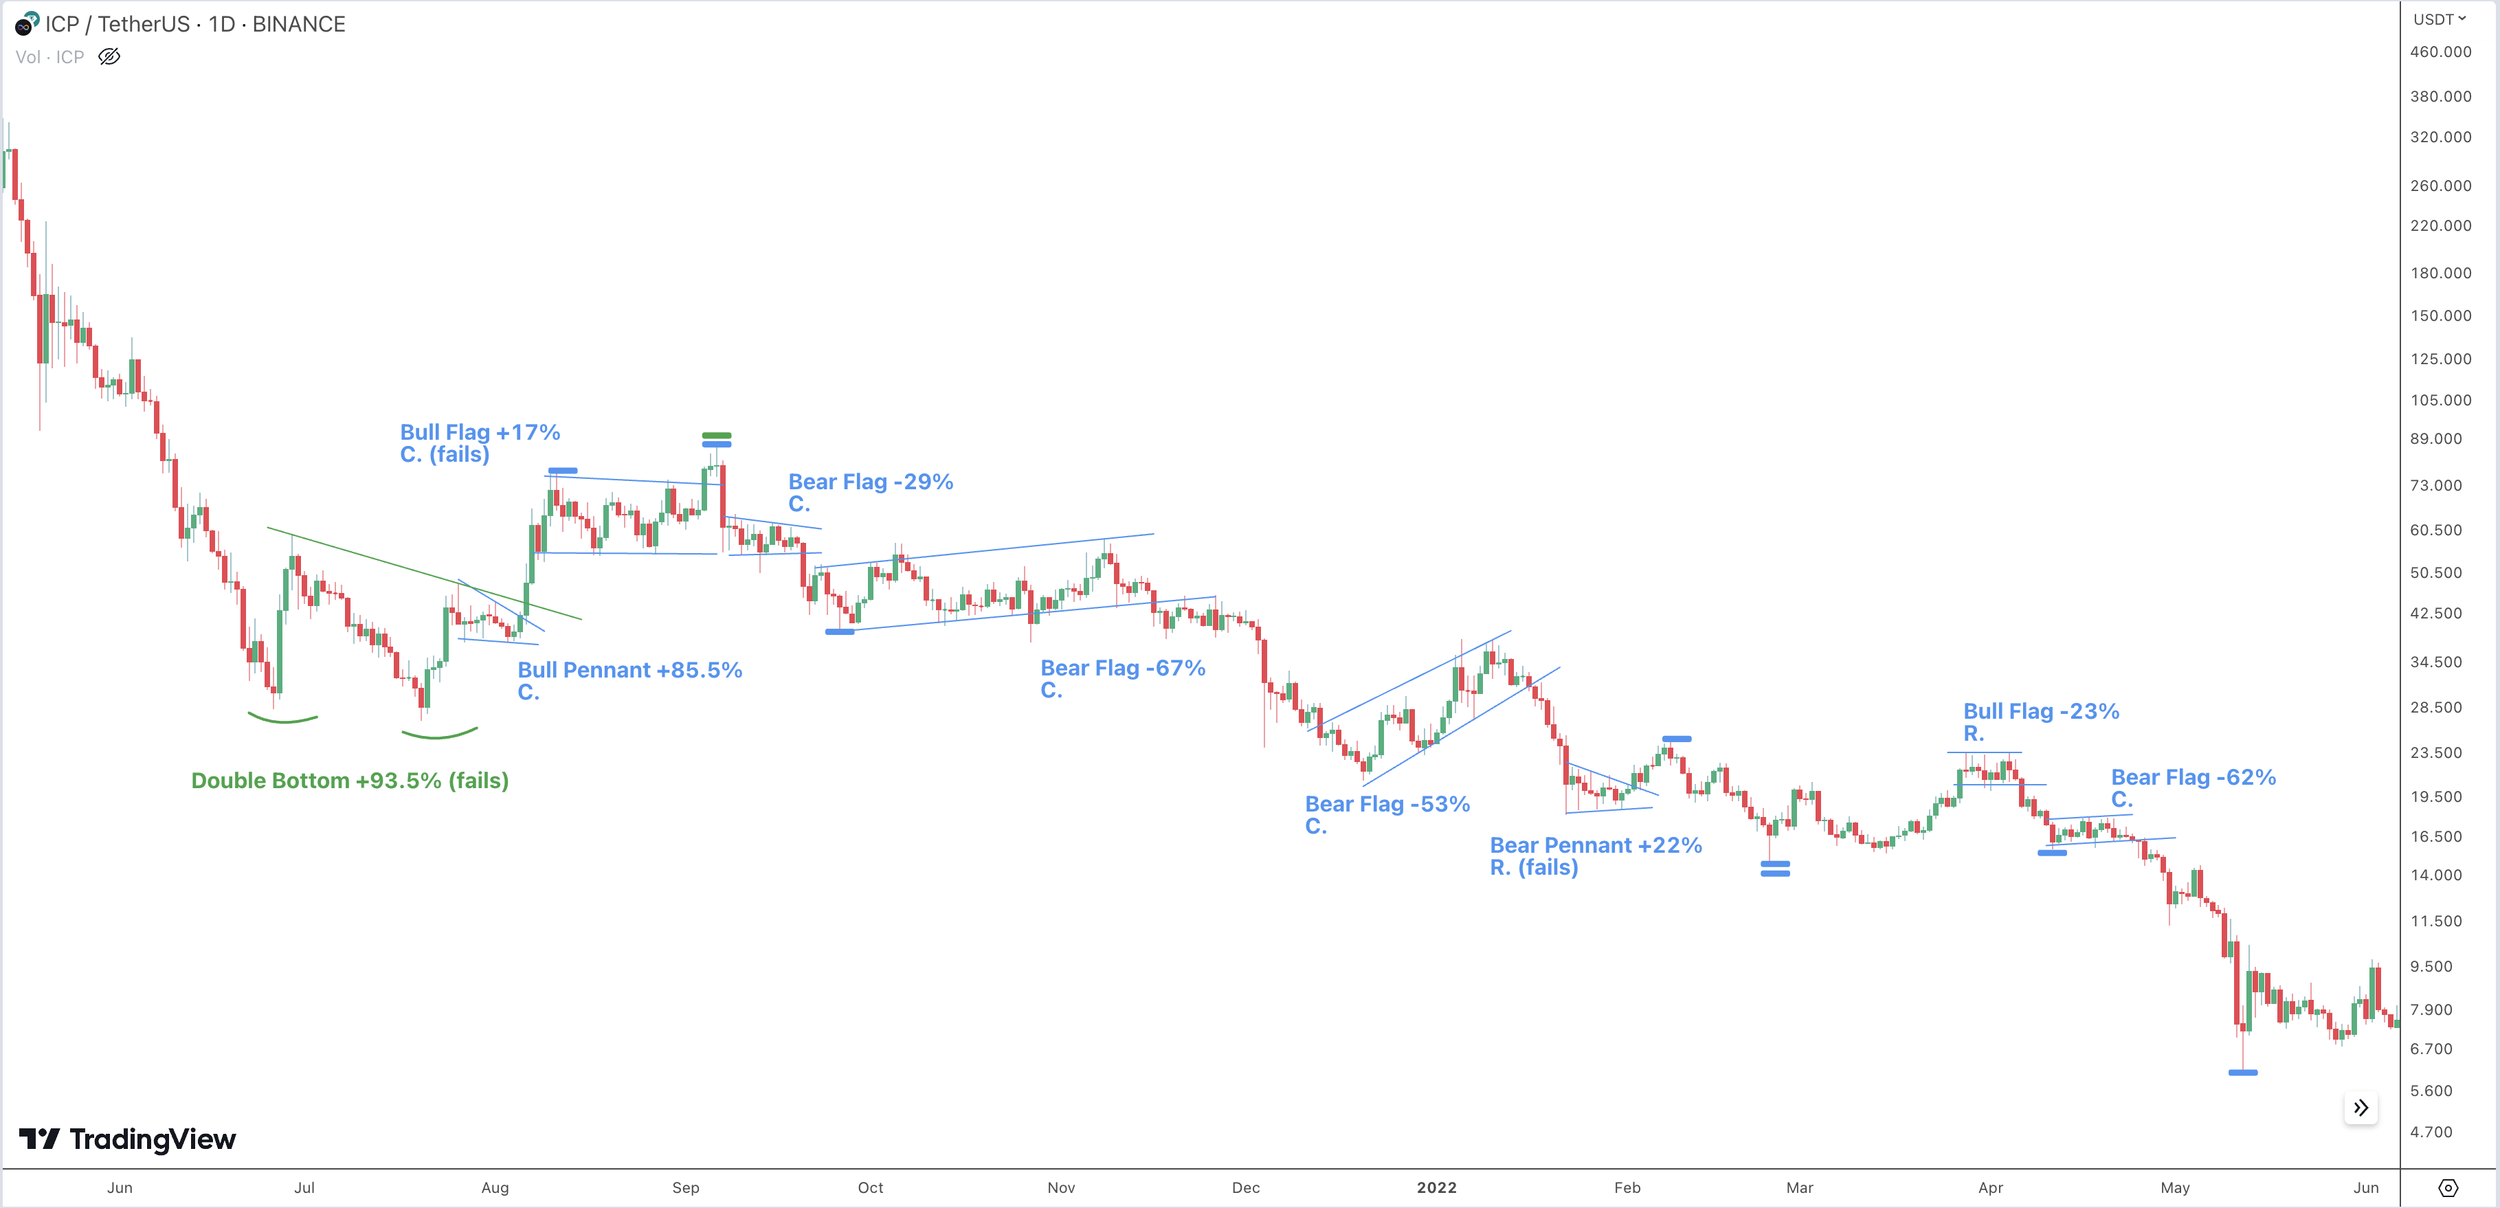
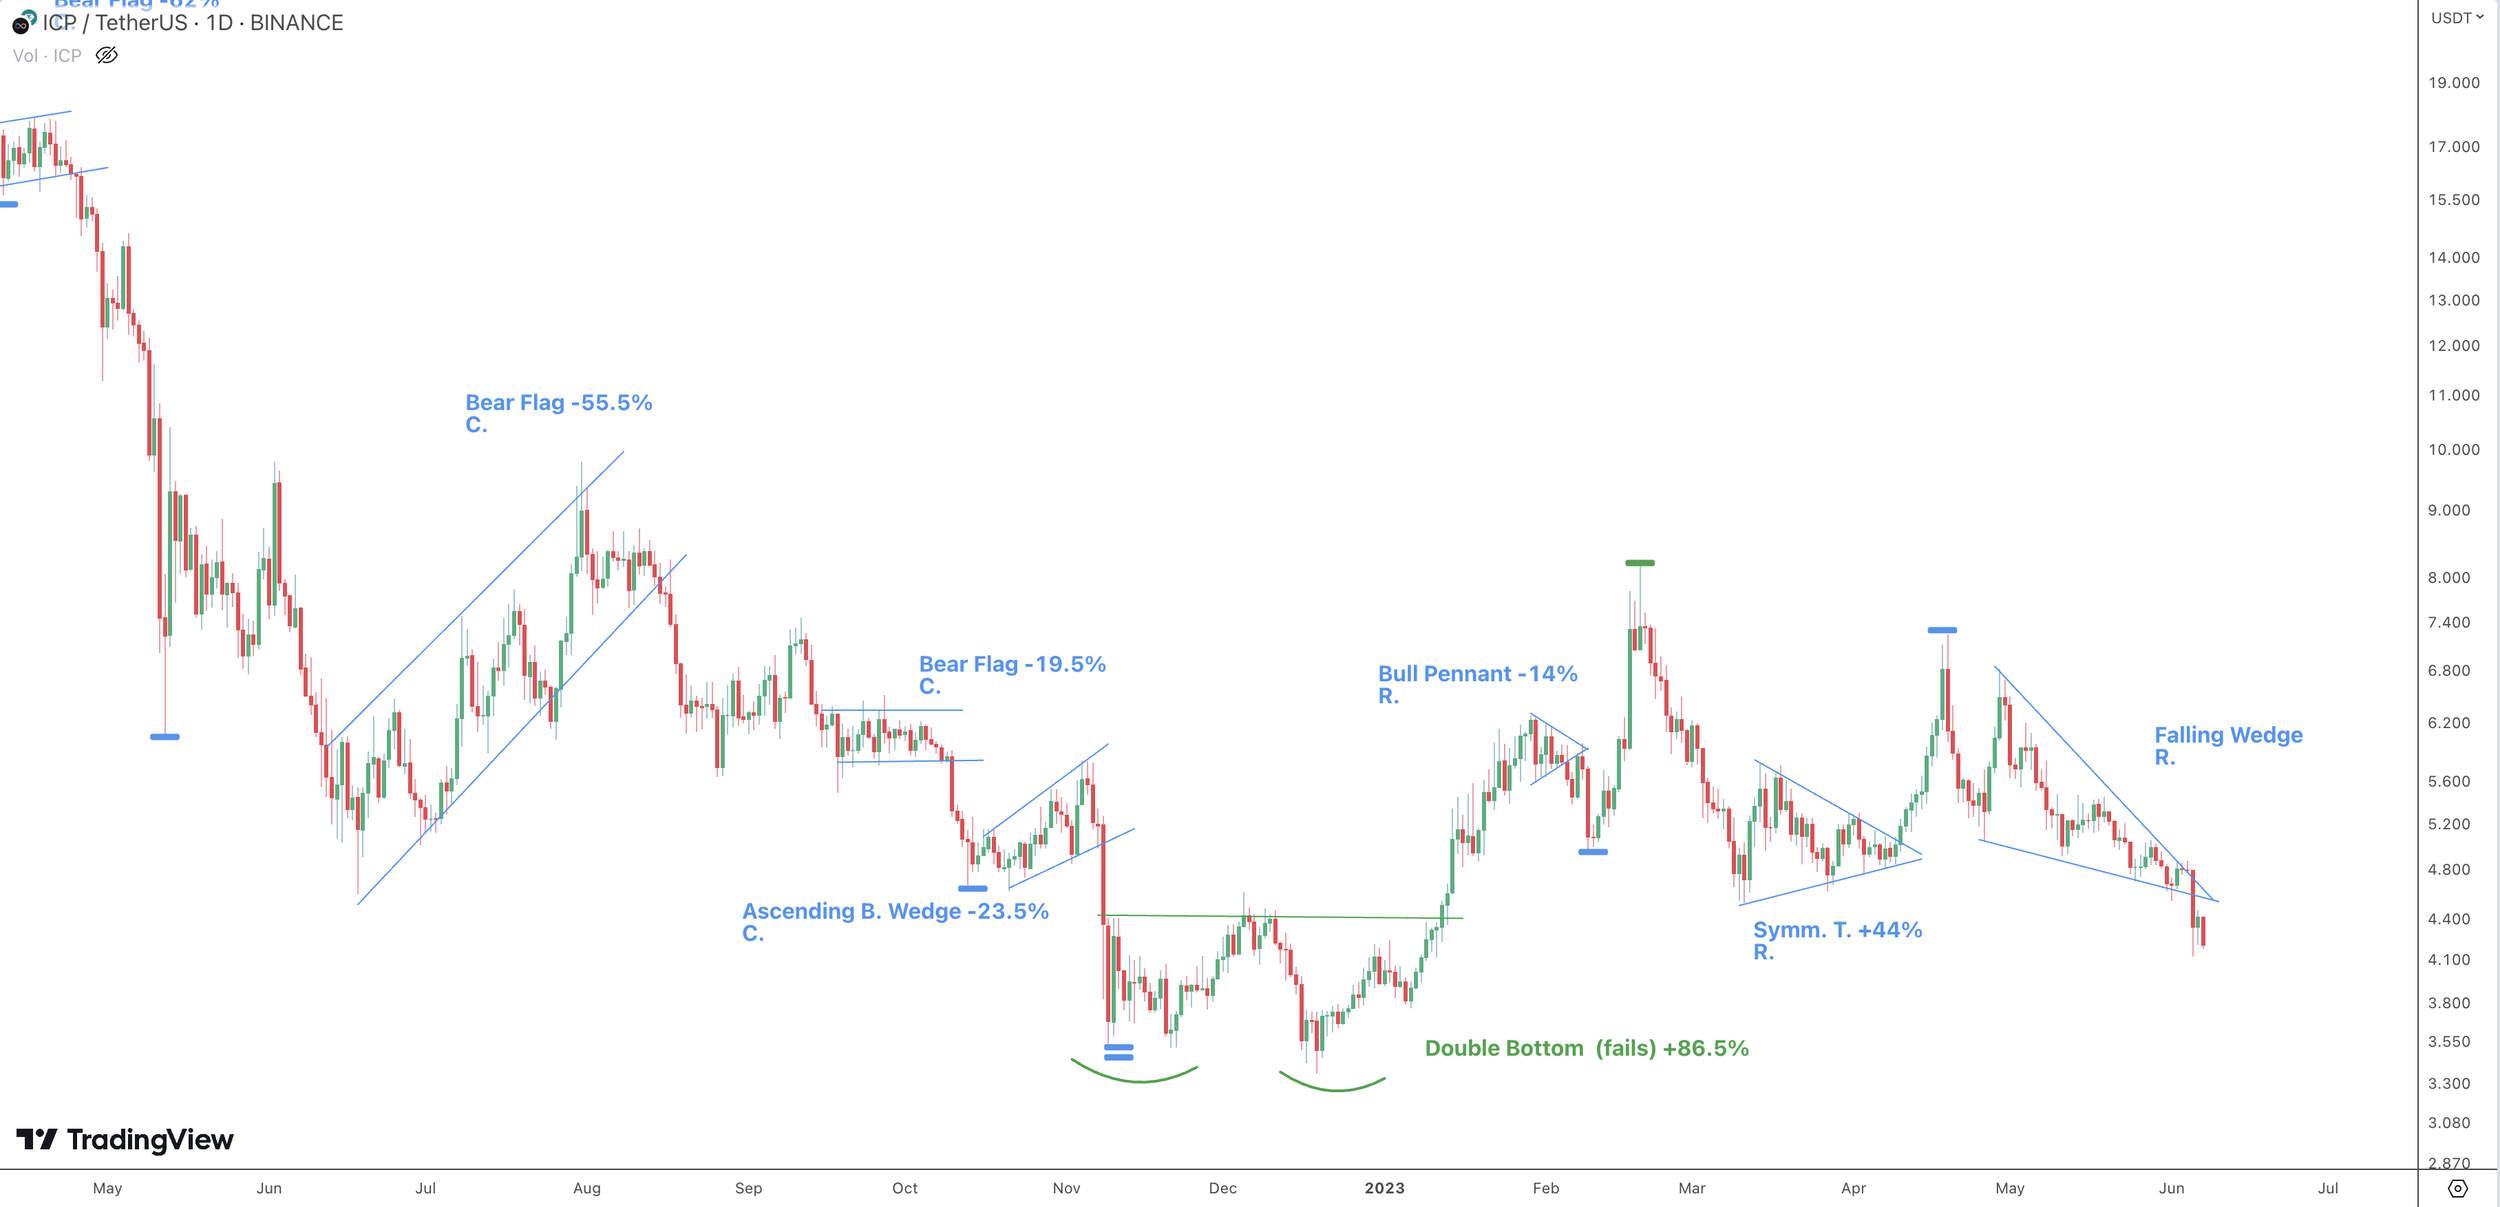
Check out free data on pattern analysis of the top 100 cryptocurrencies. Scroll through my Proof of Work to see nearly 400 charts and over 3,500 patterns sampled for the data. Feel free to share for educational use! Follow the methodology, and incorporate it how you like in your trading routine!
Findings that might surprise you!
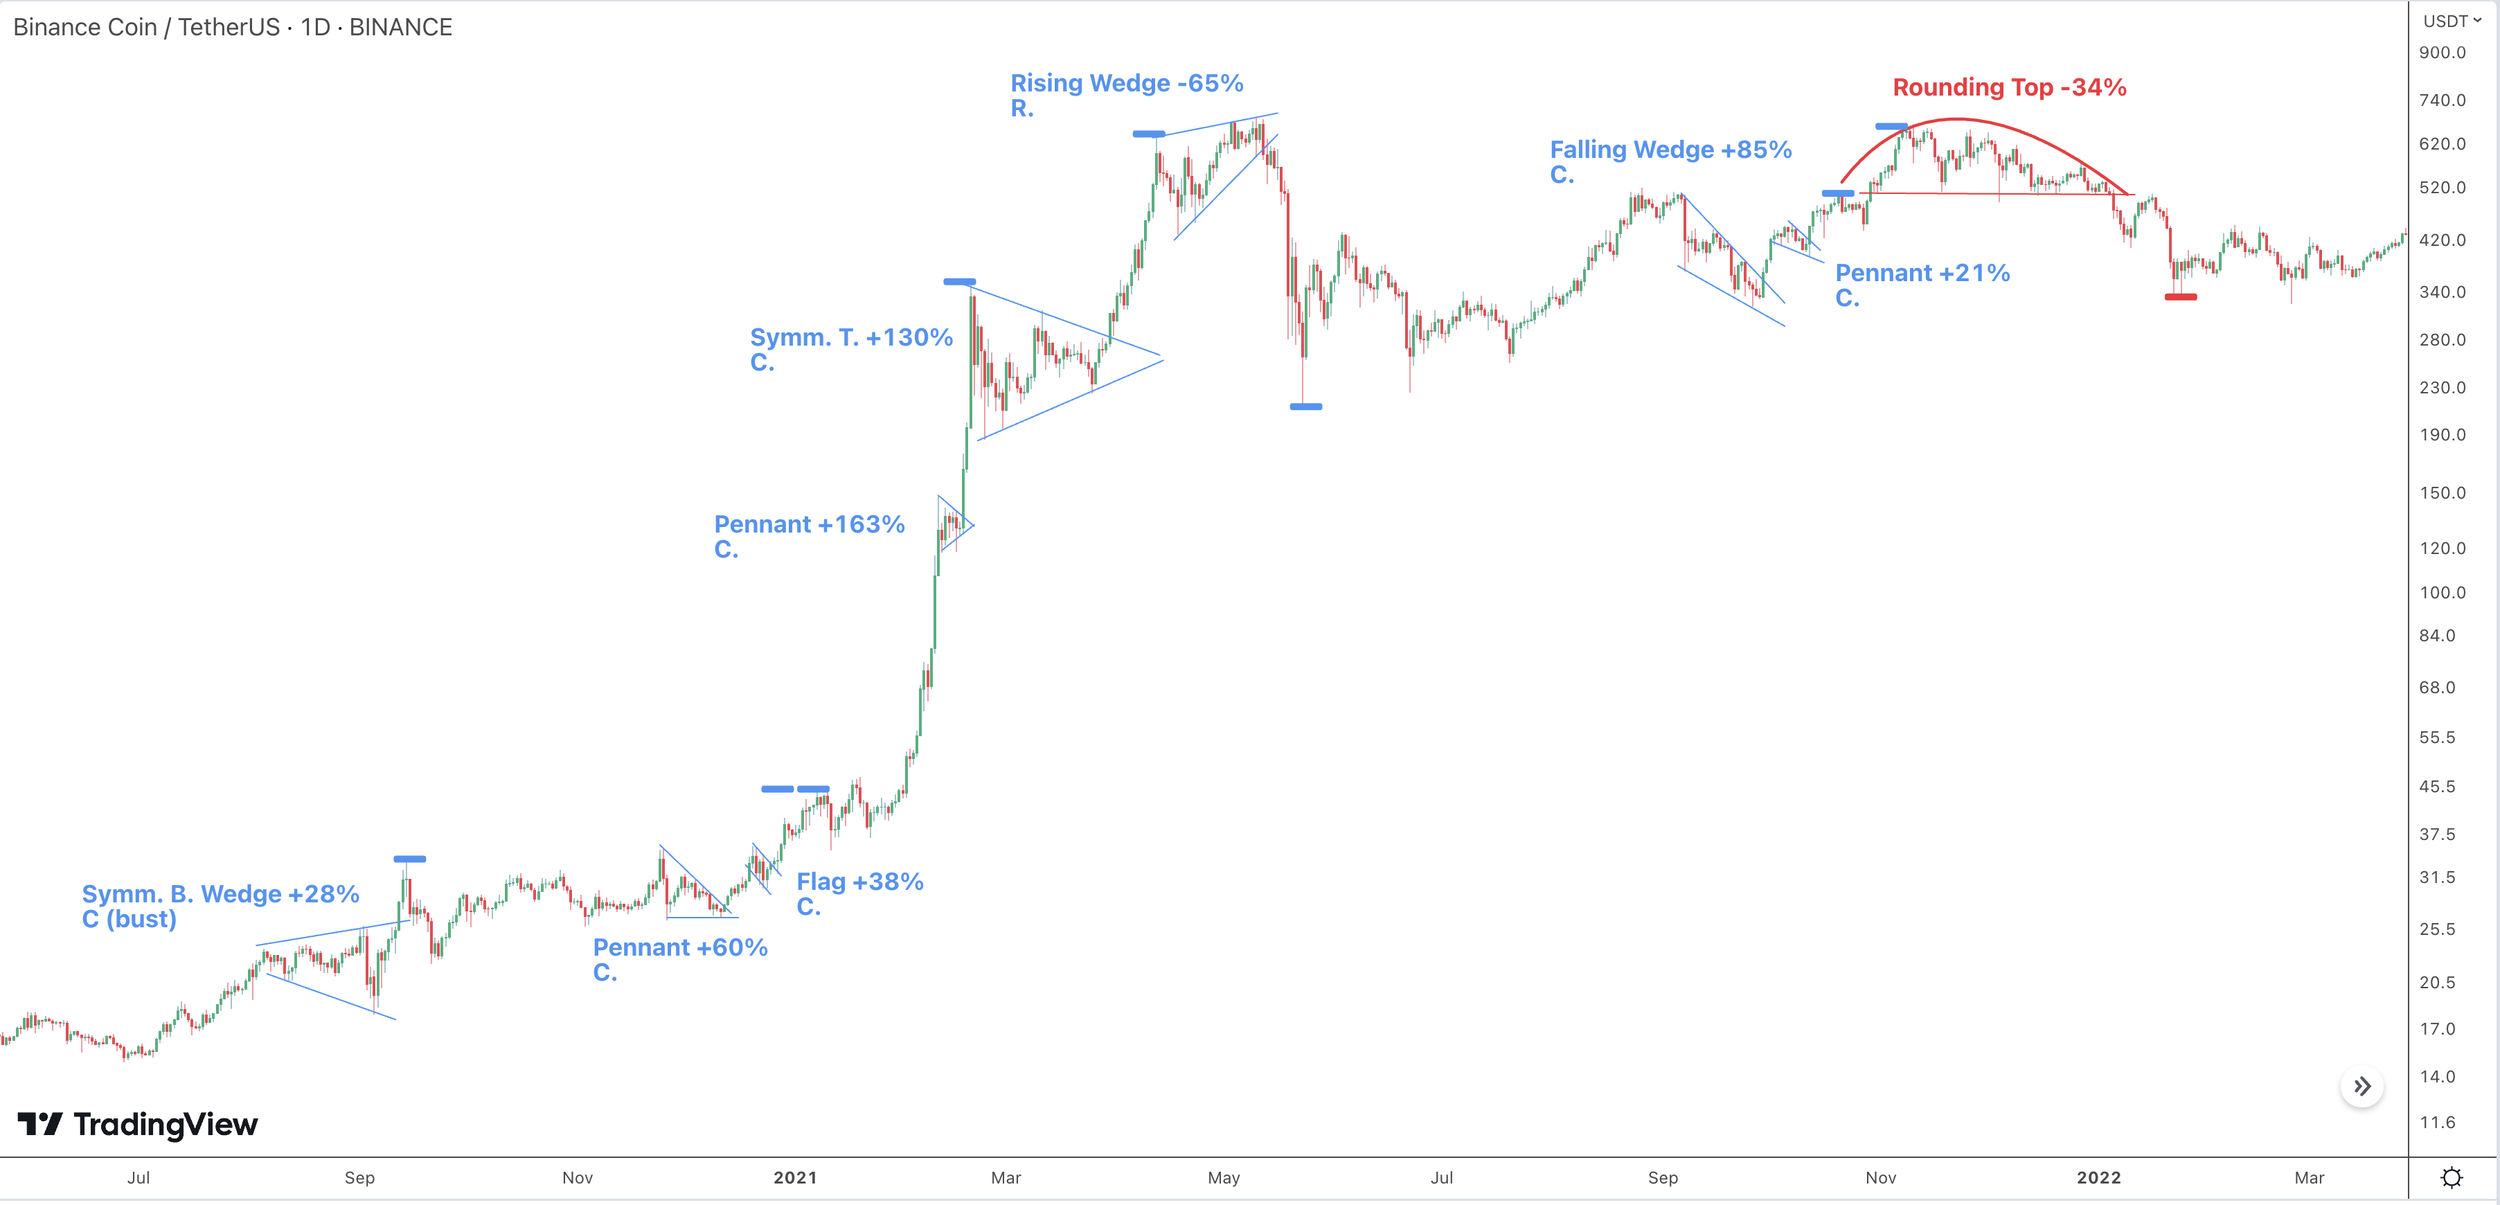
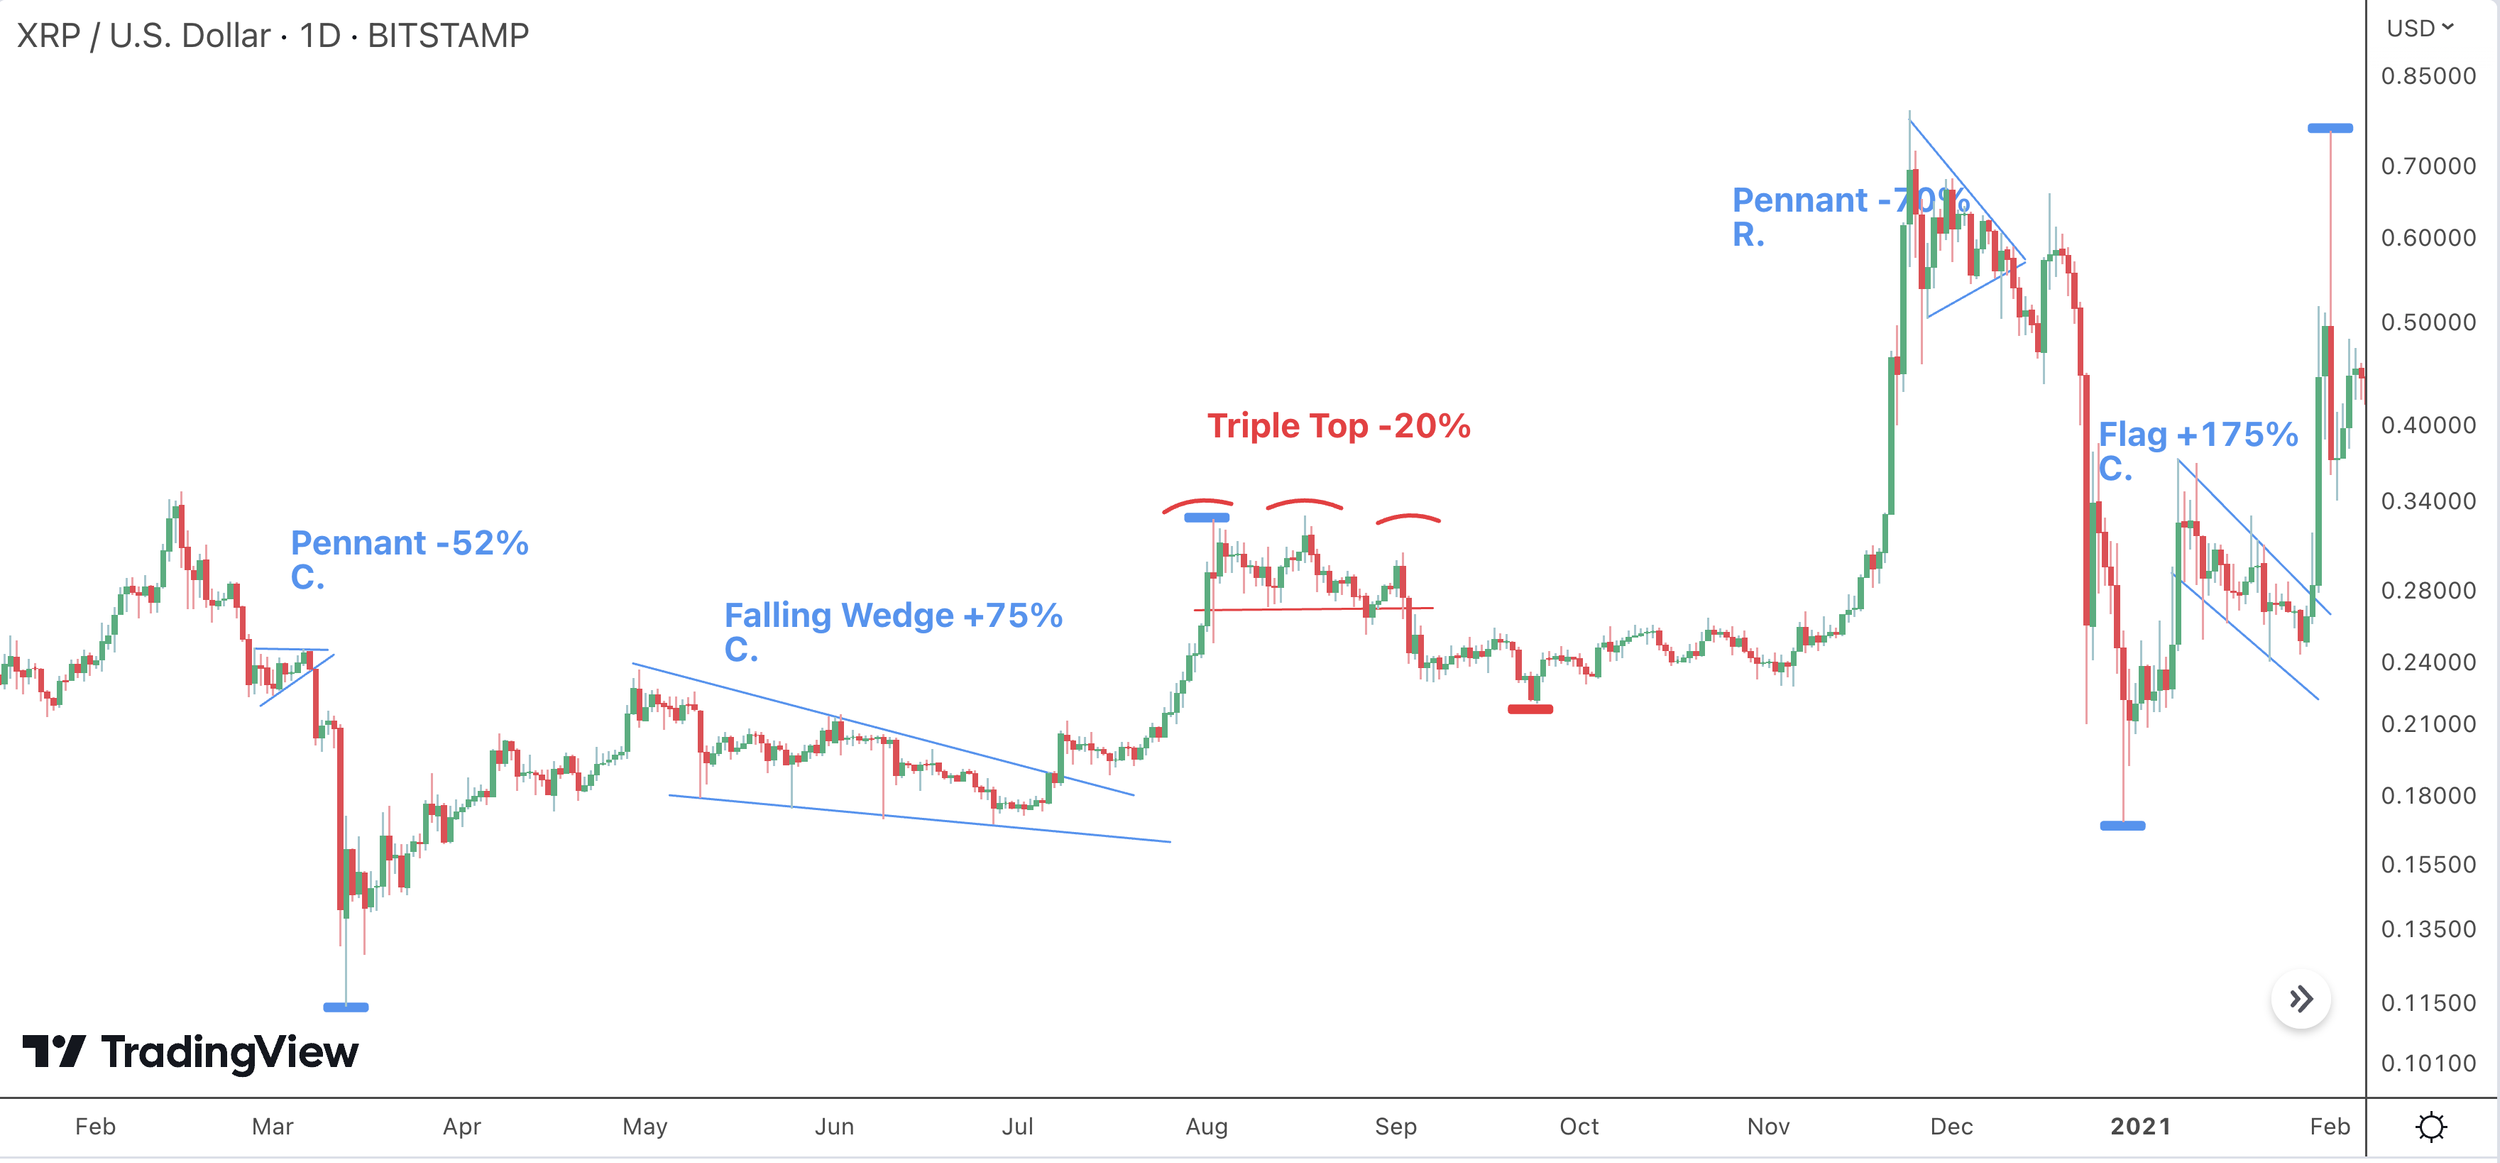
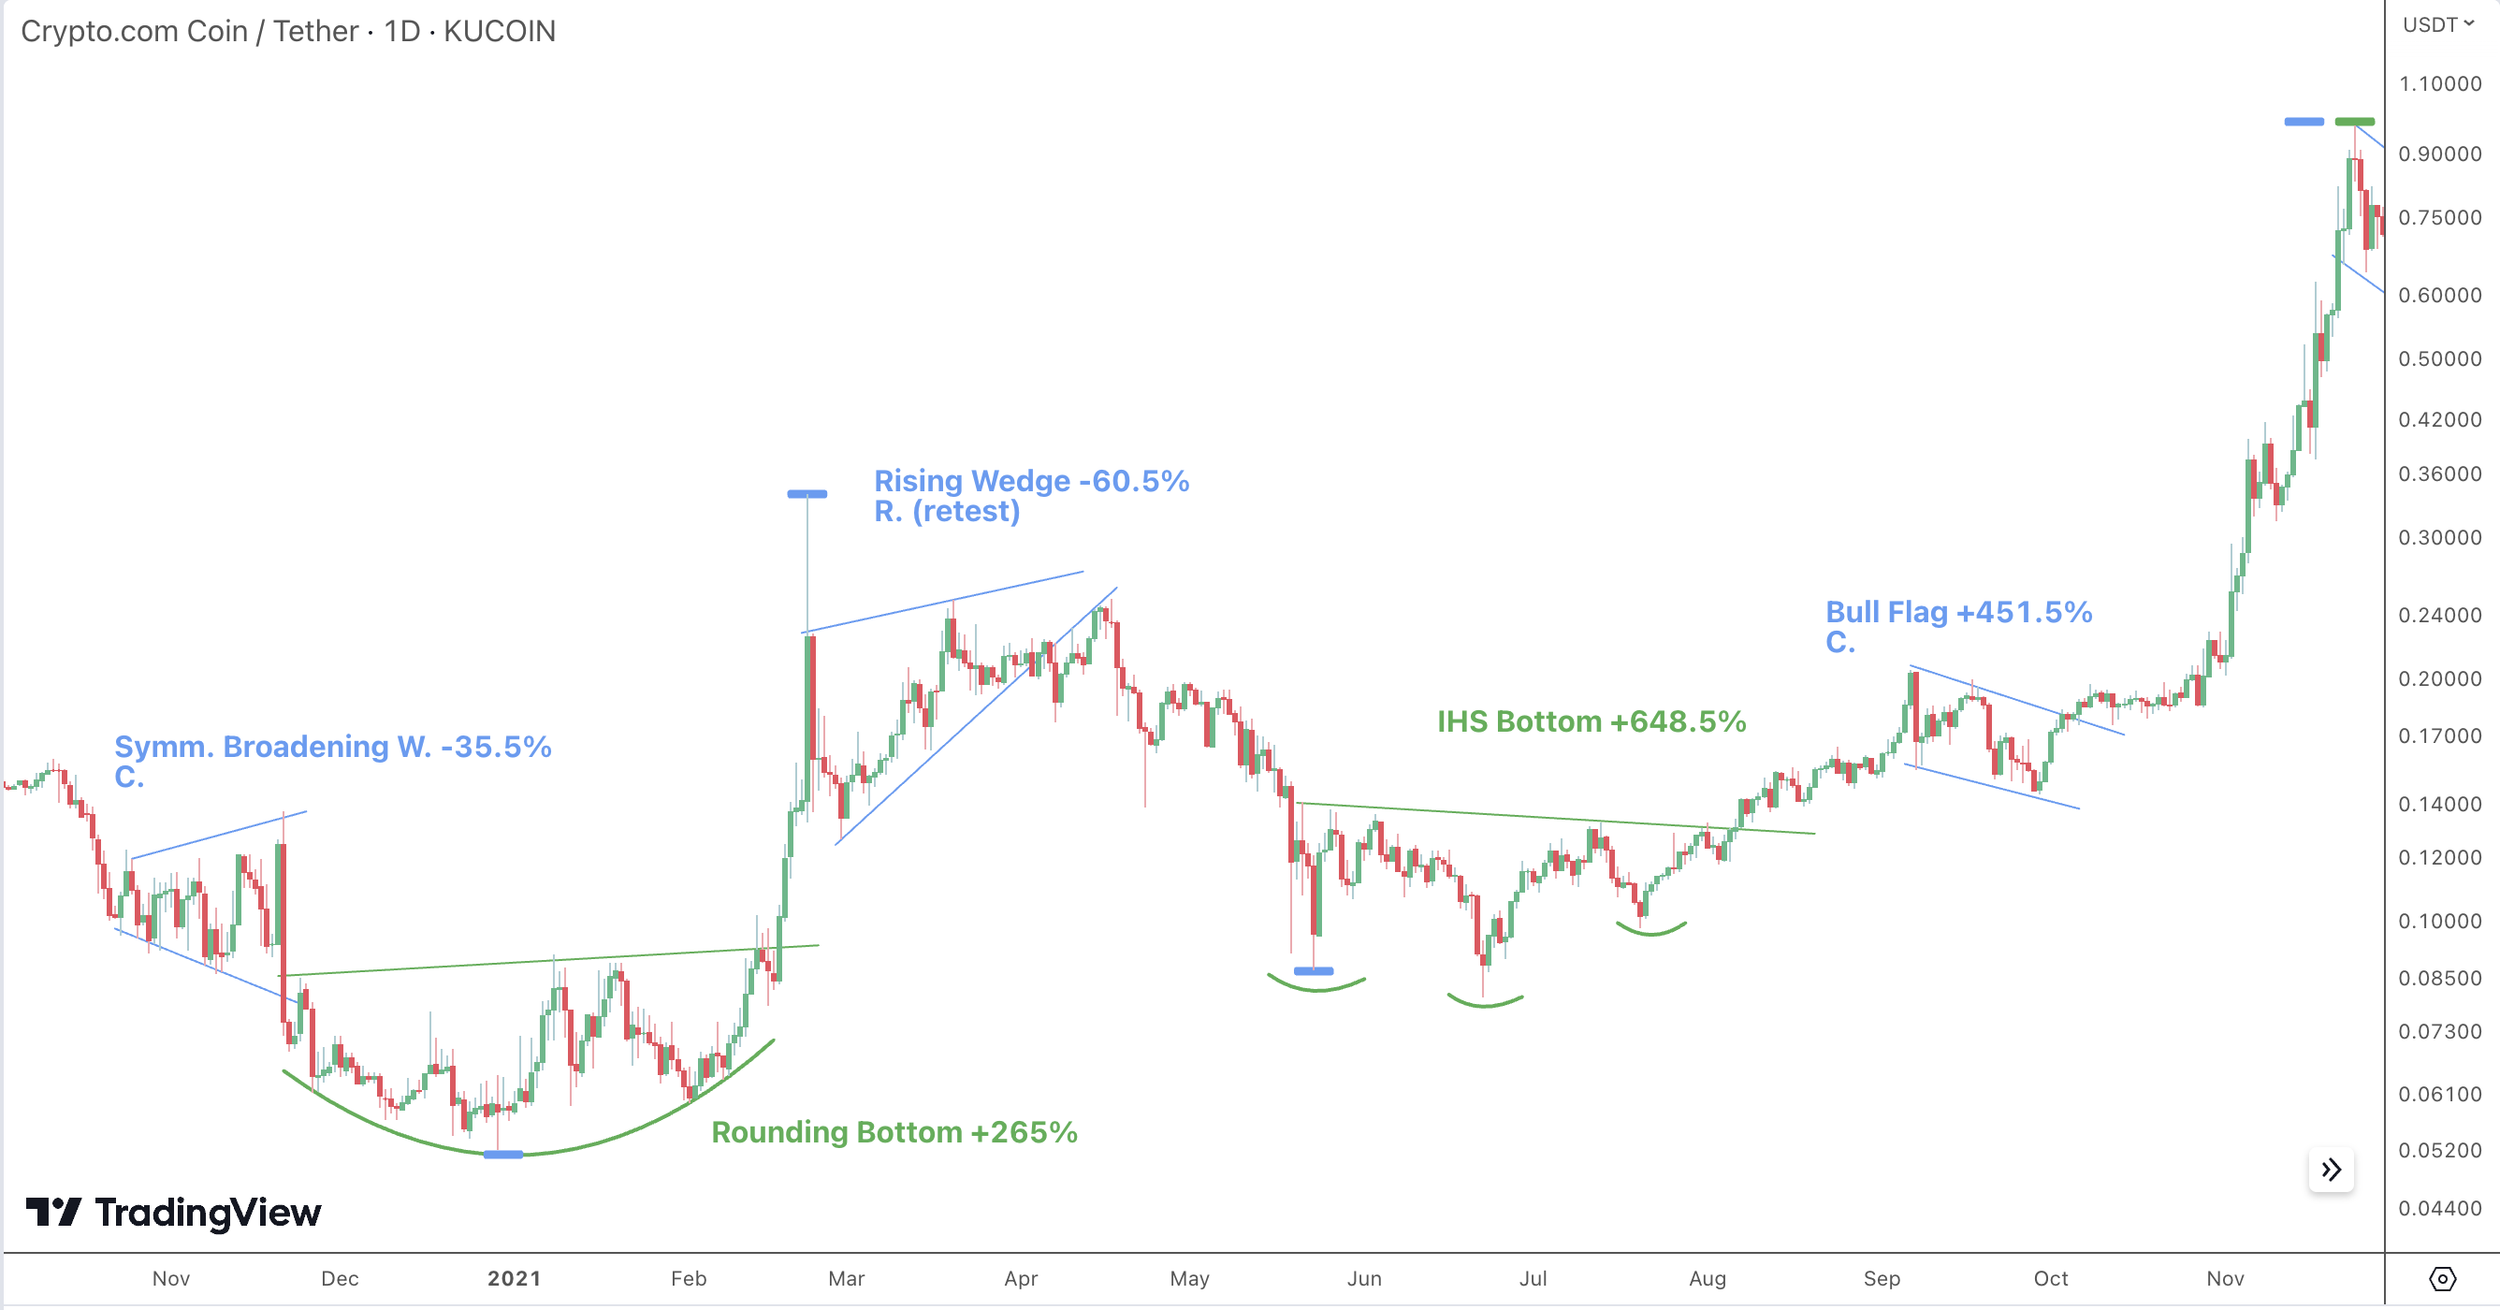
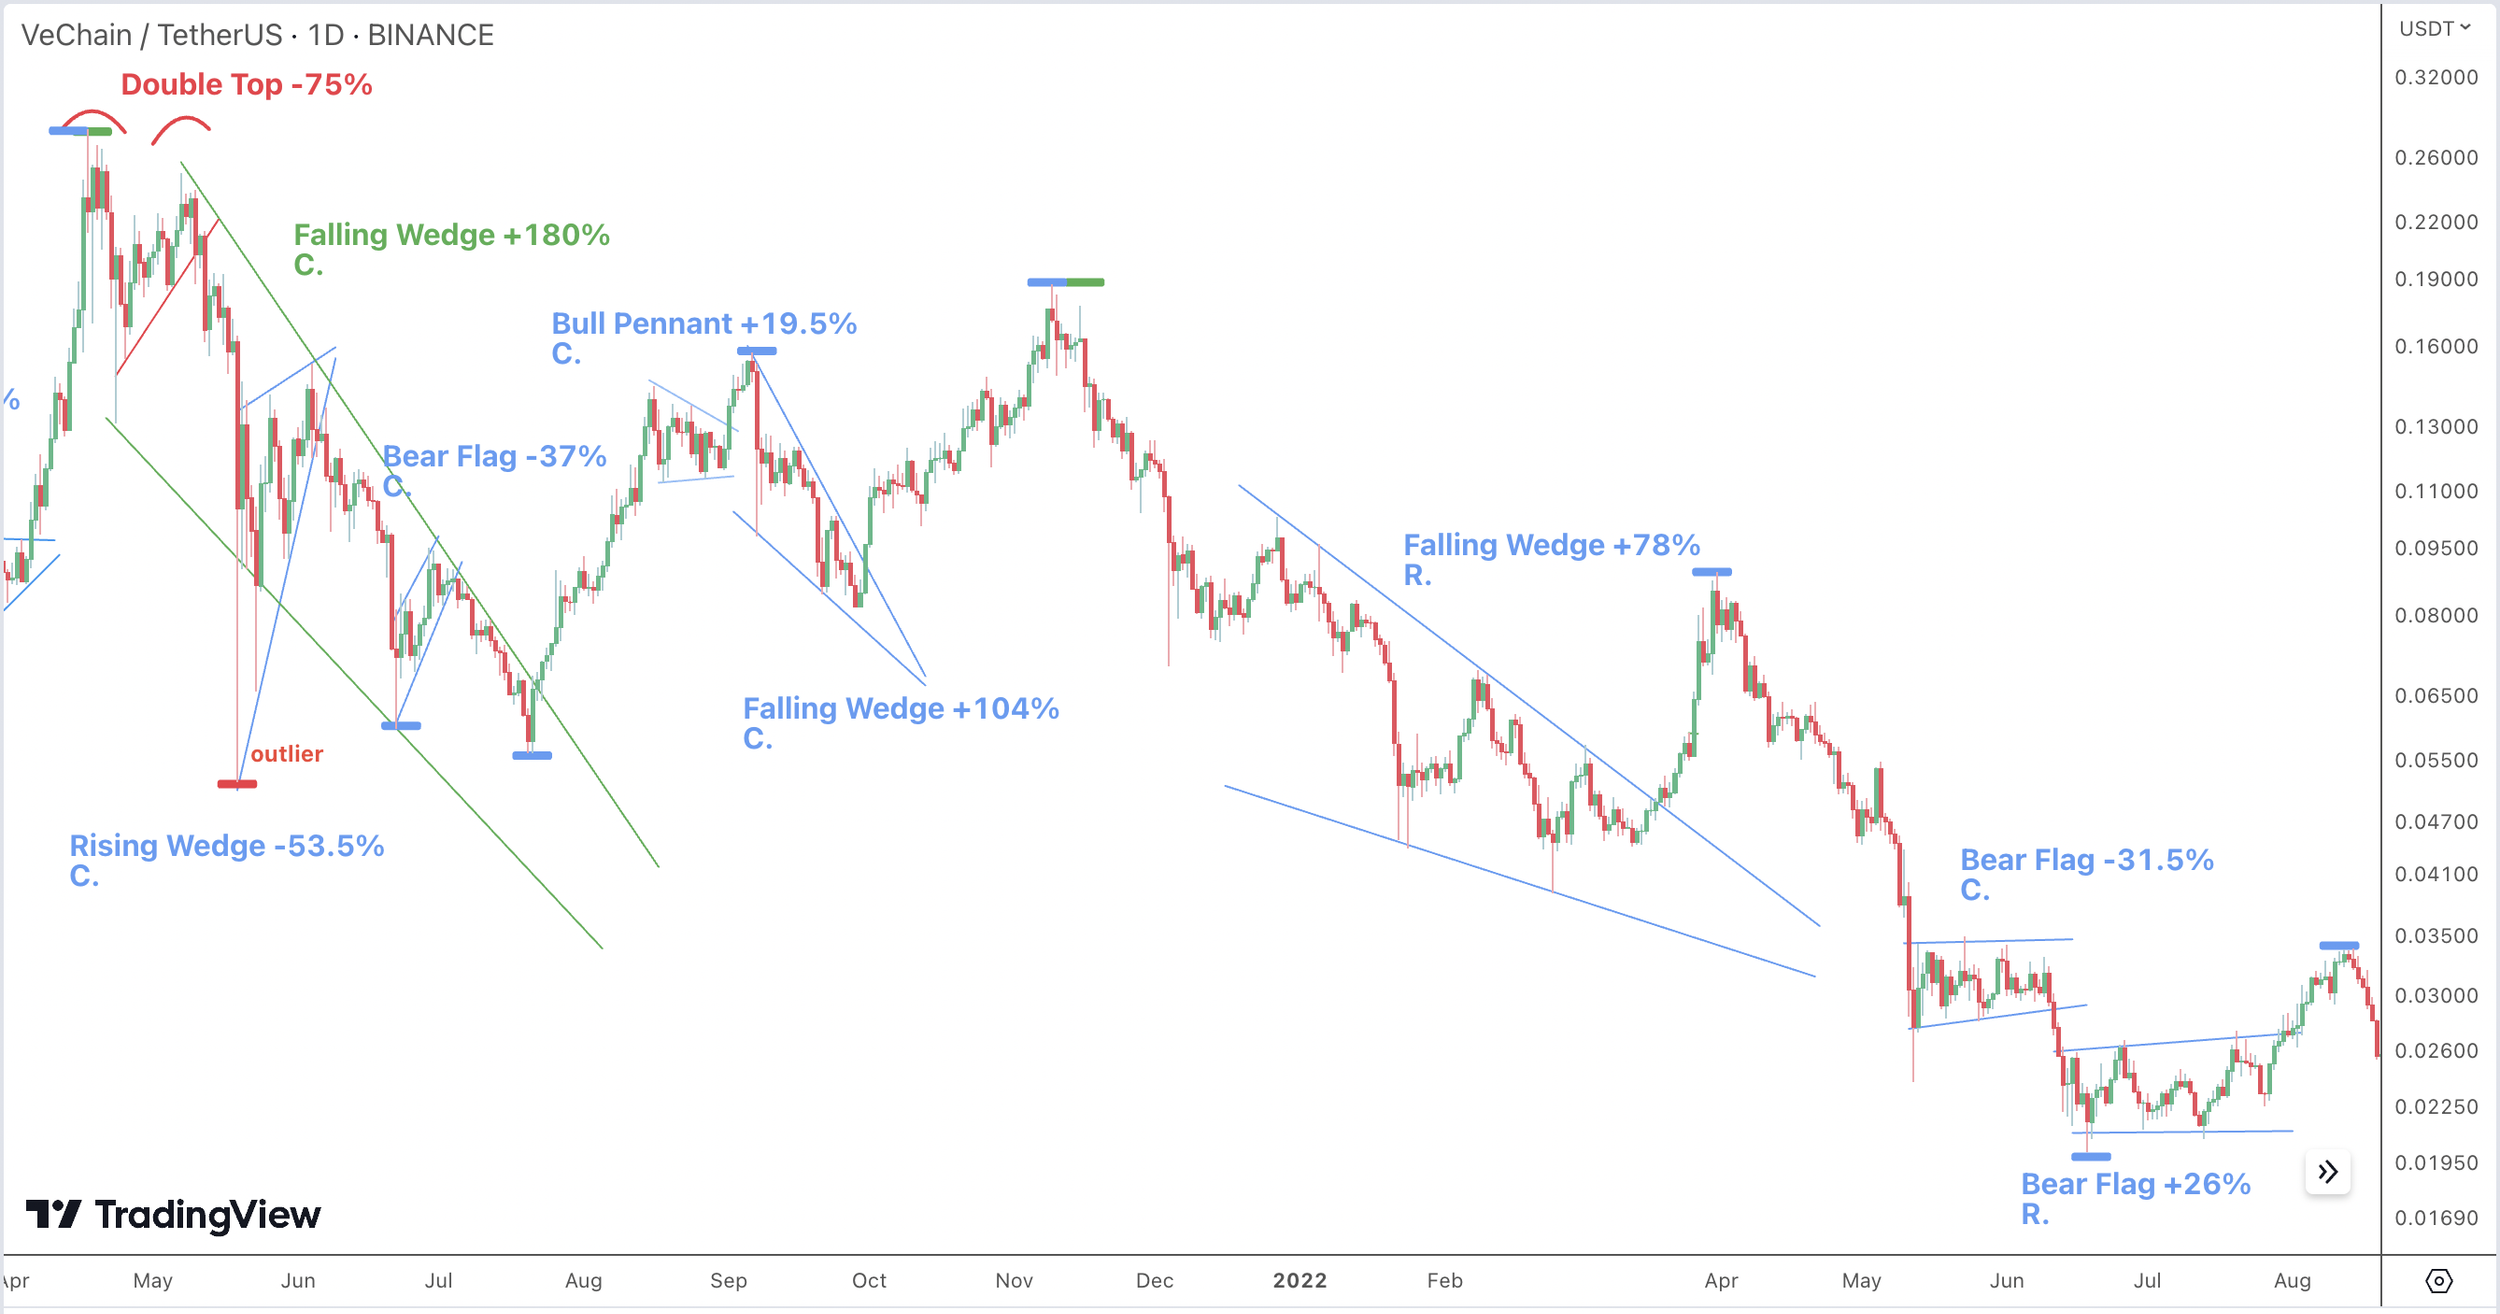
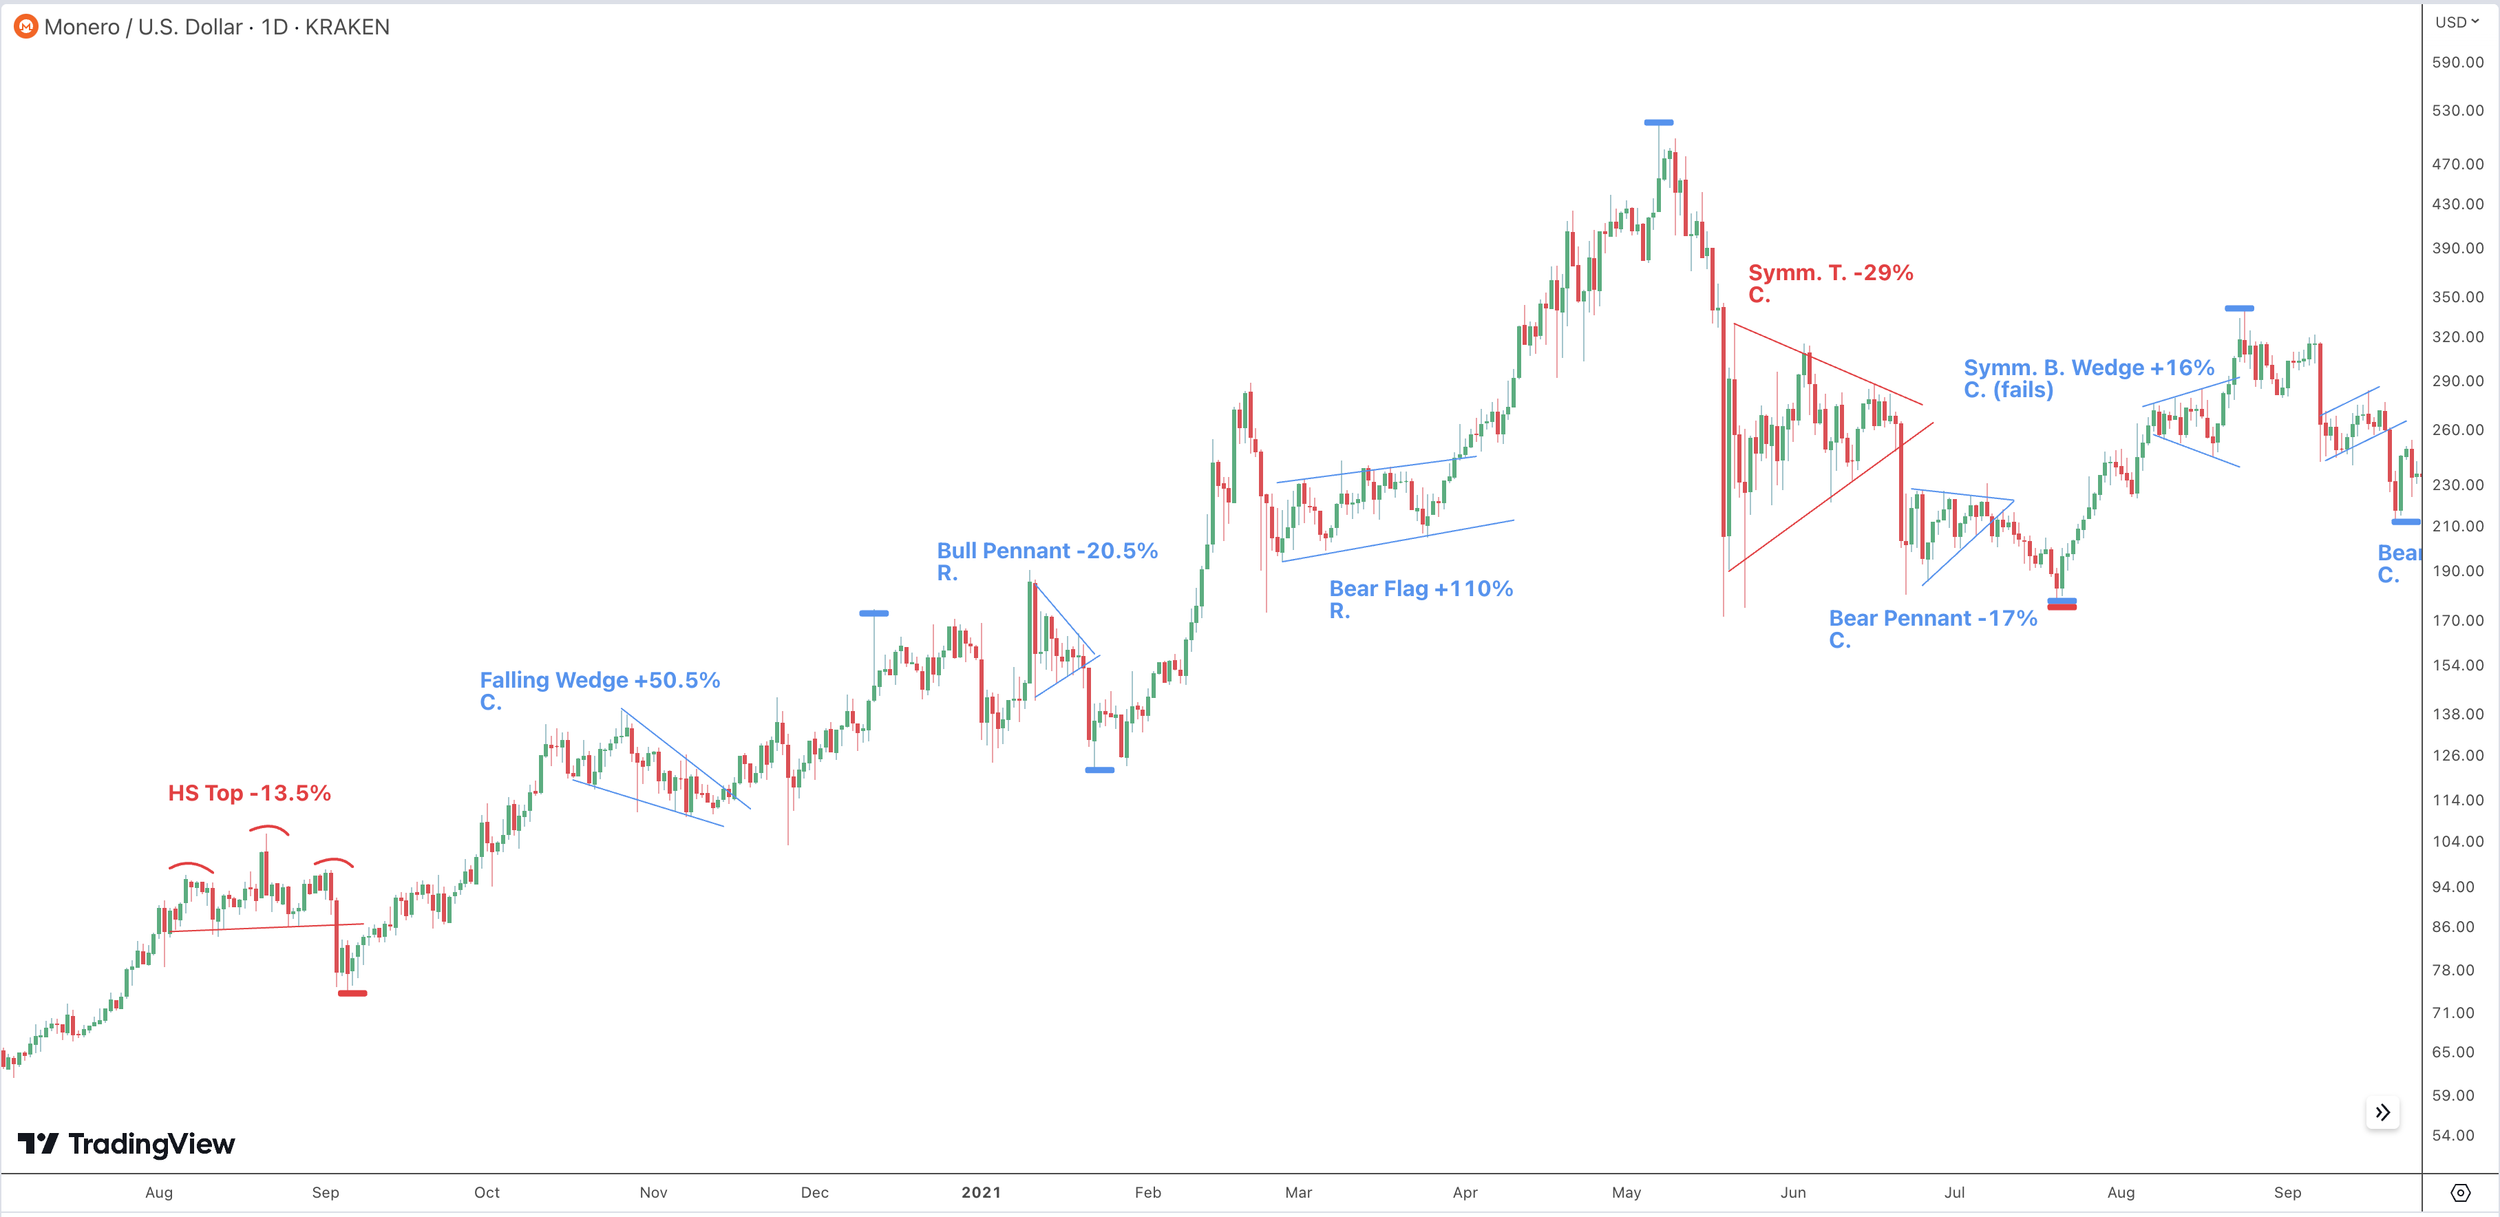
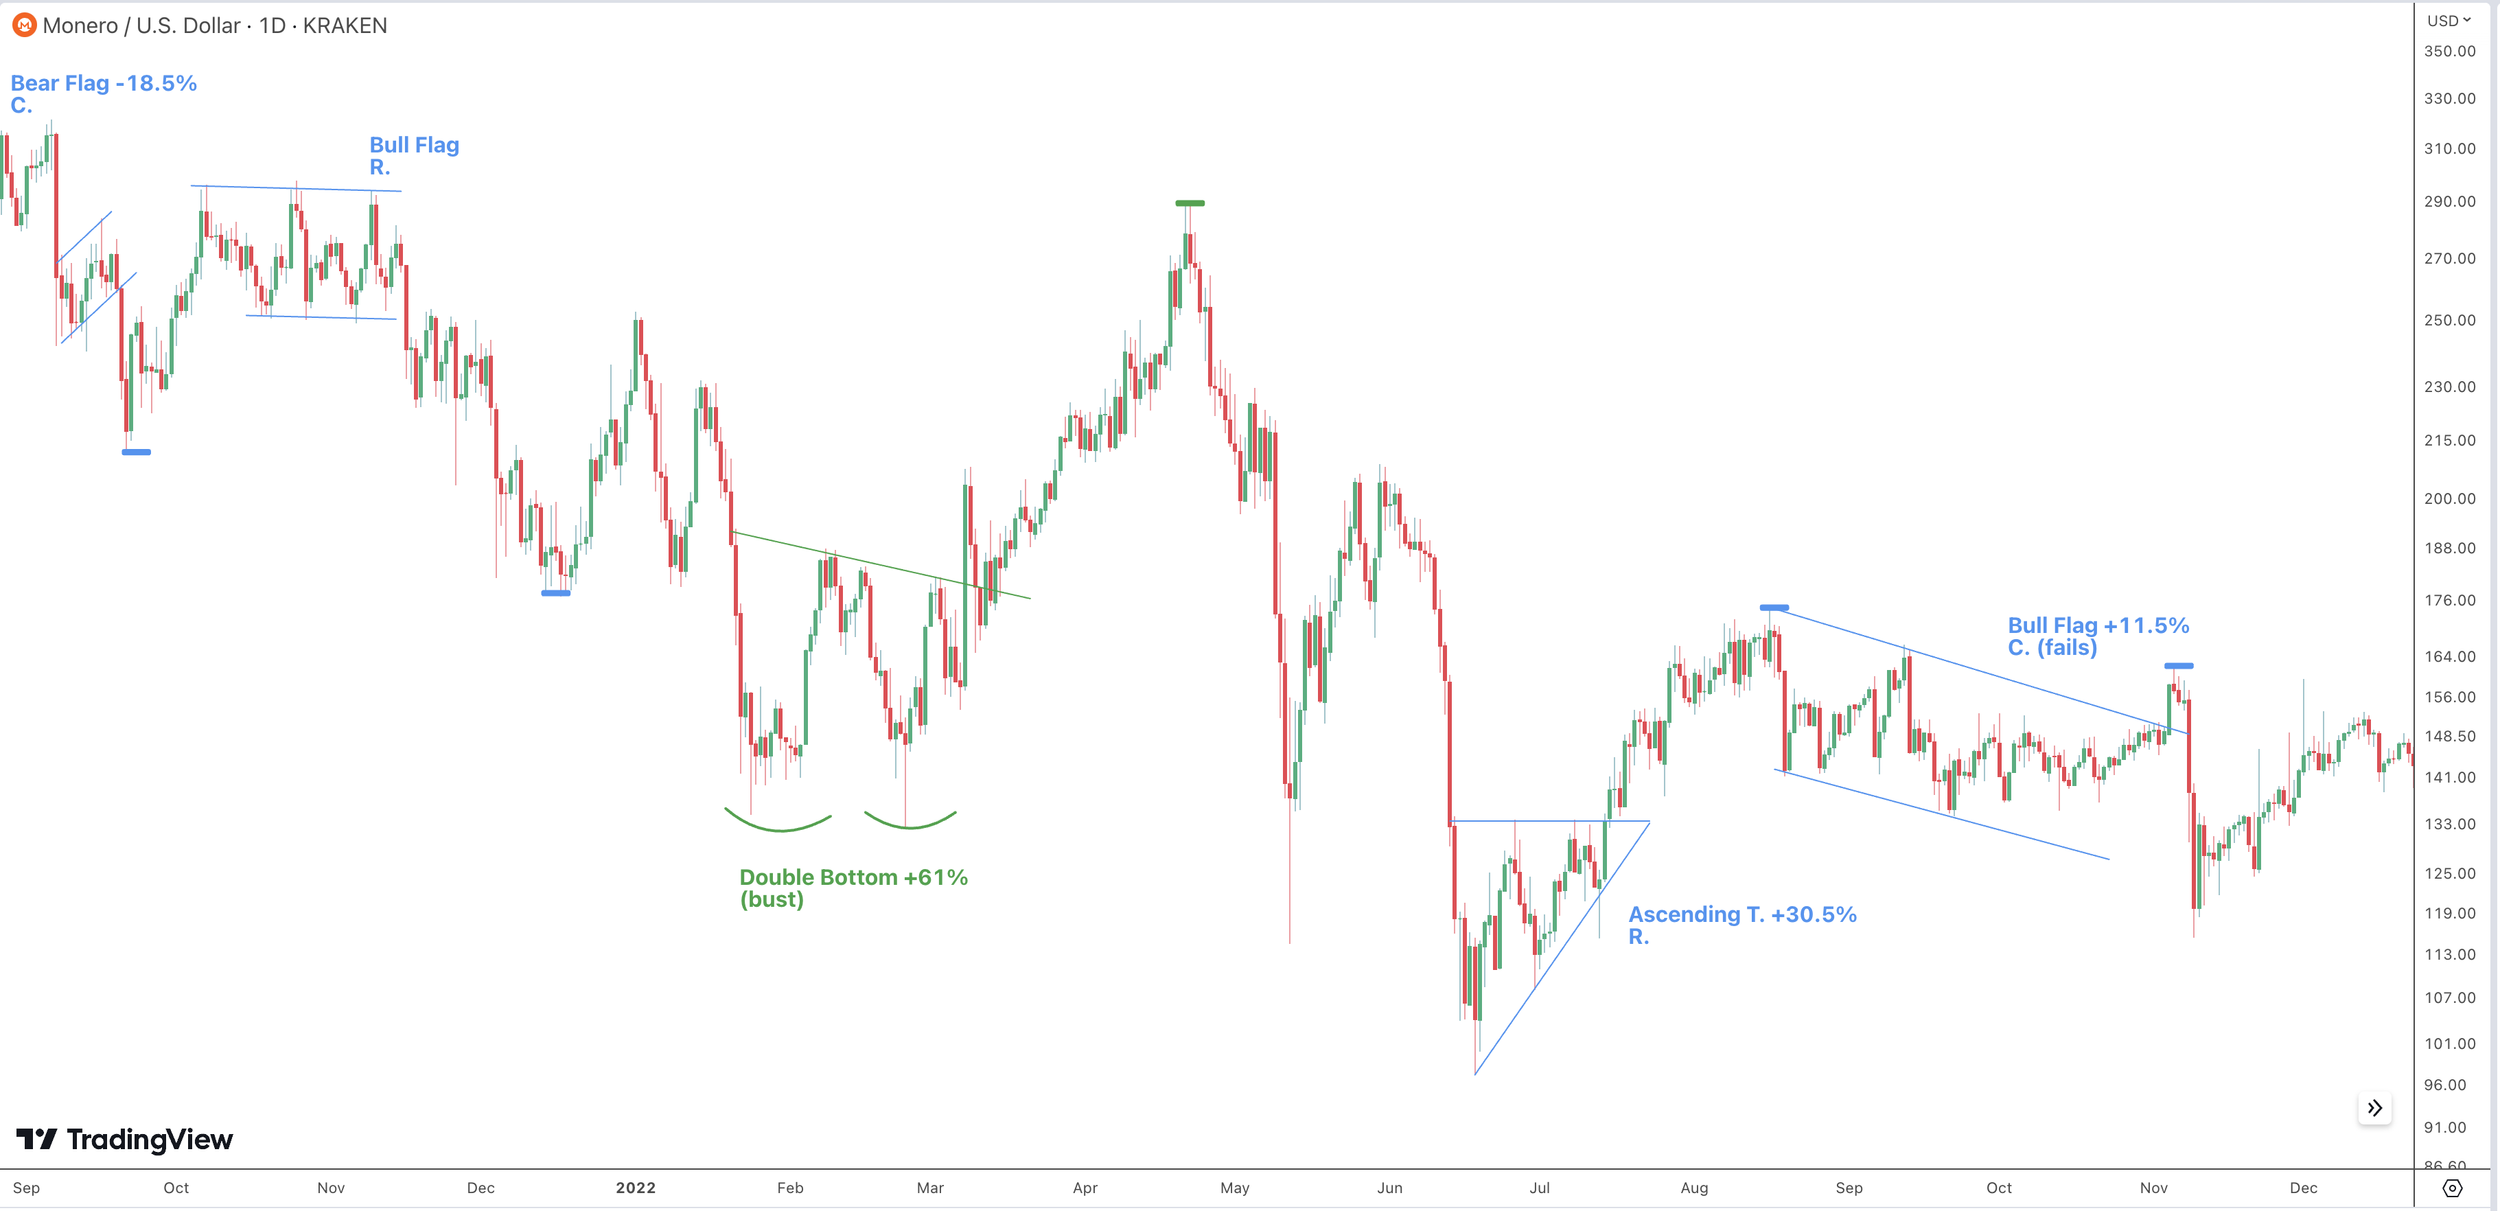
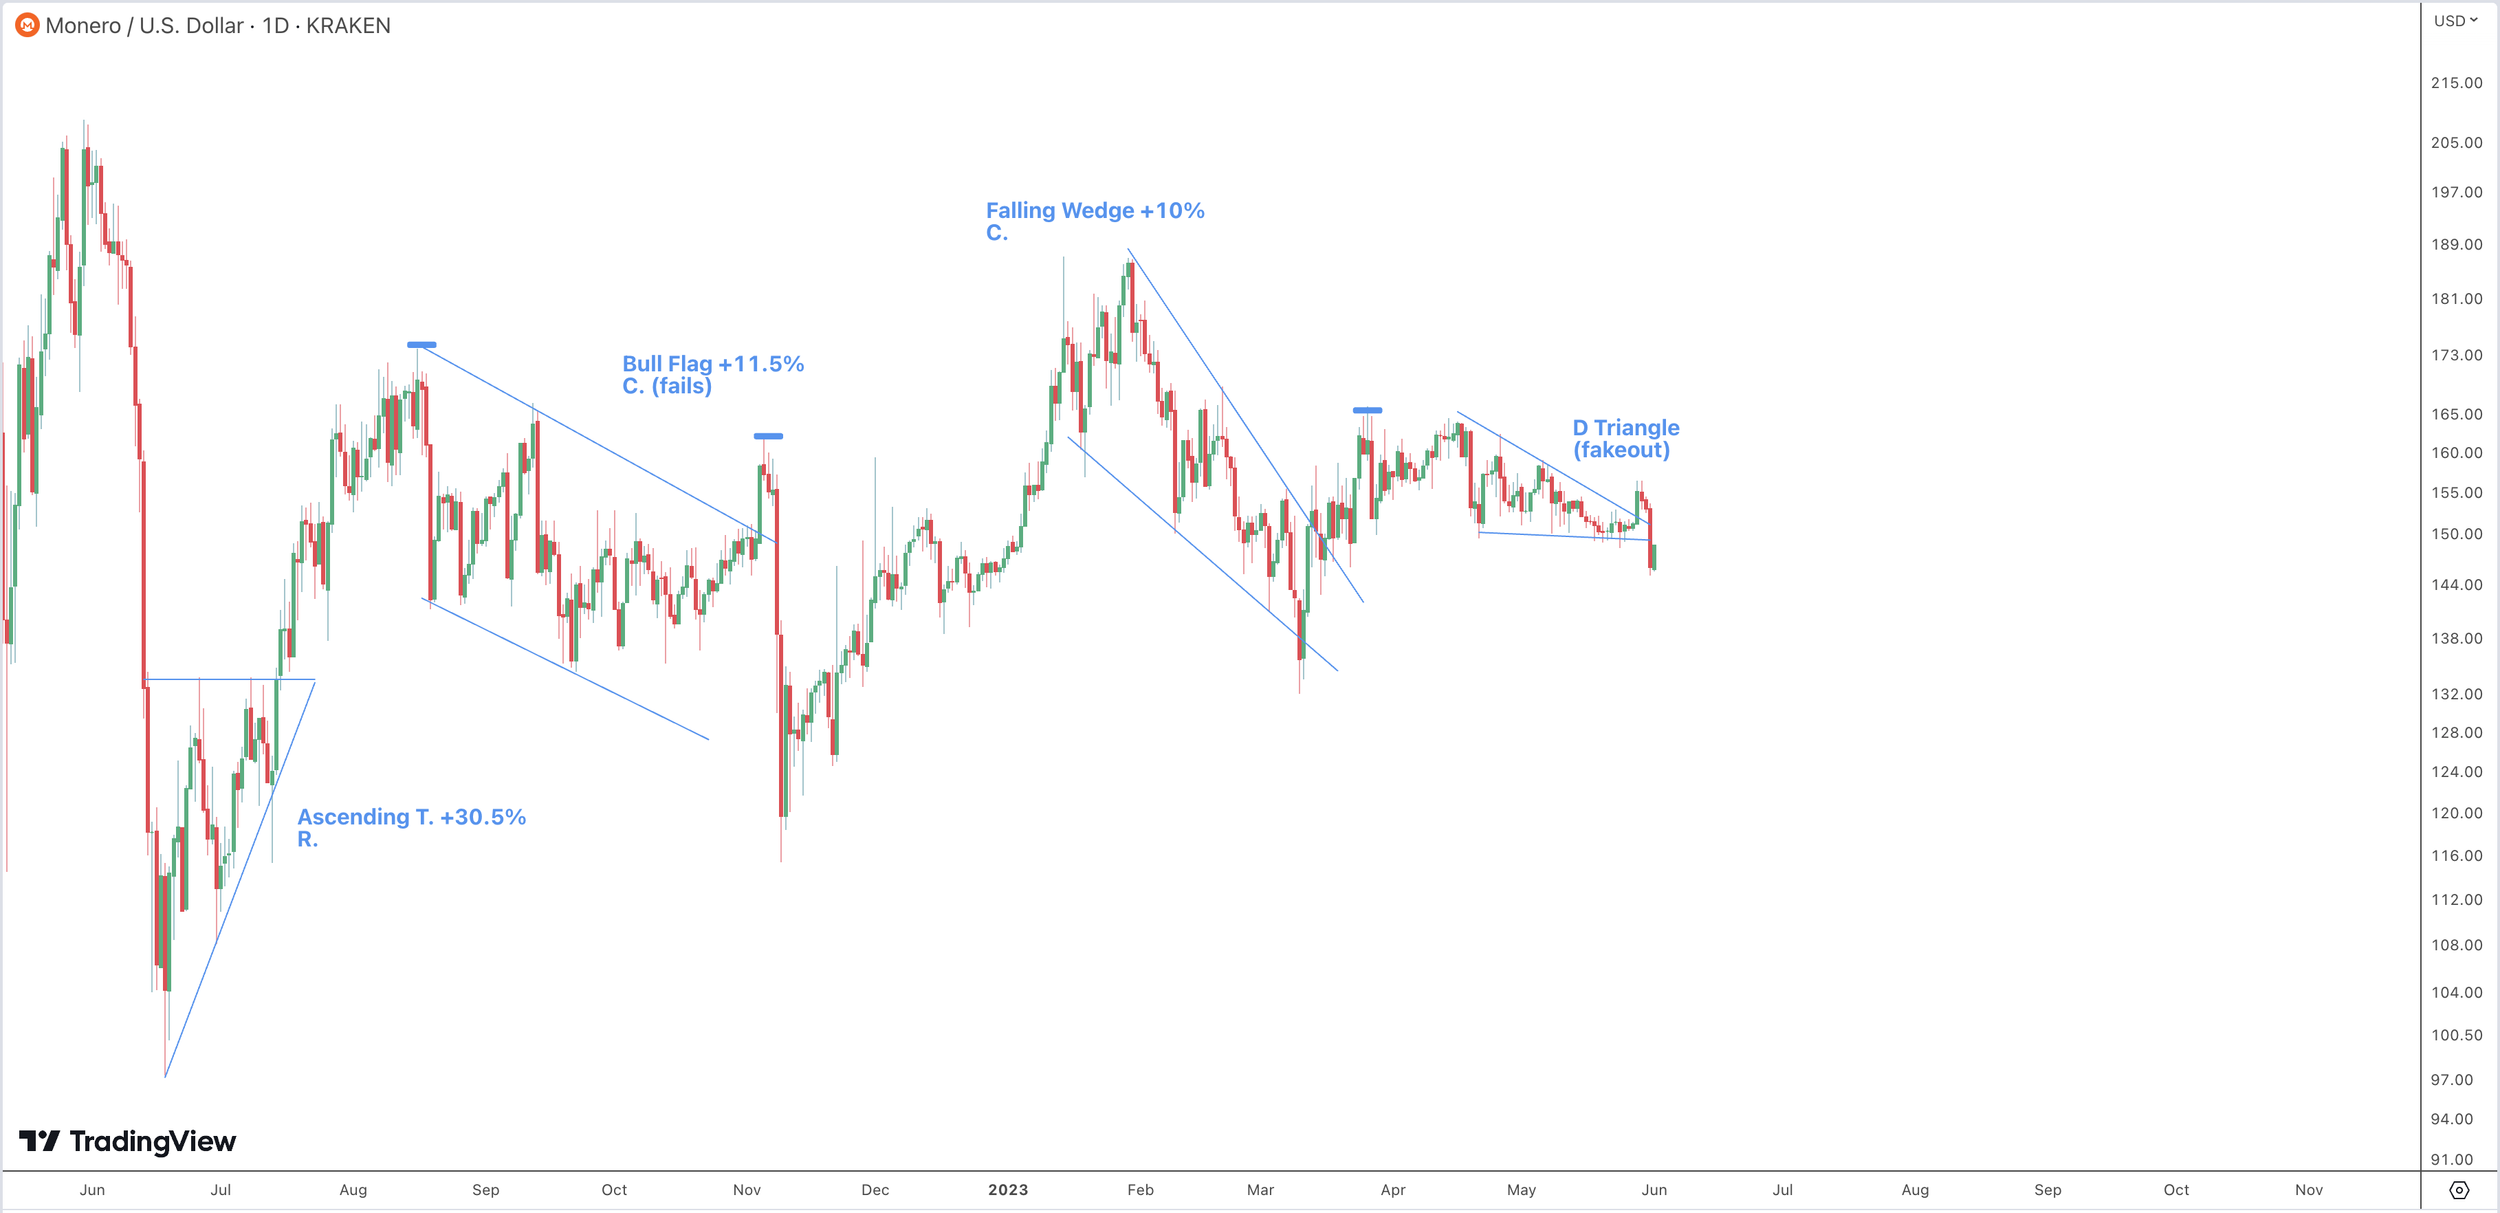
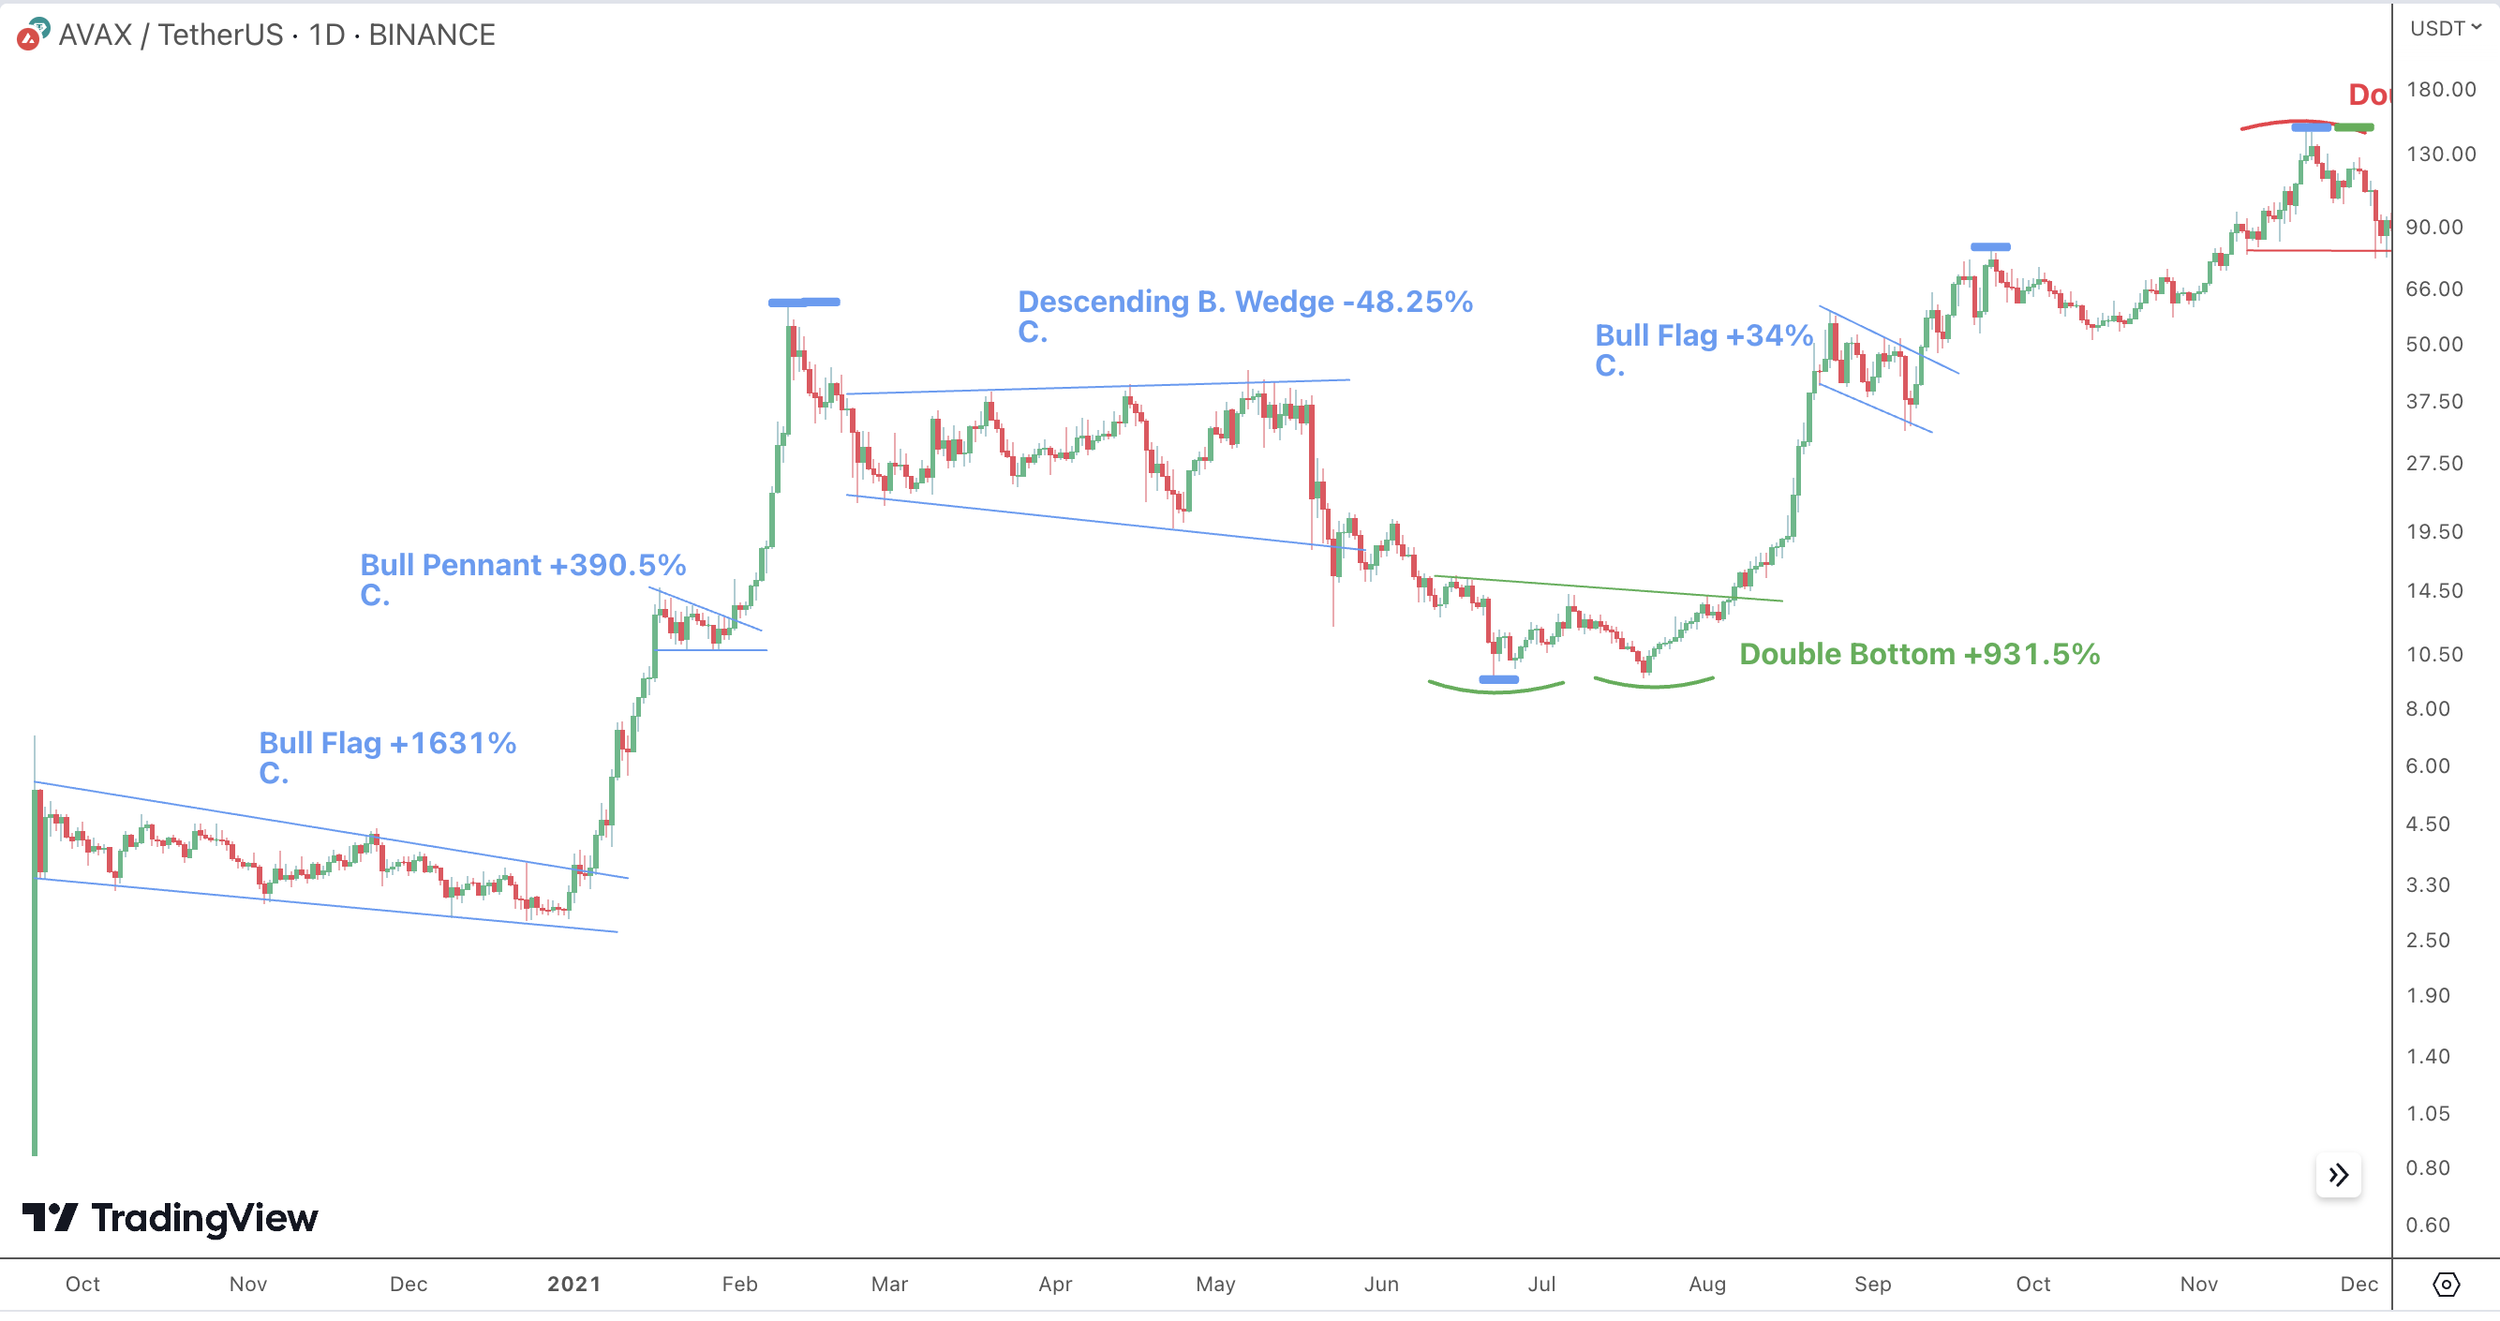
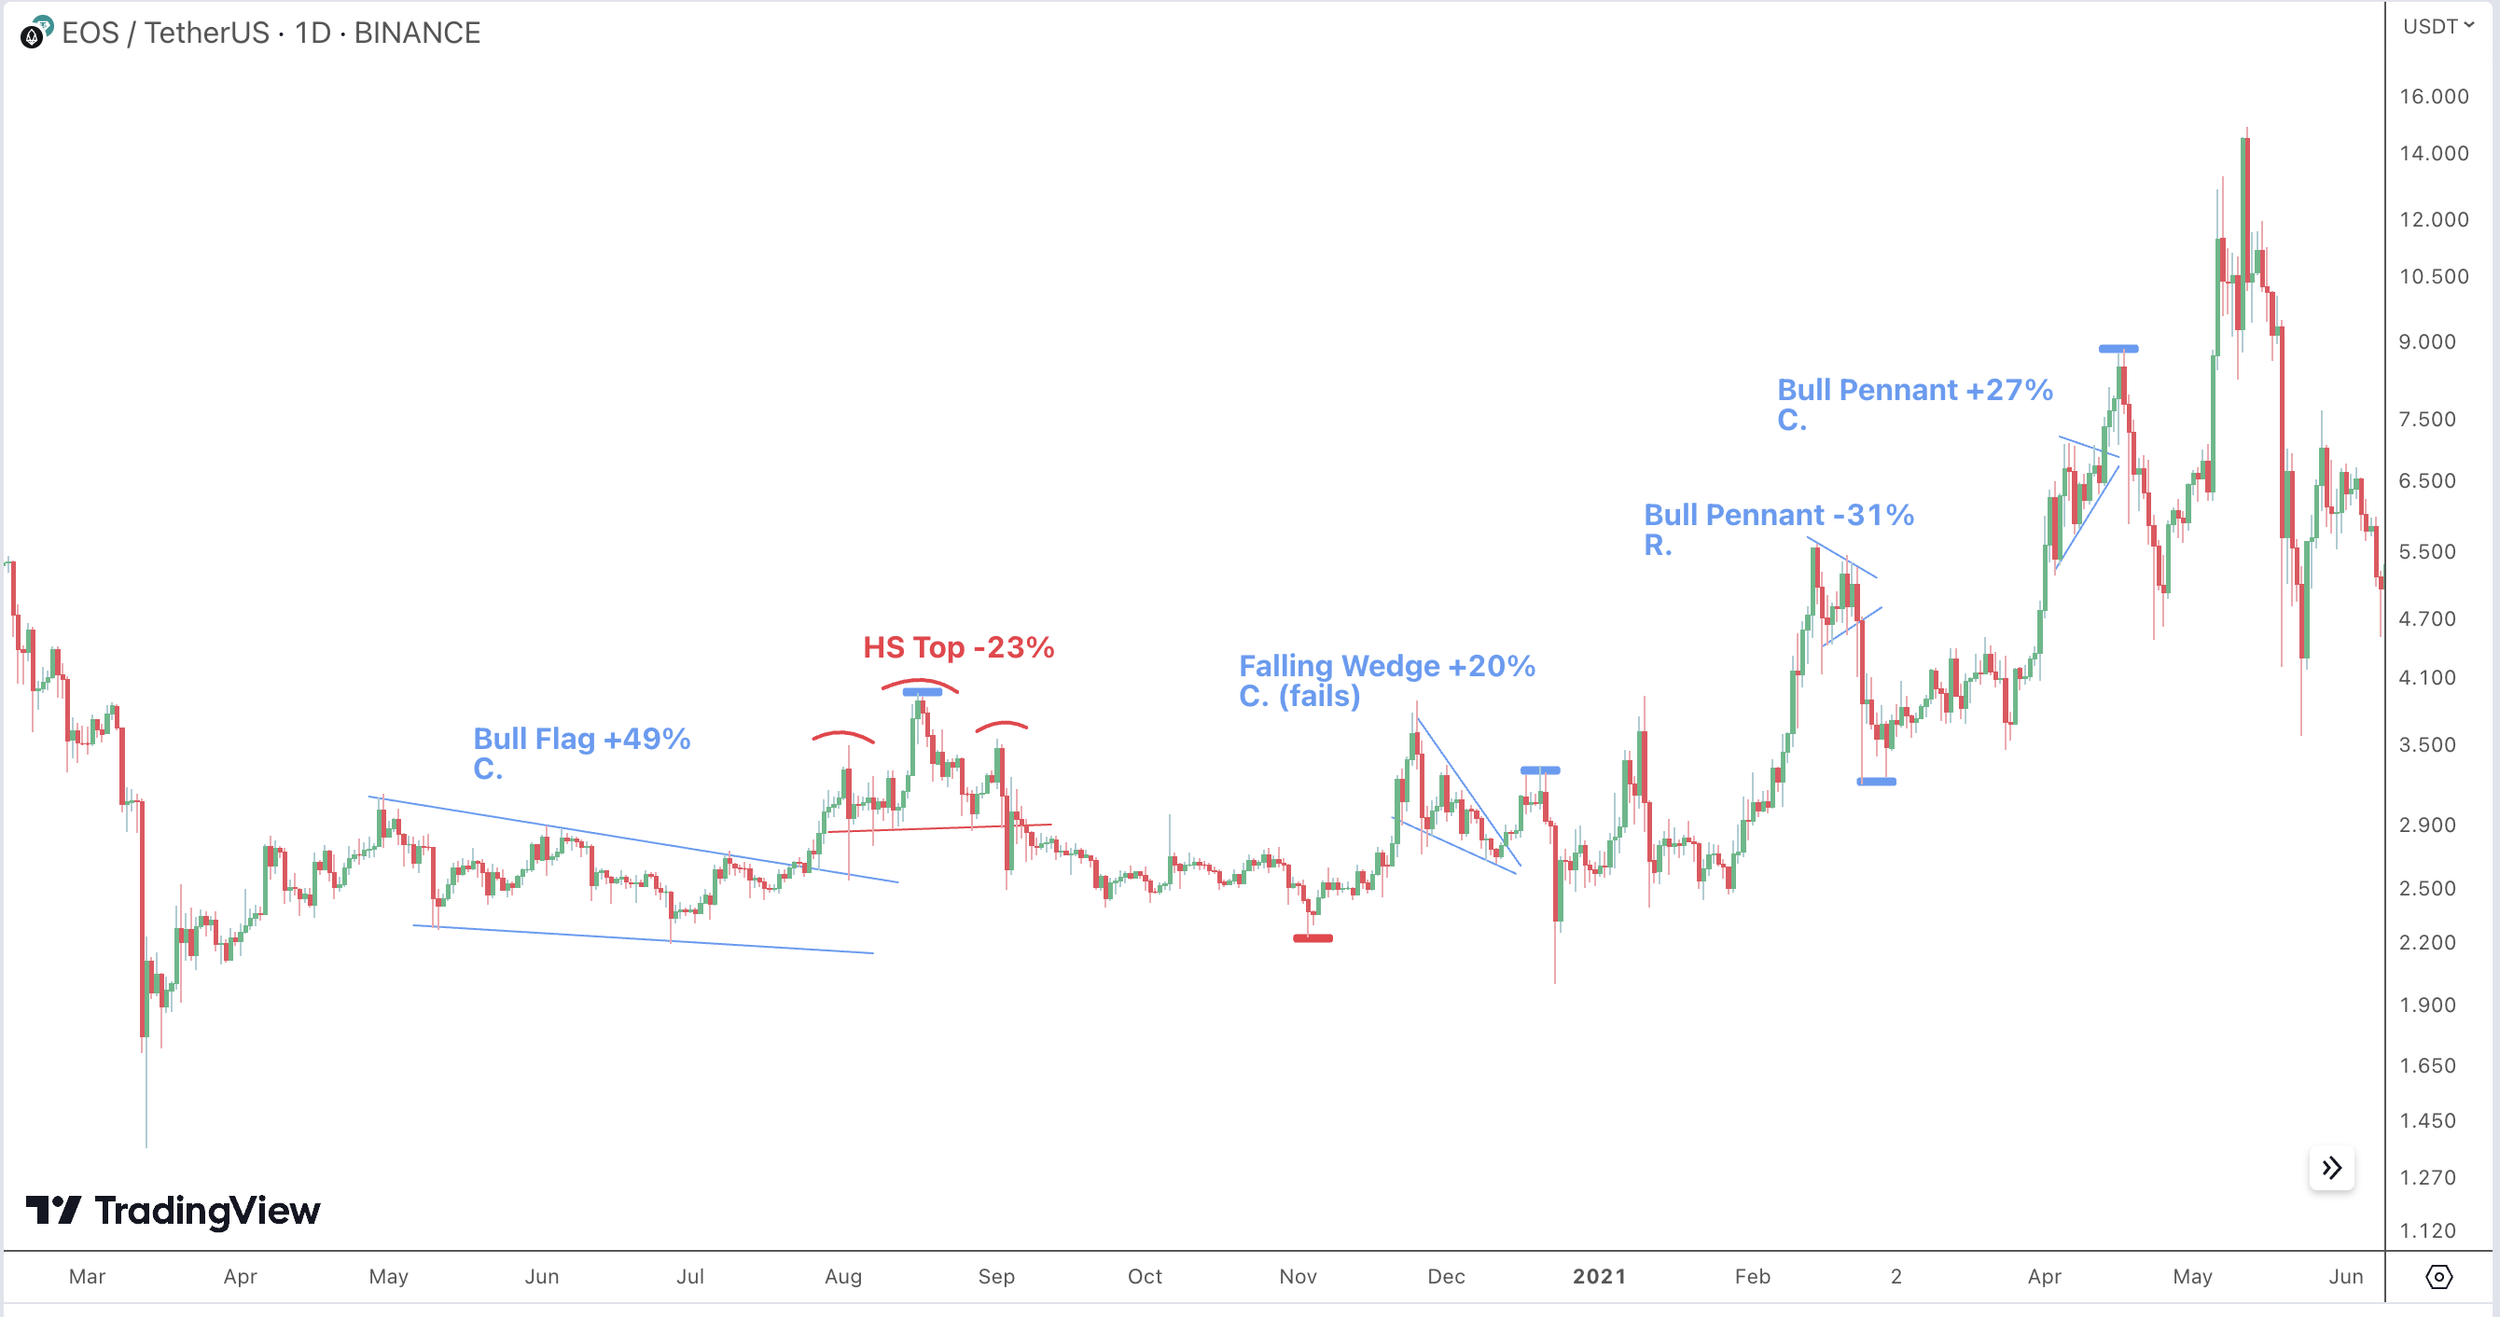
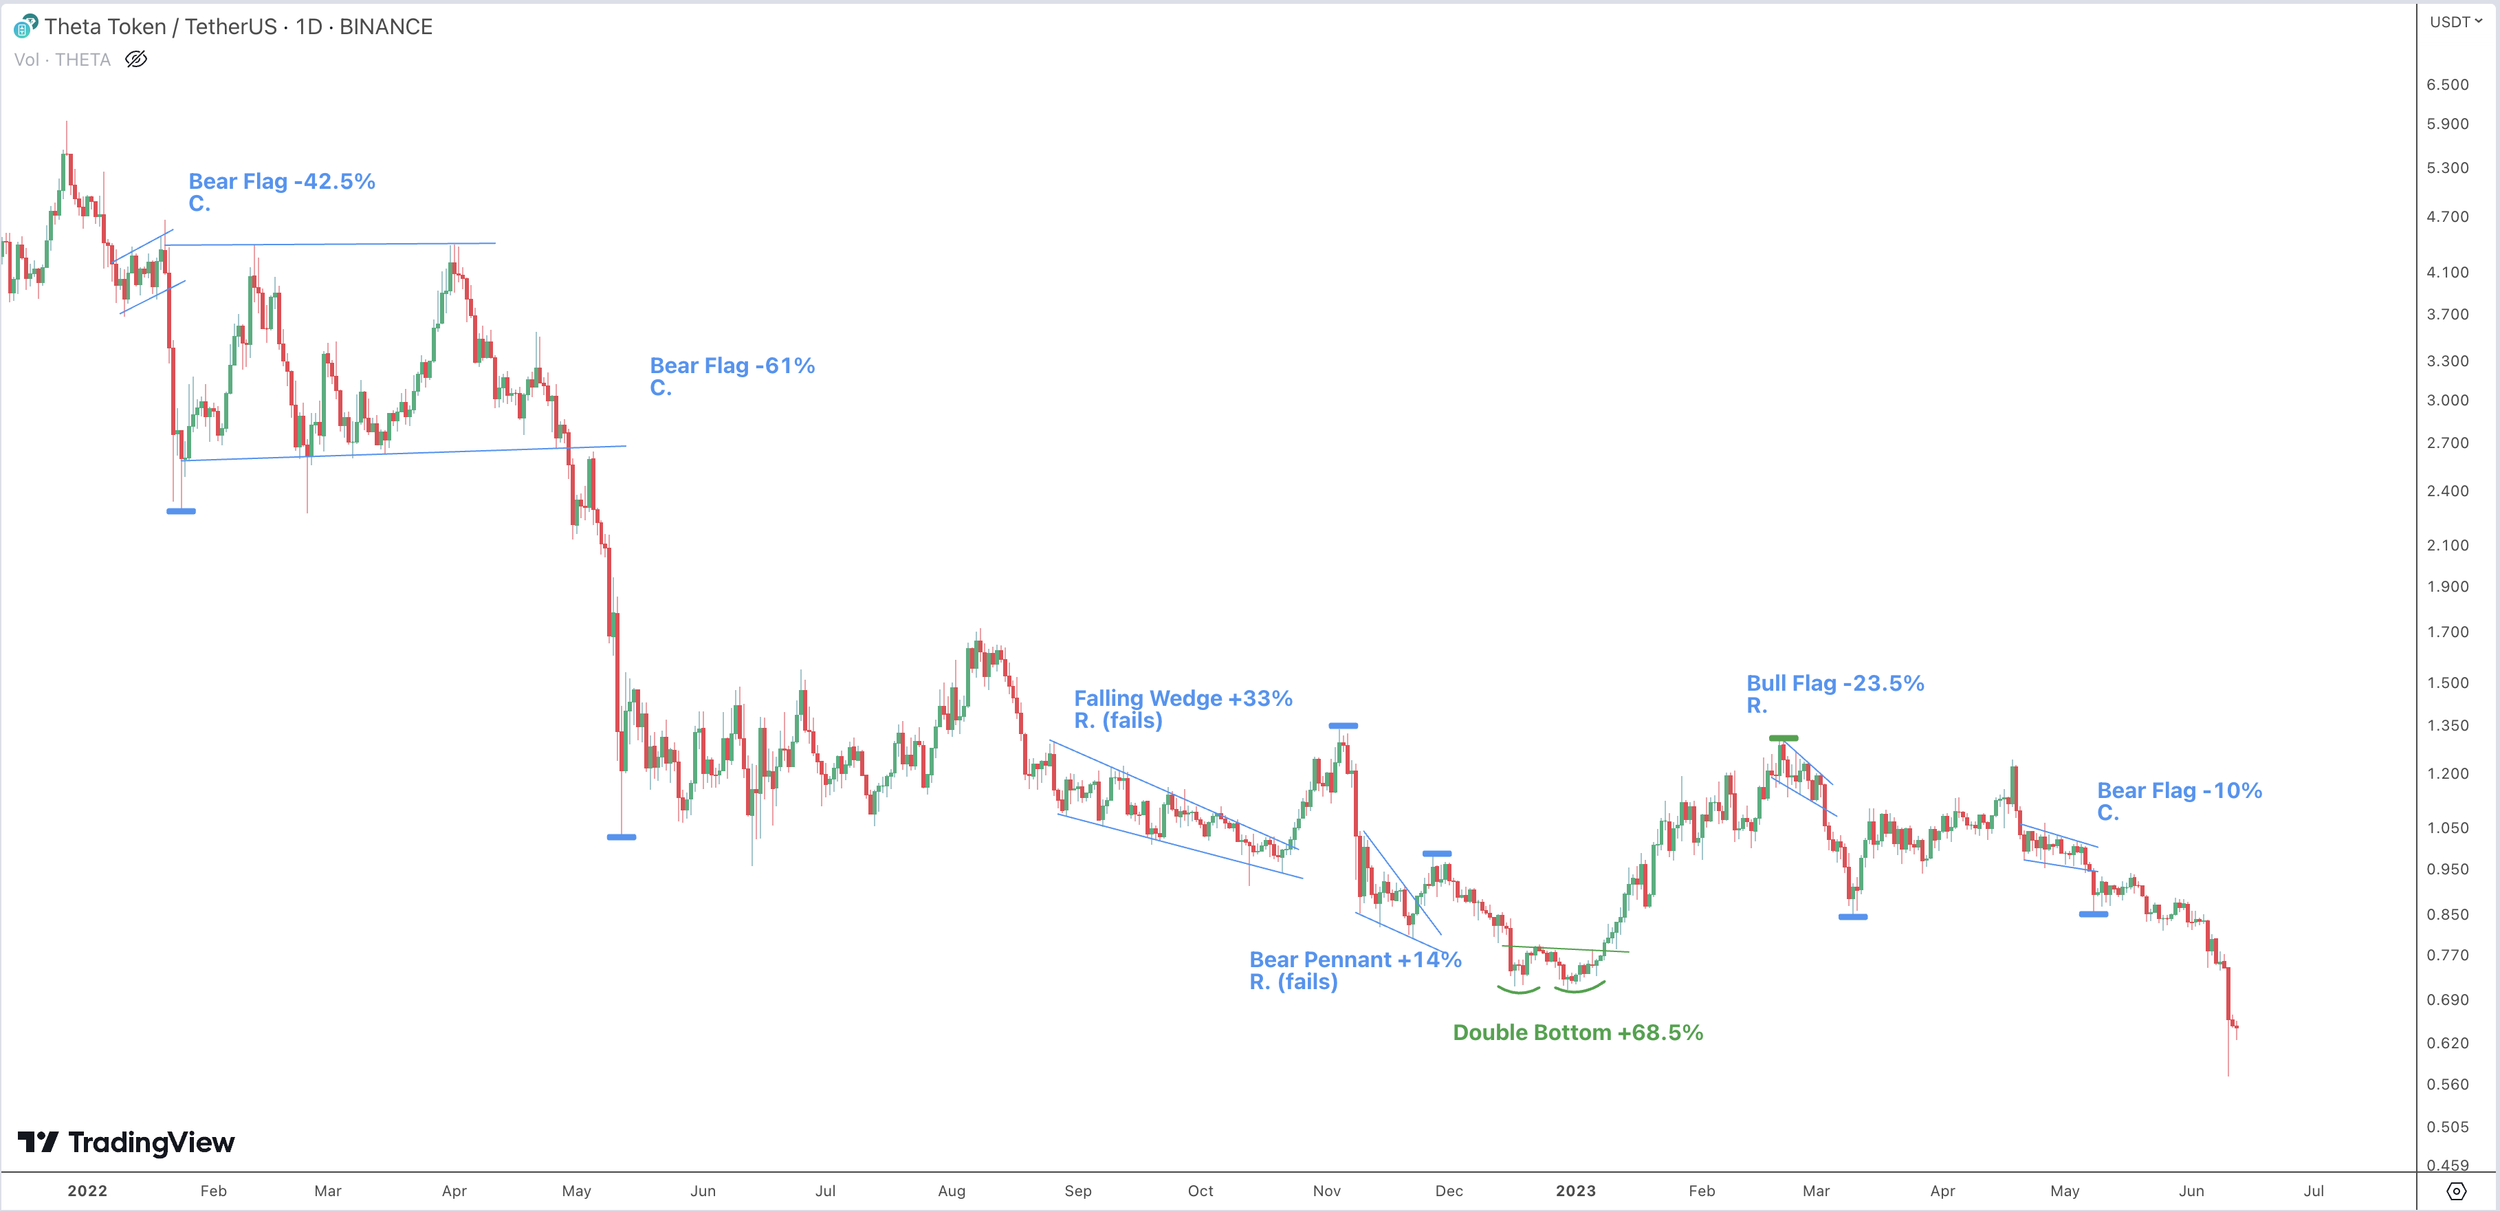
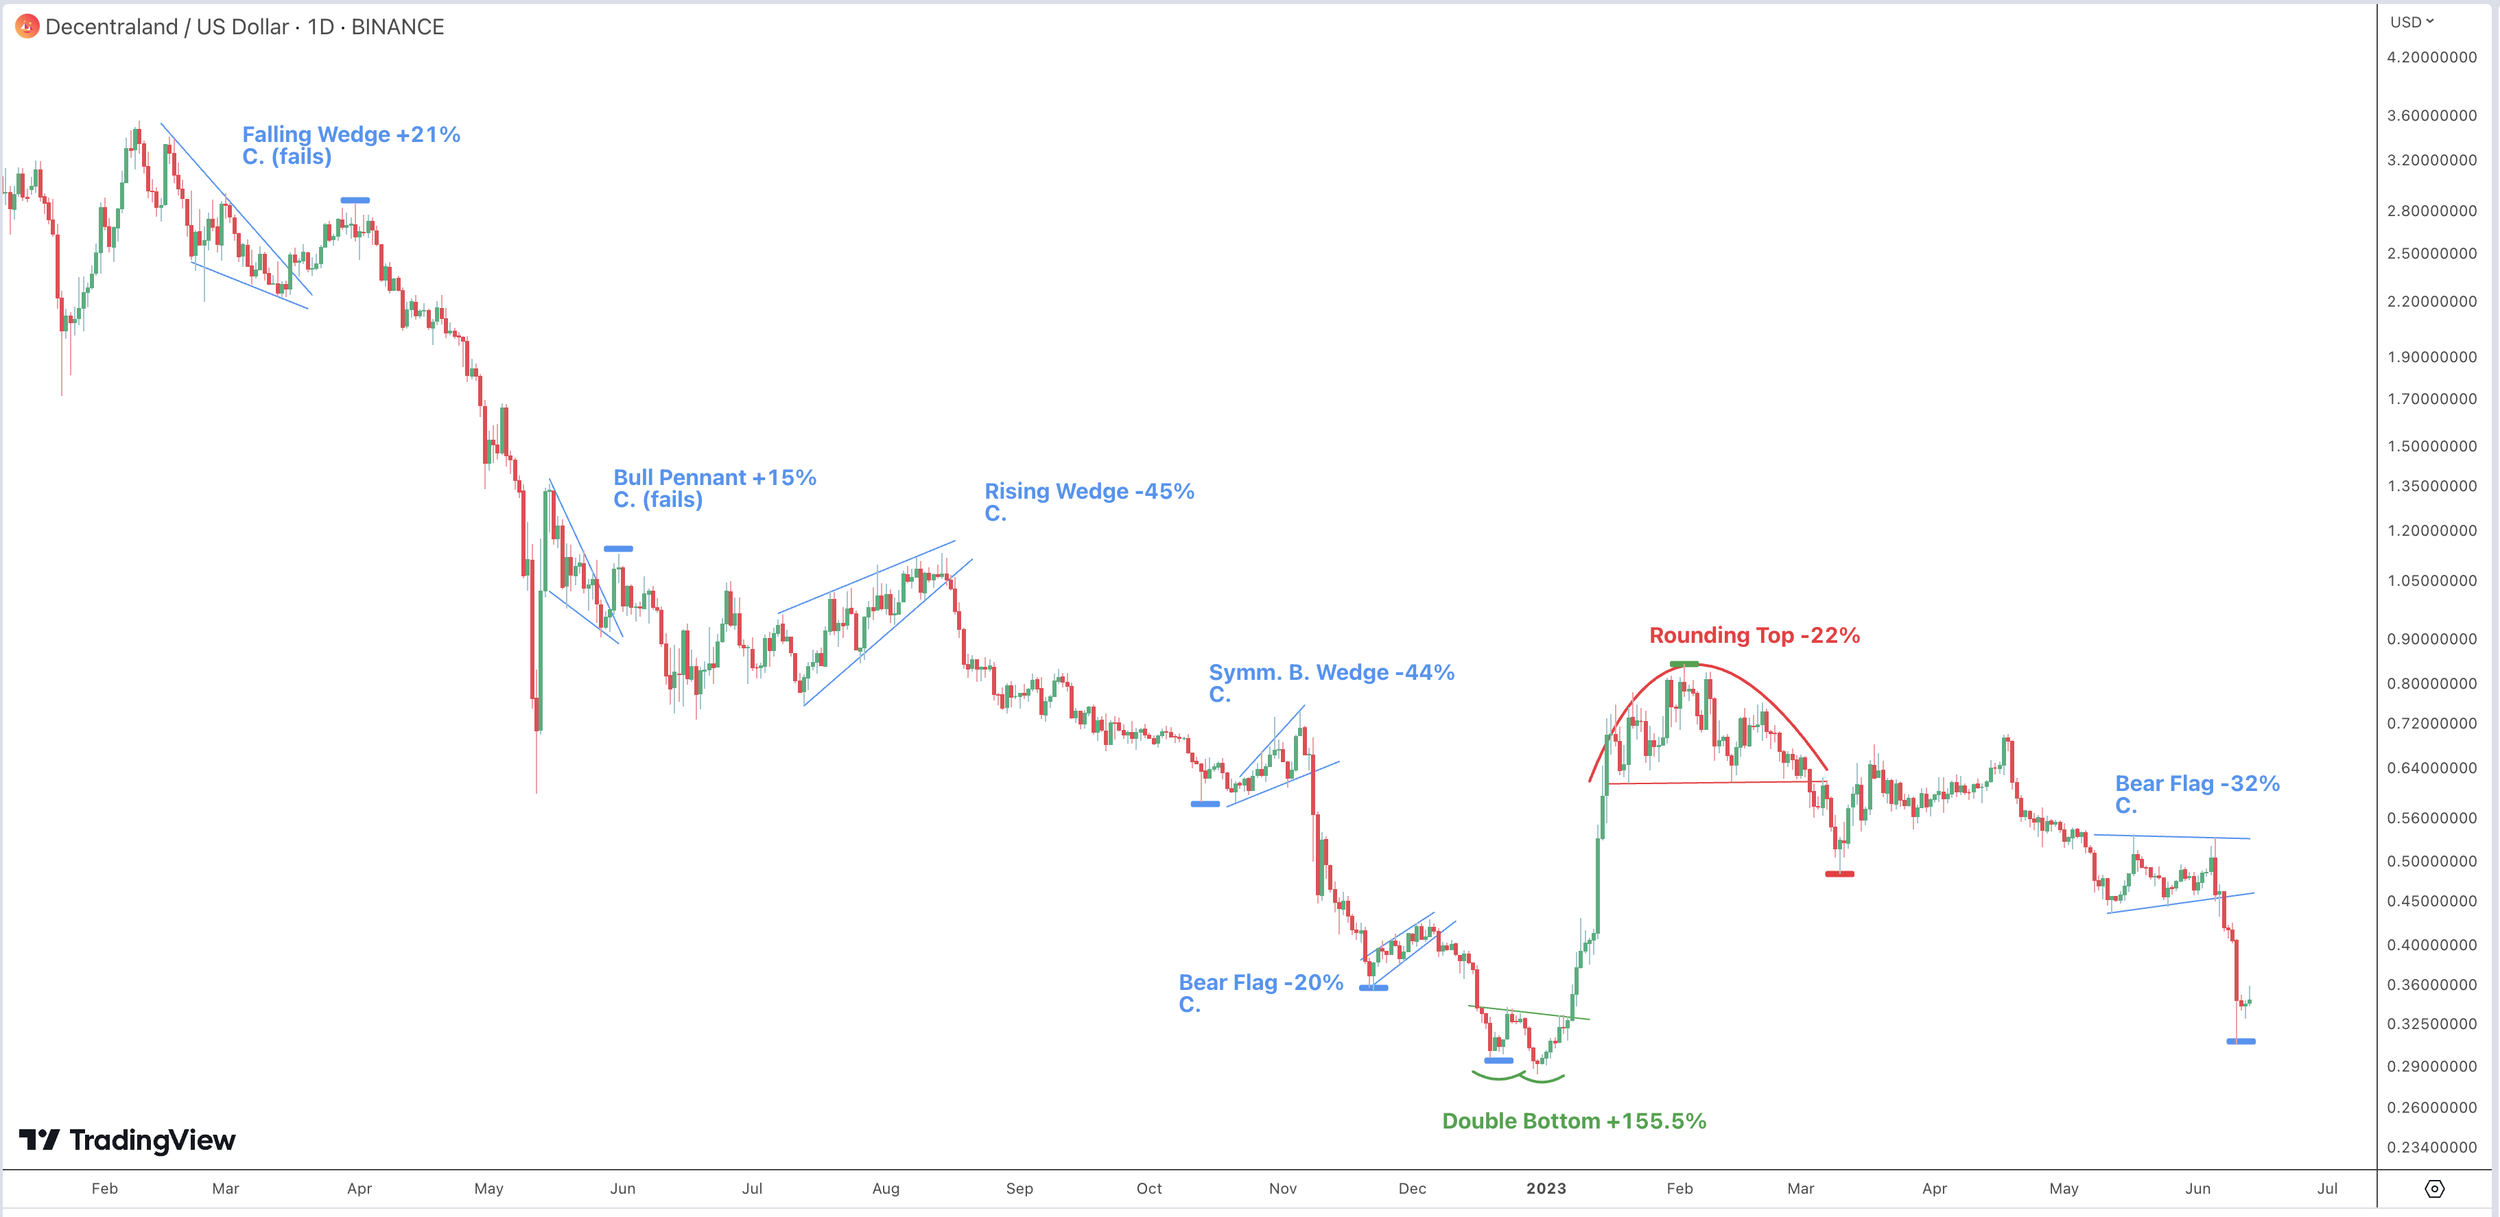
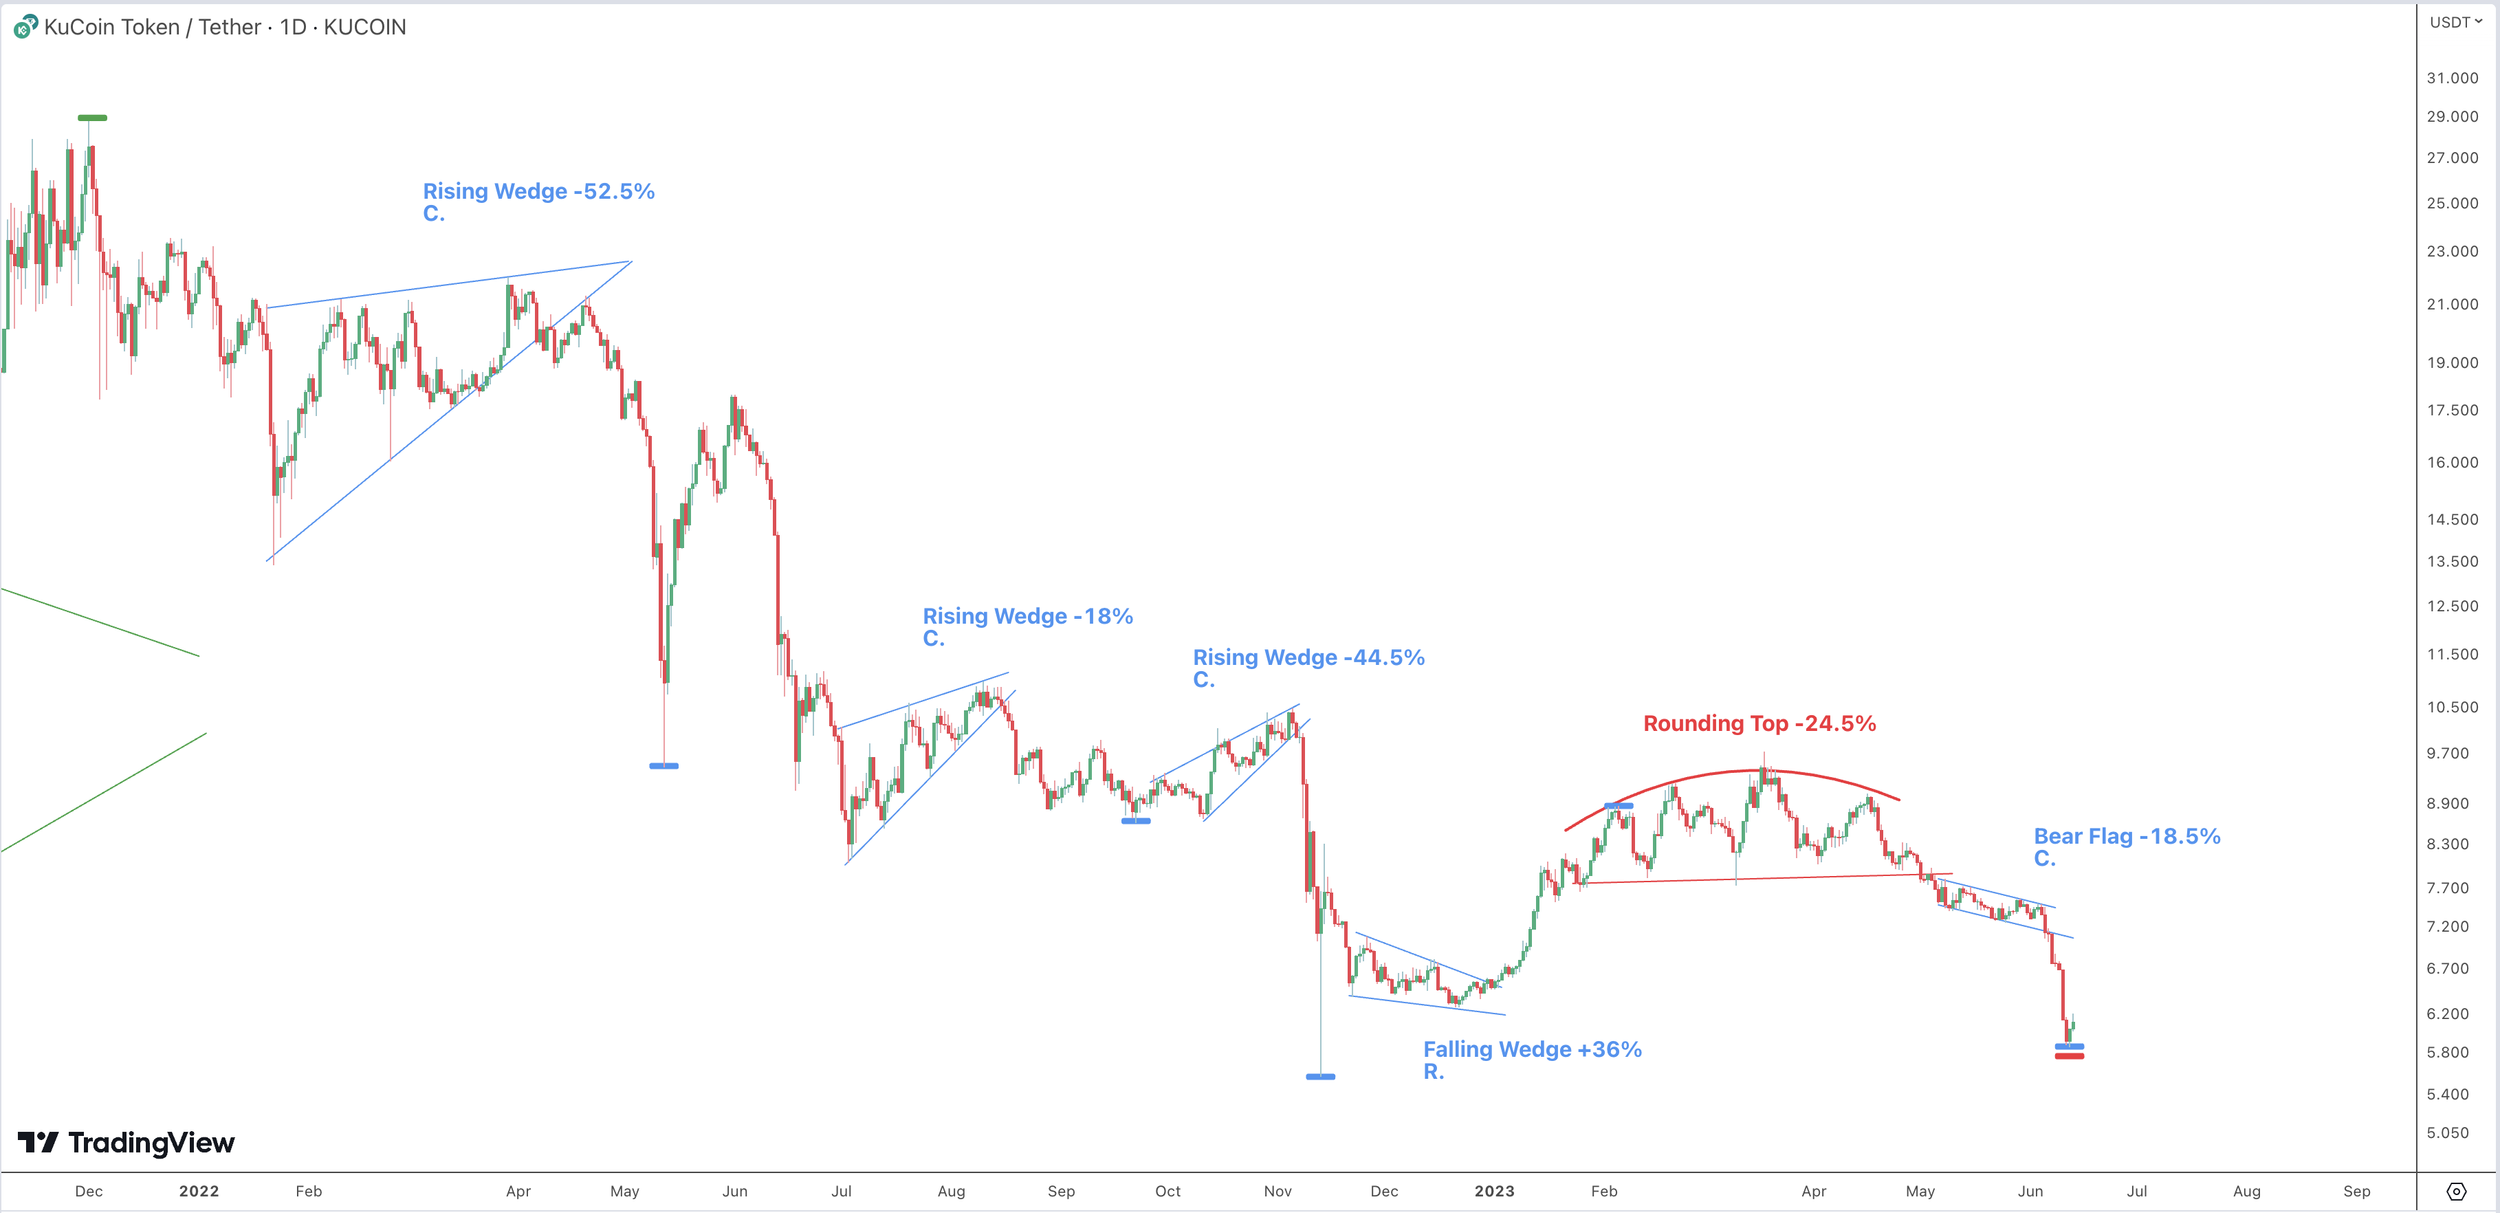
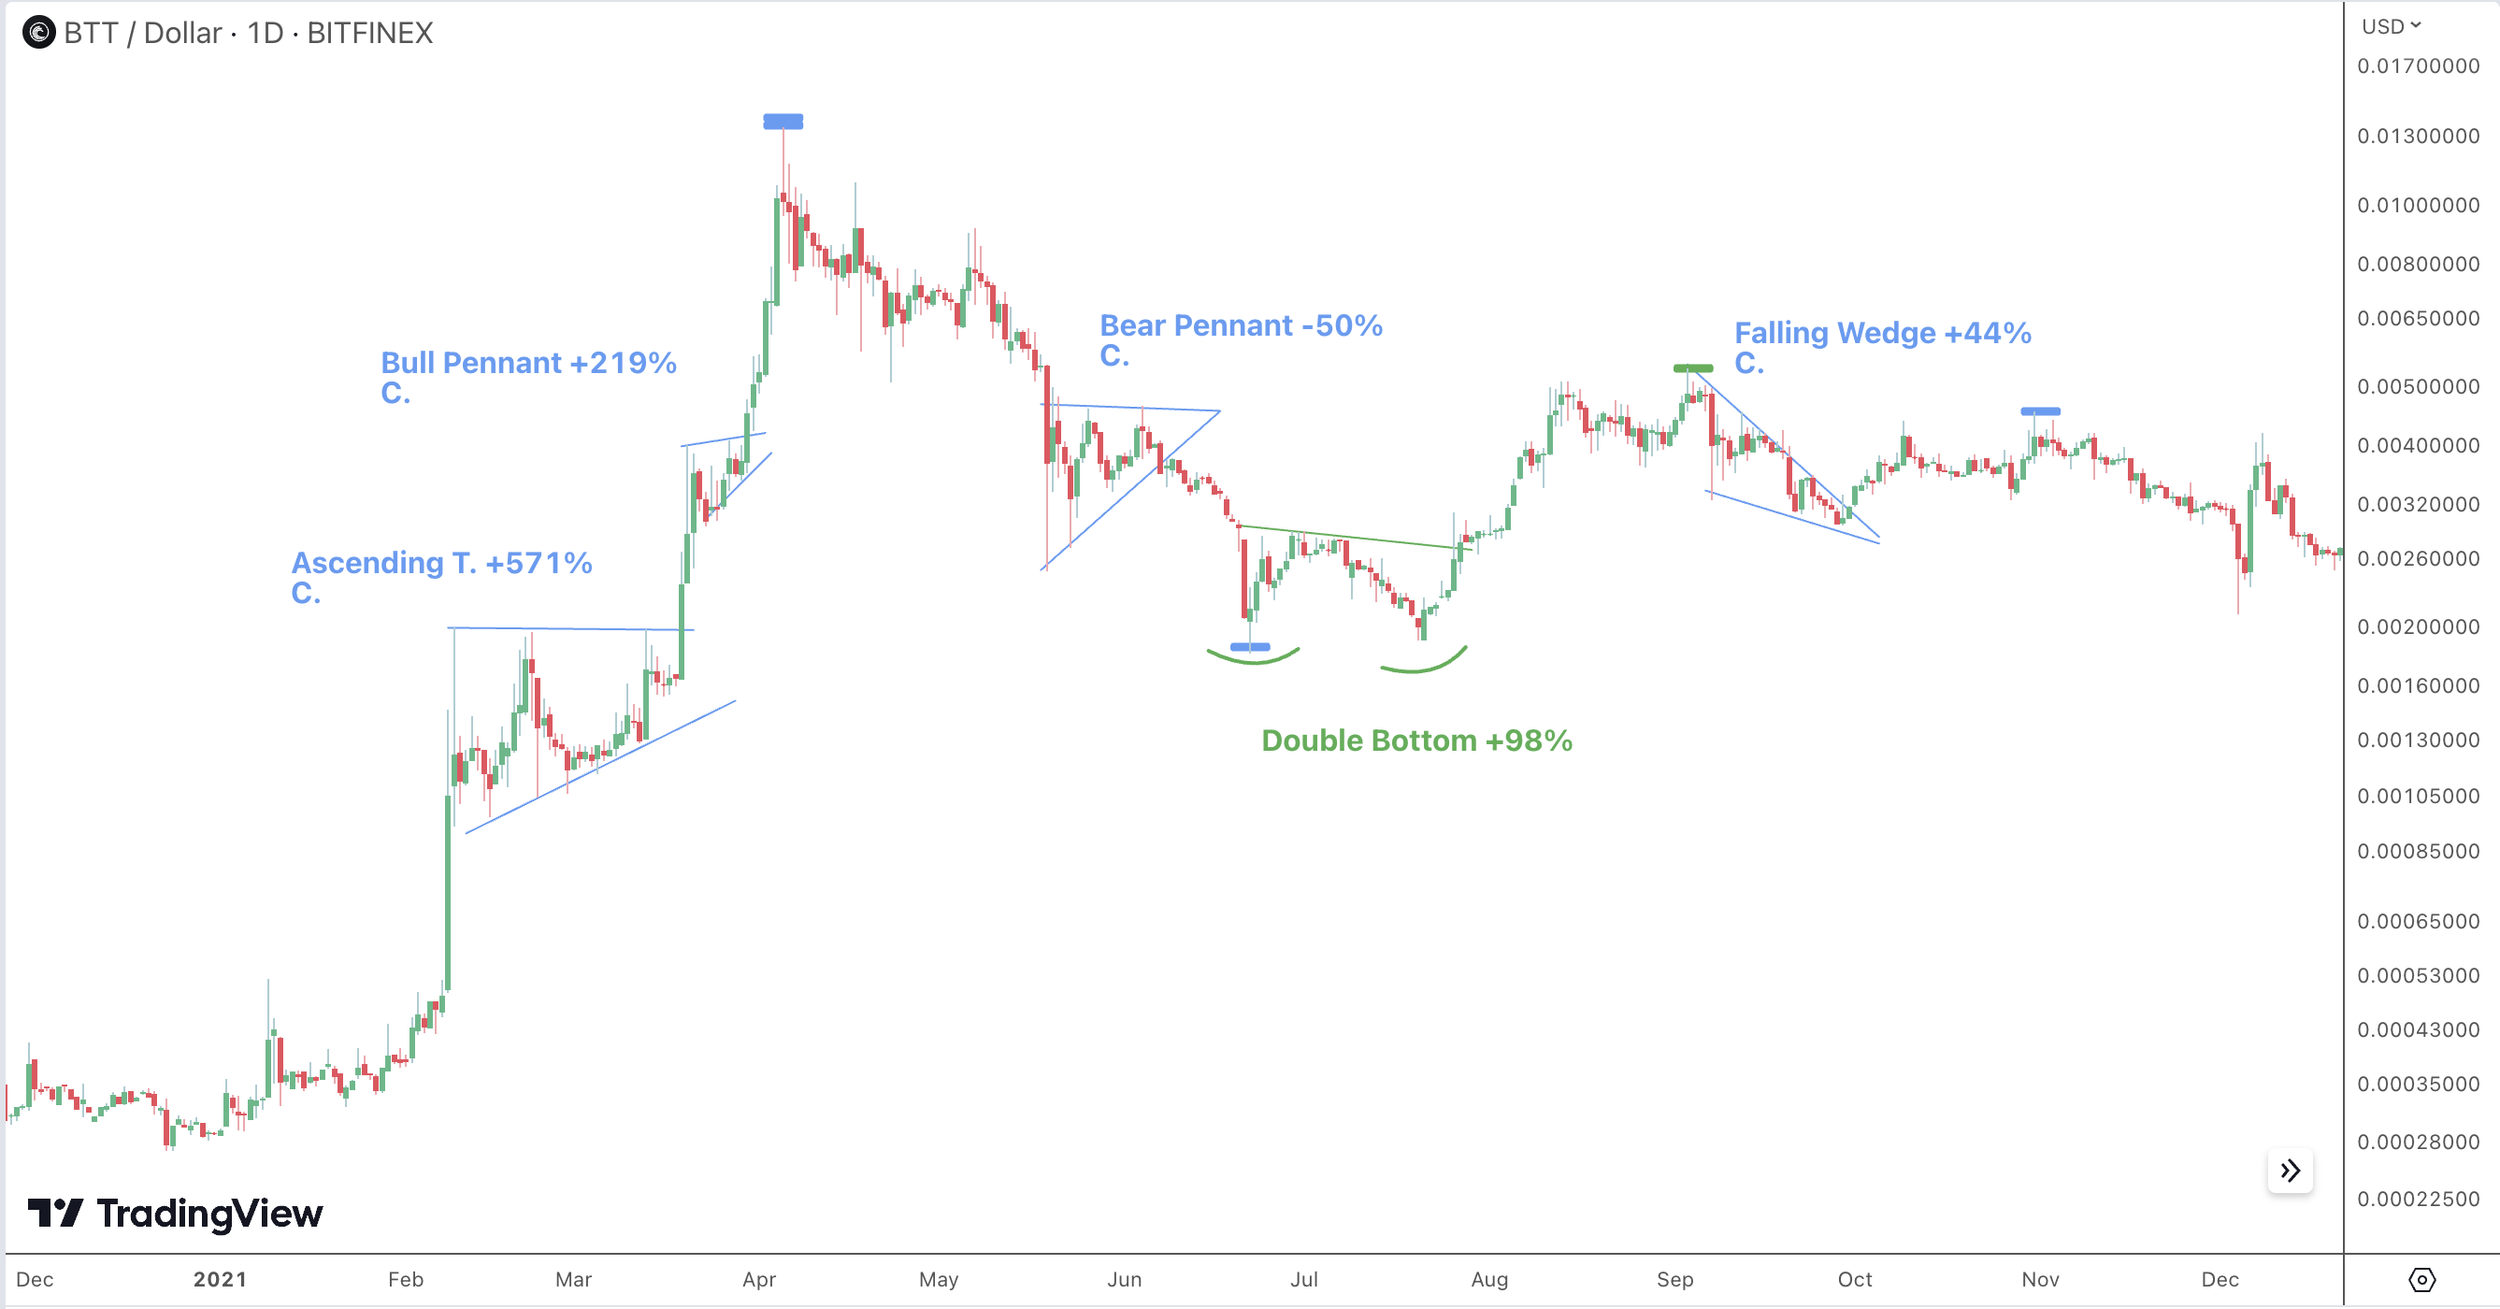
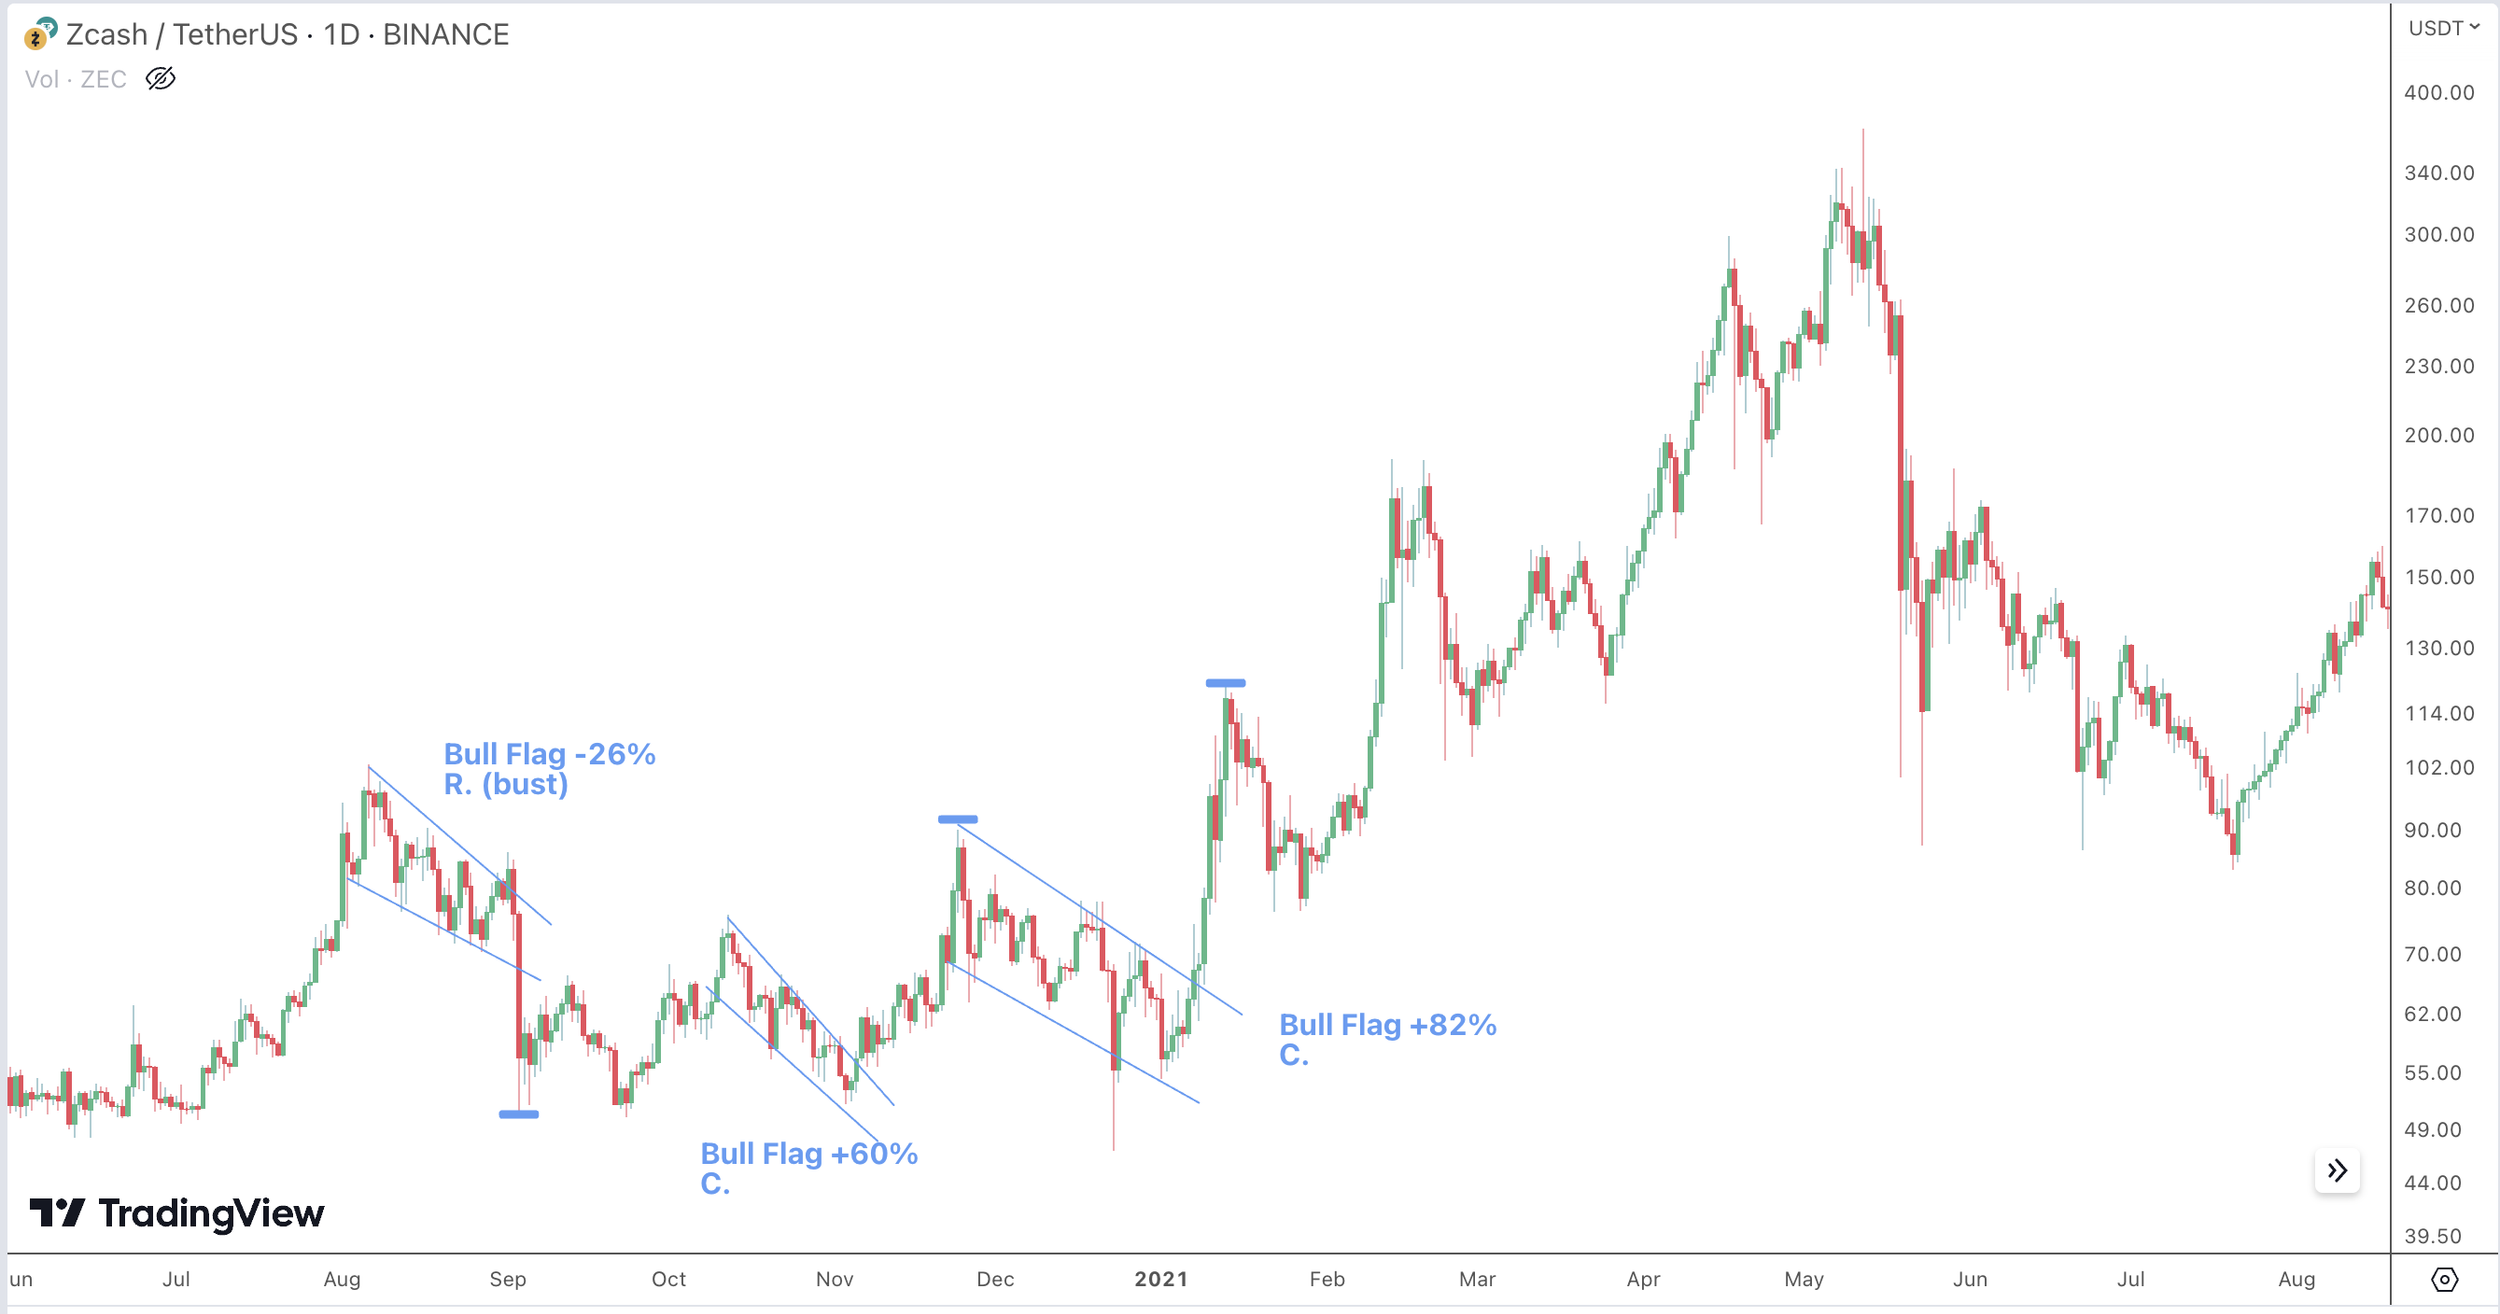
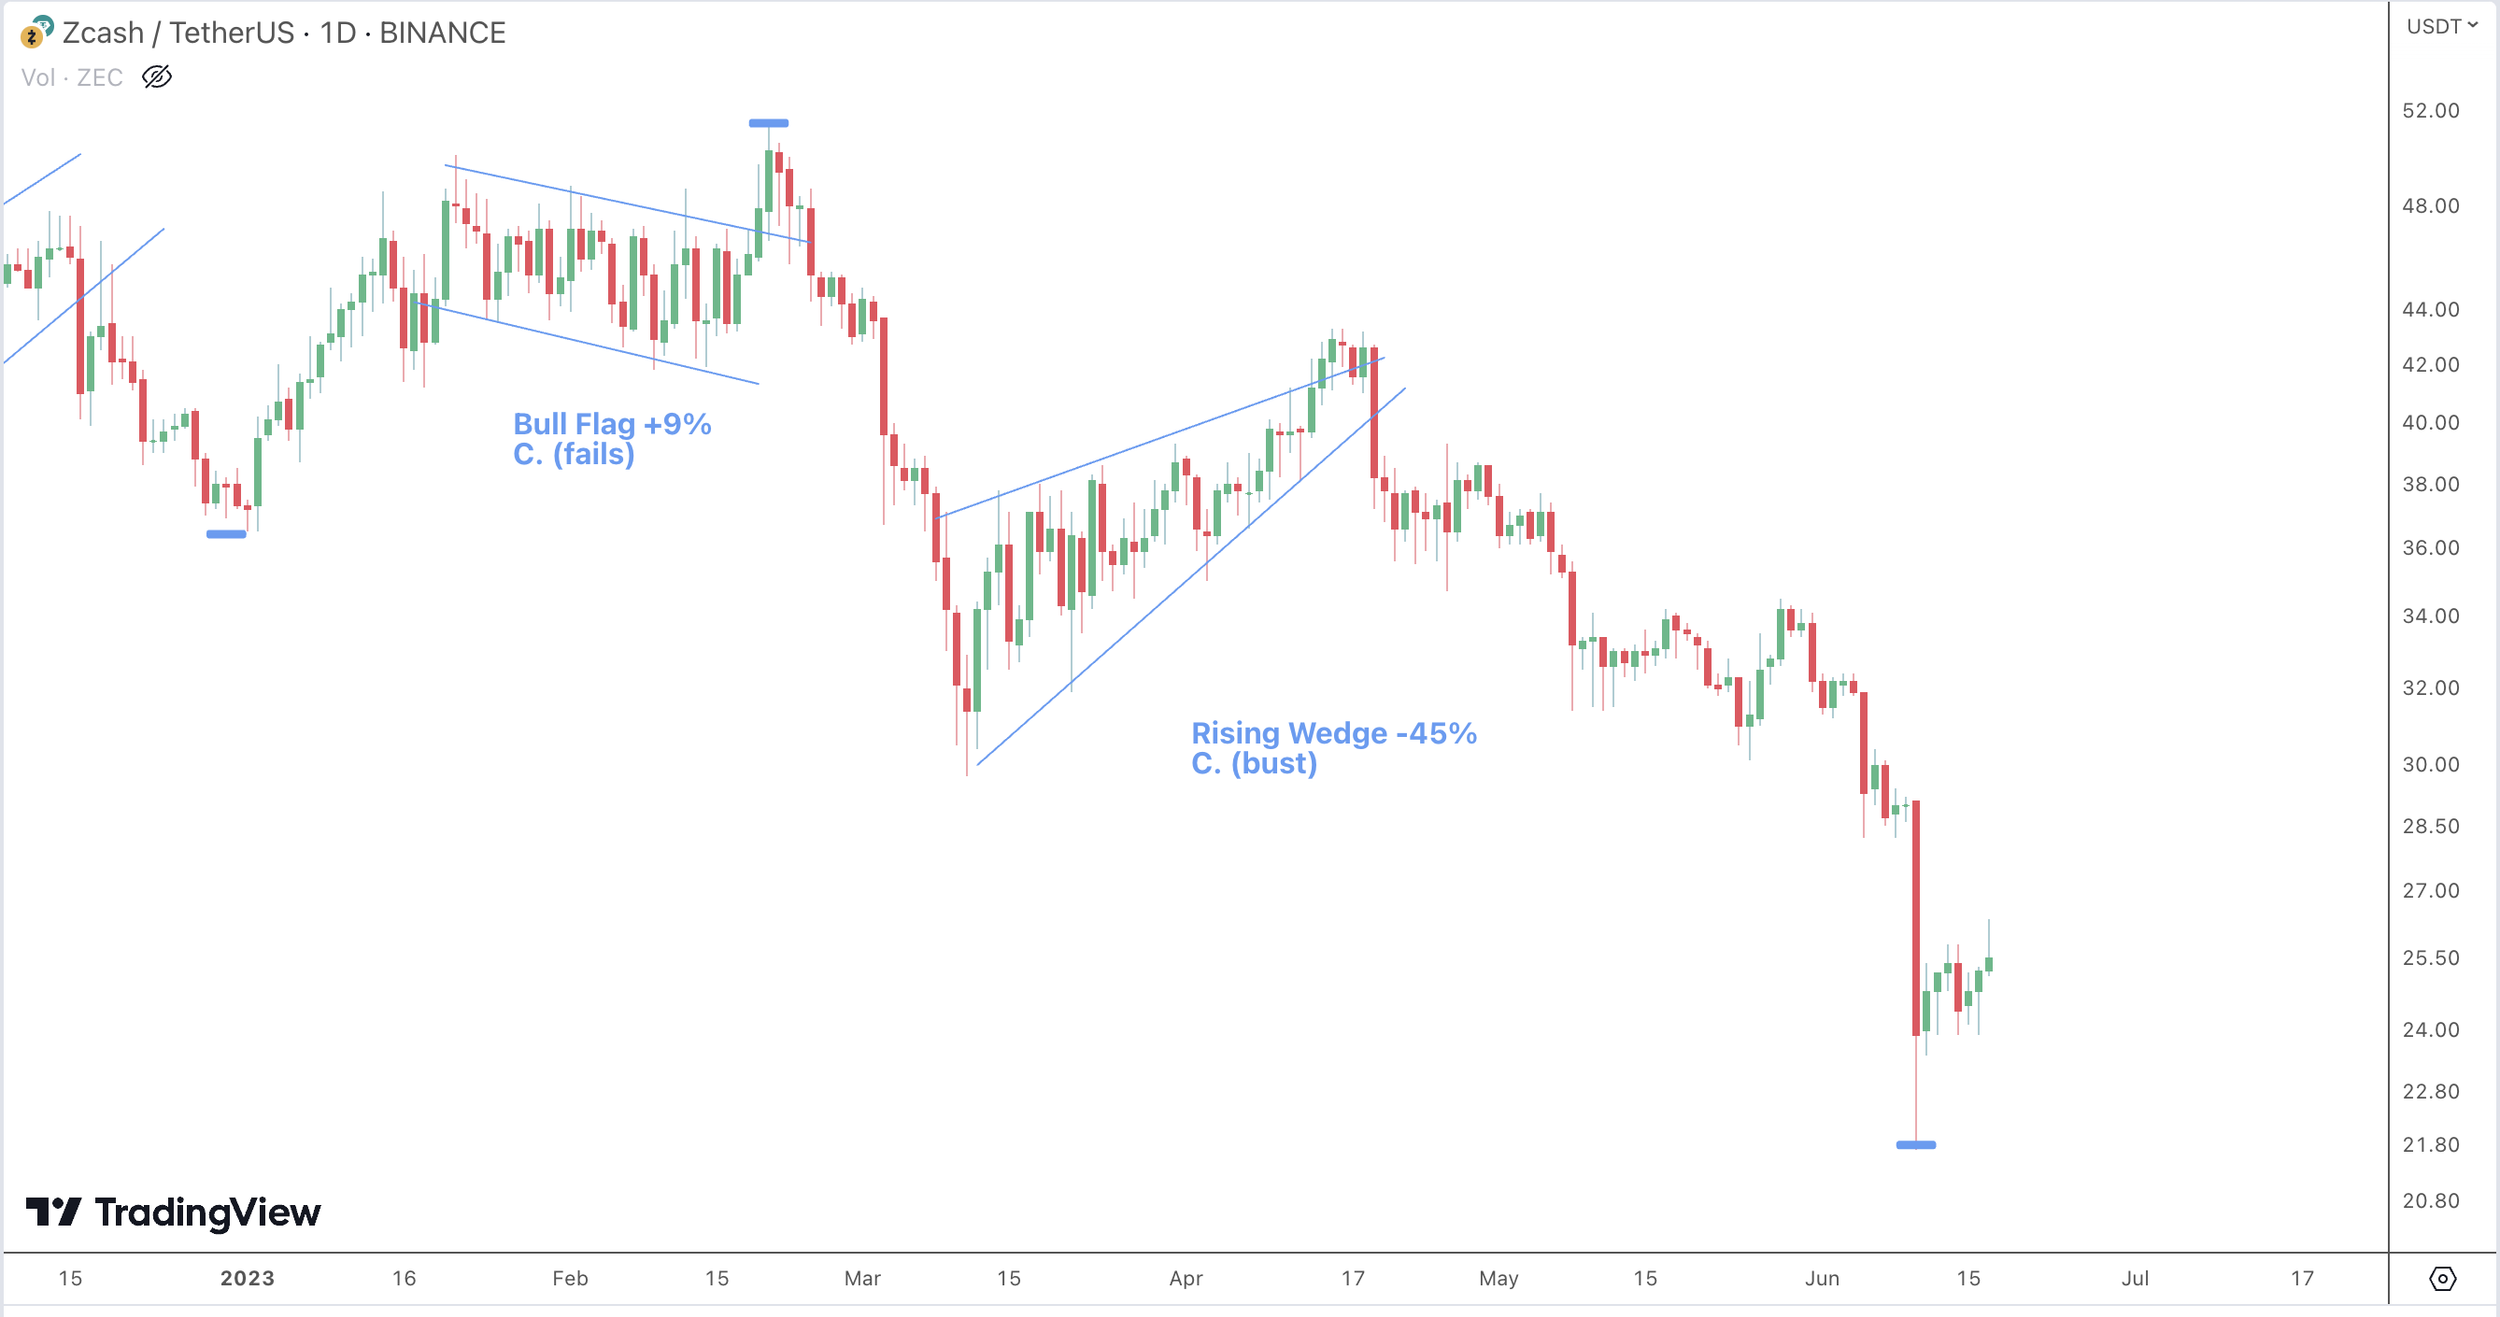
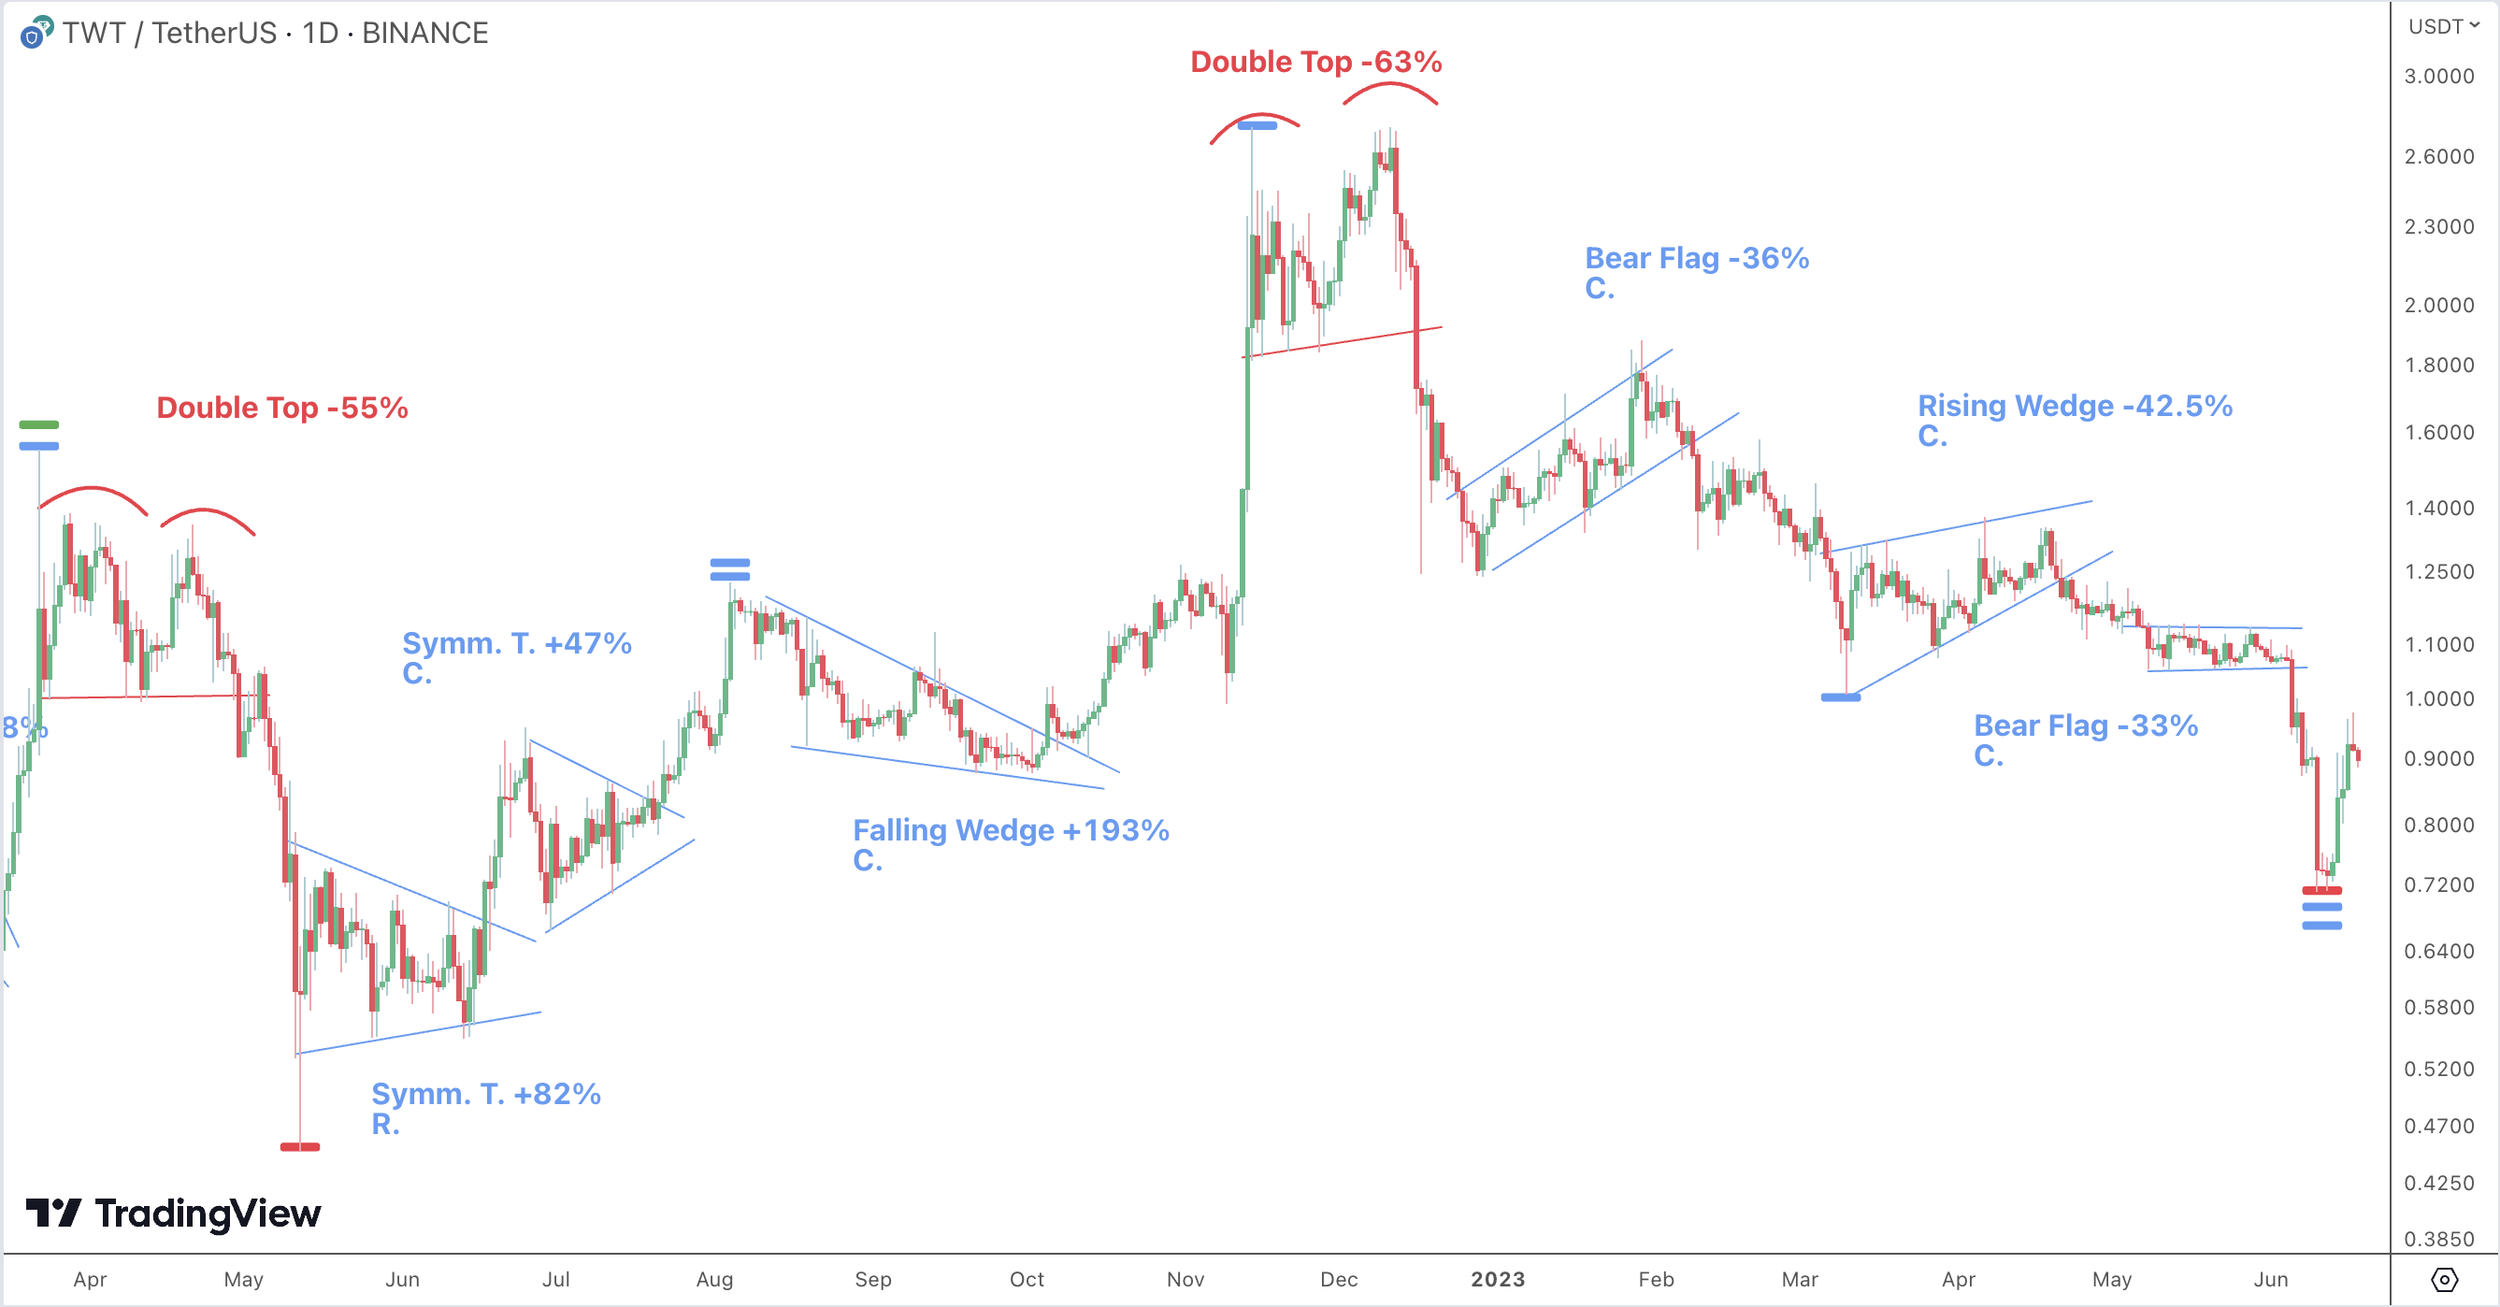
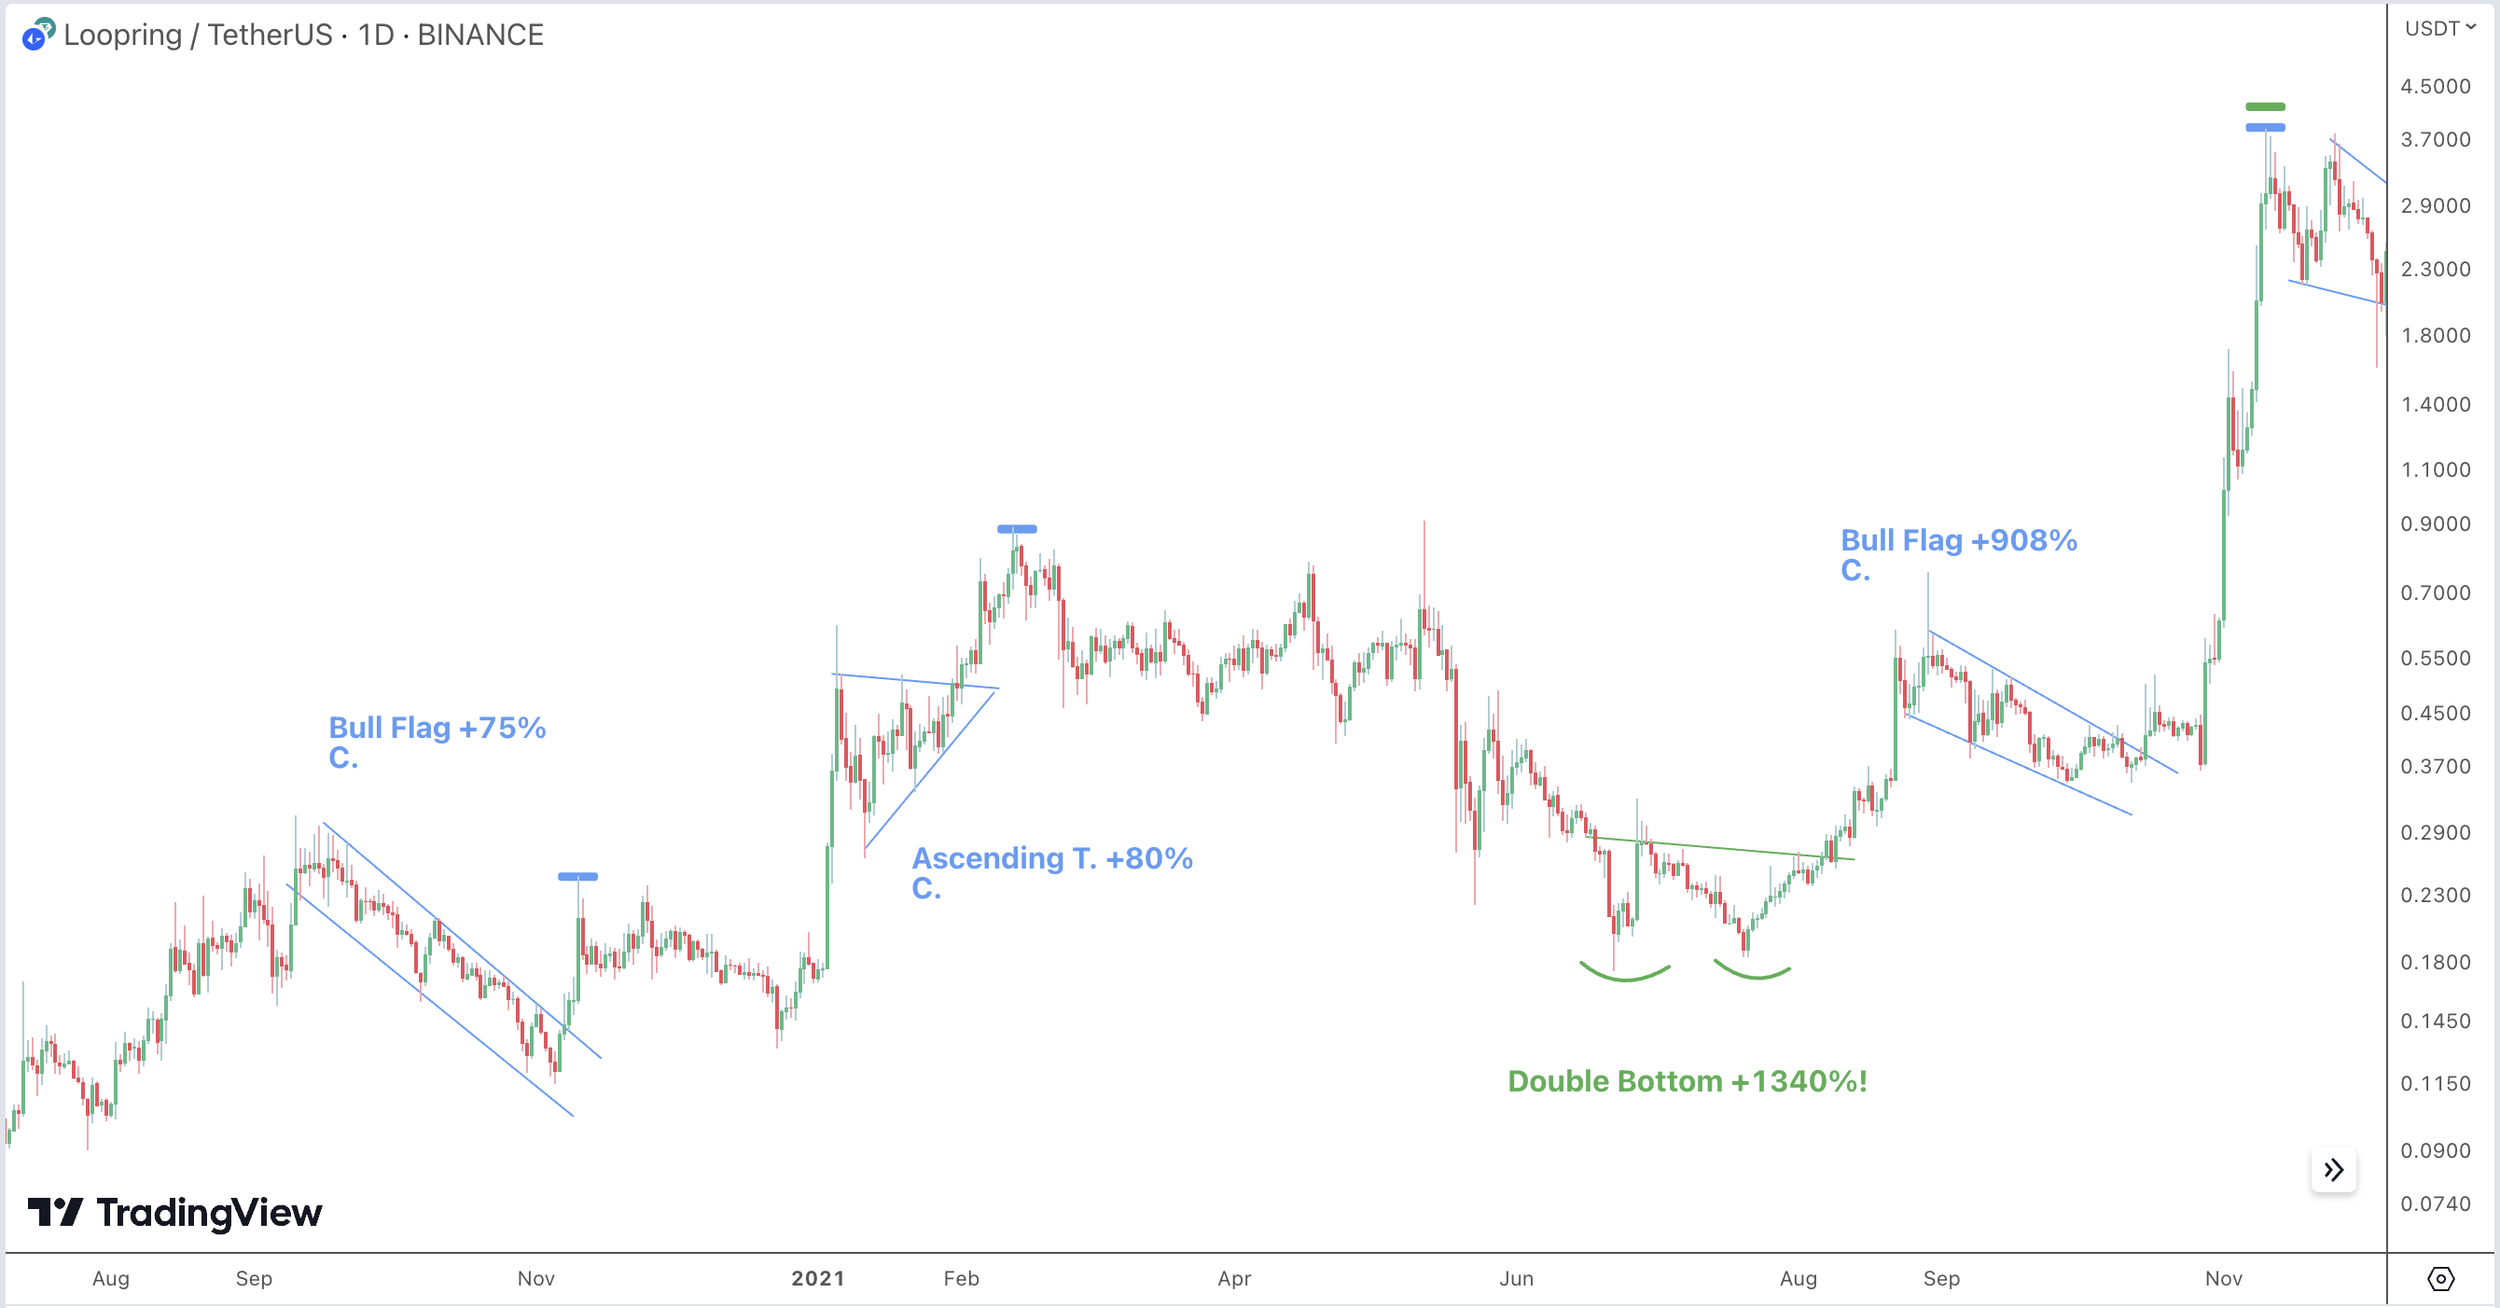
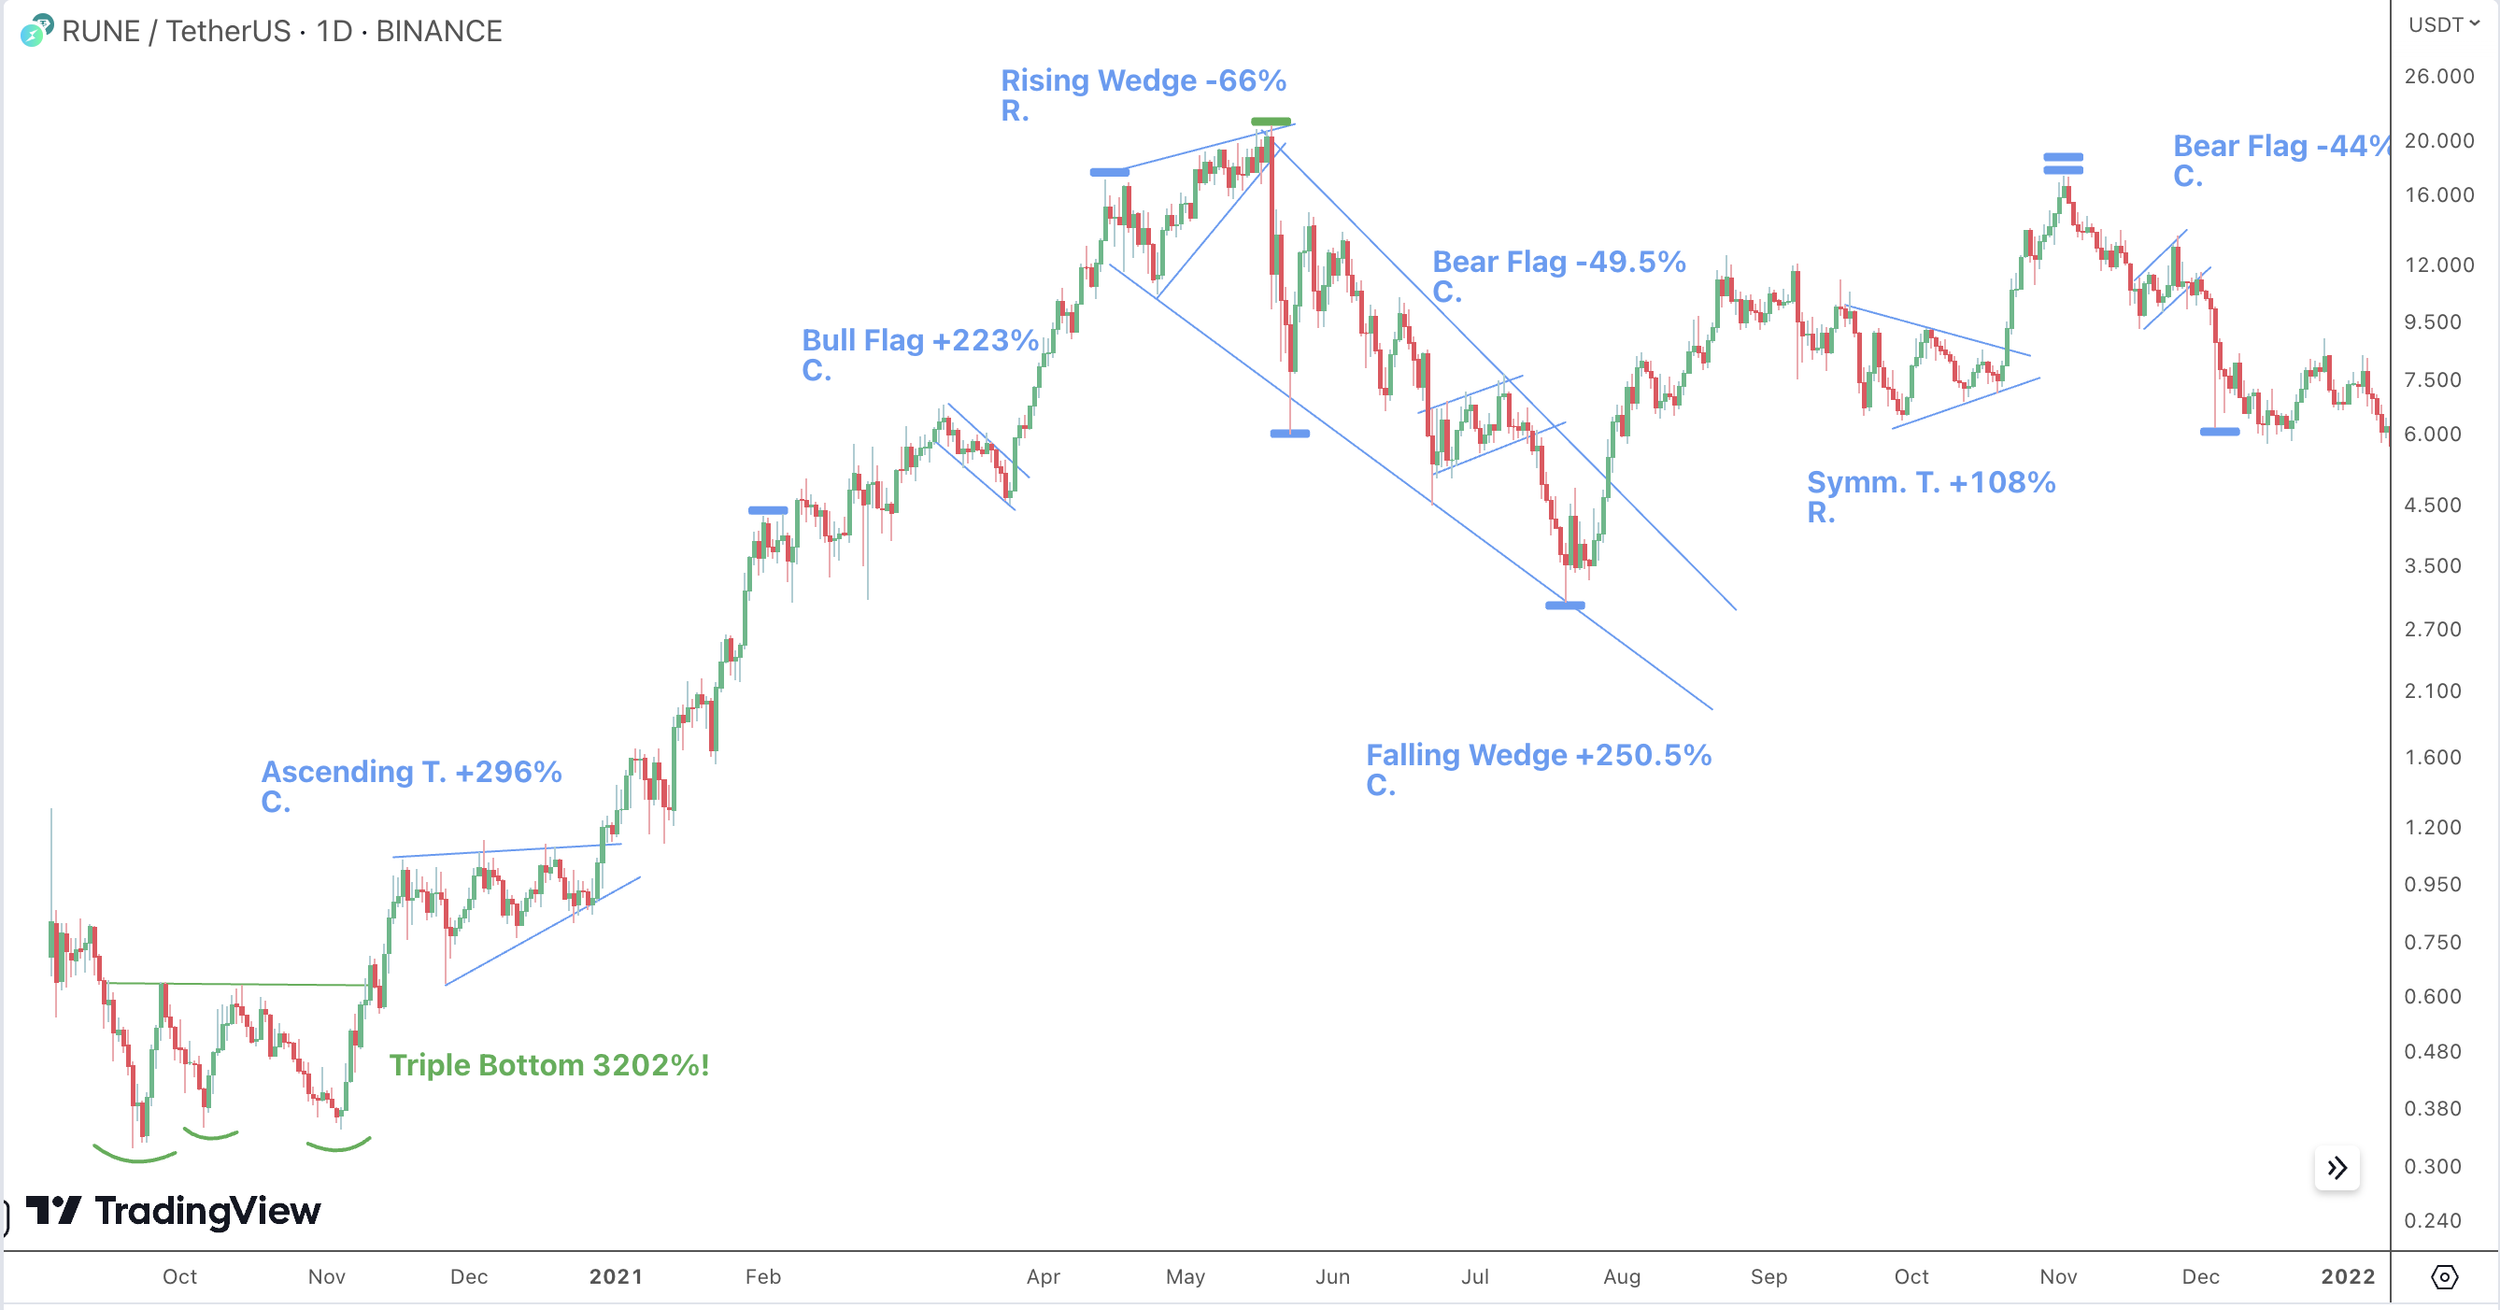
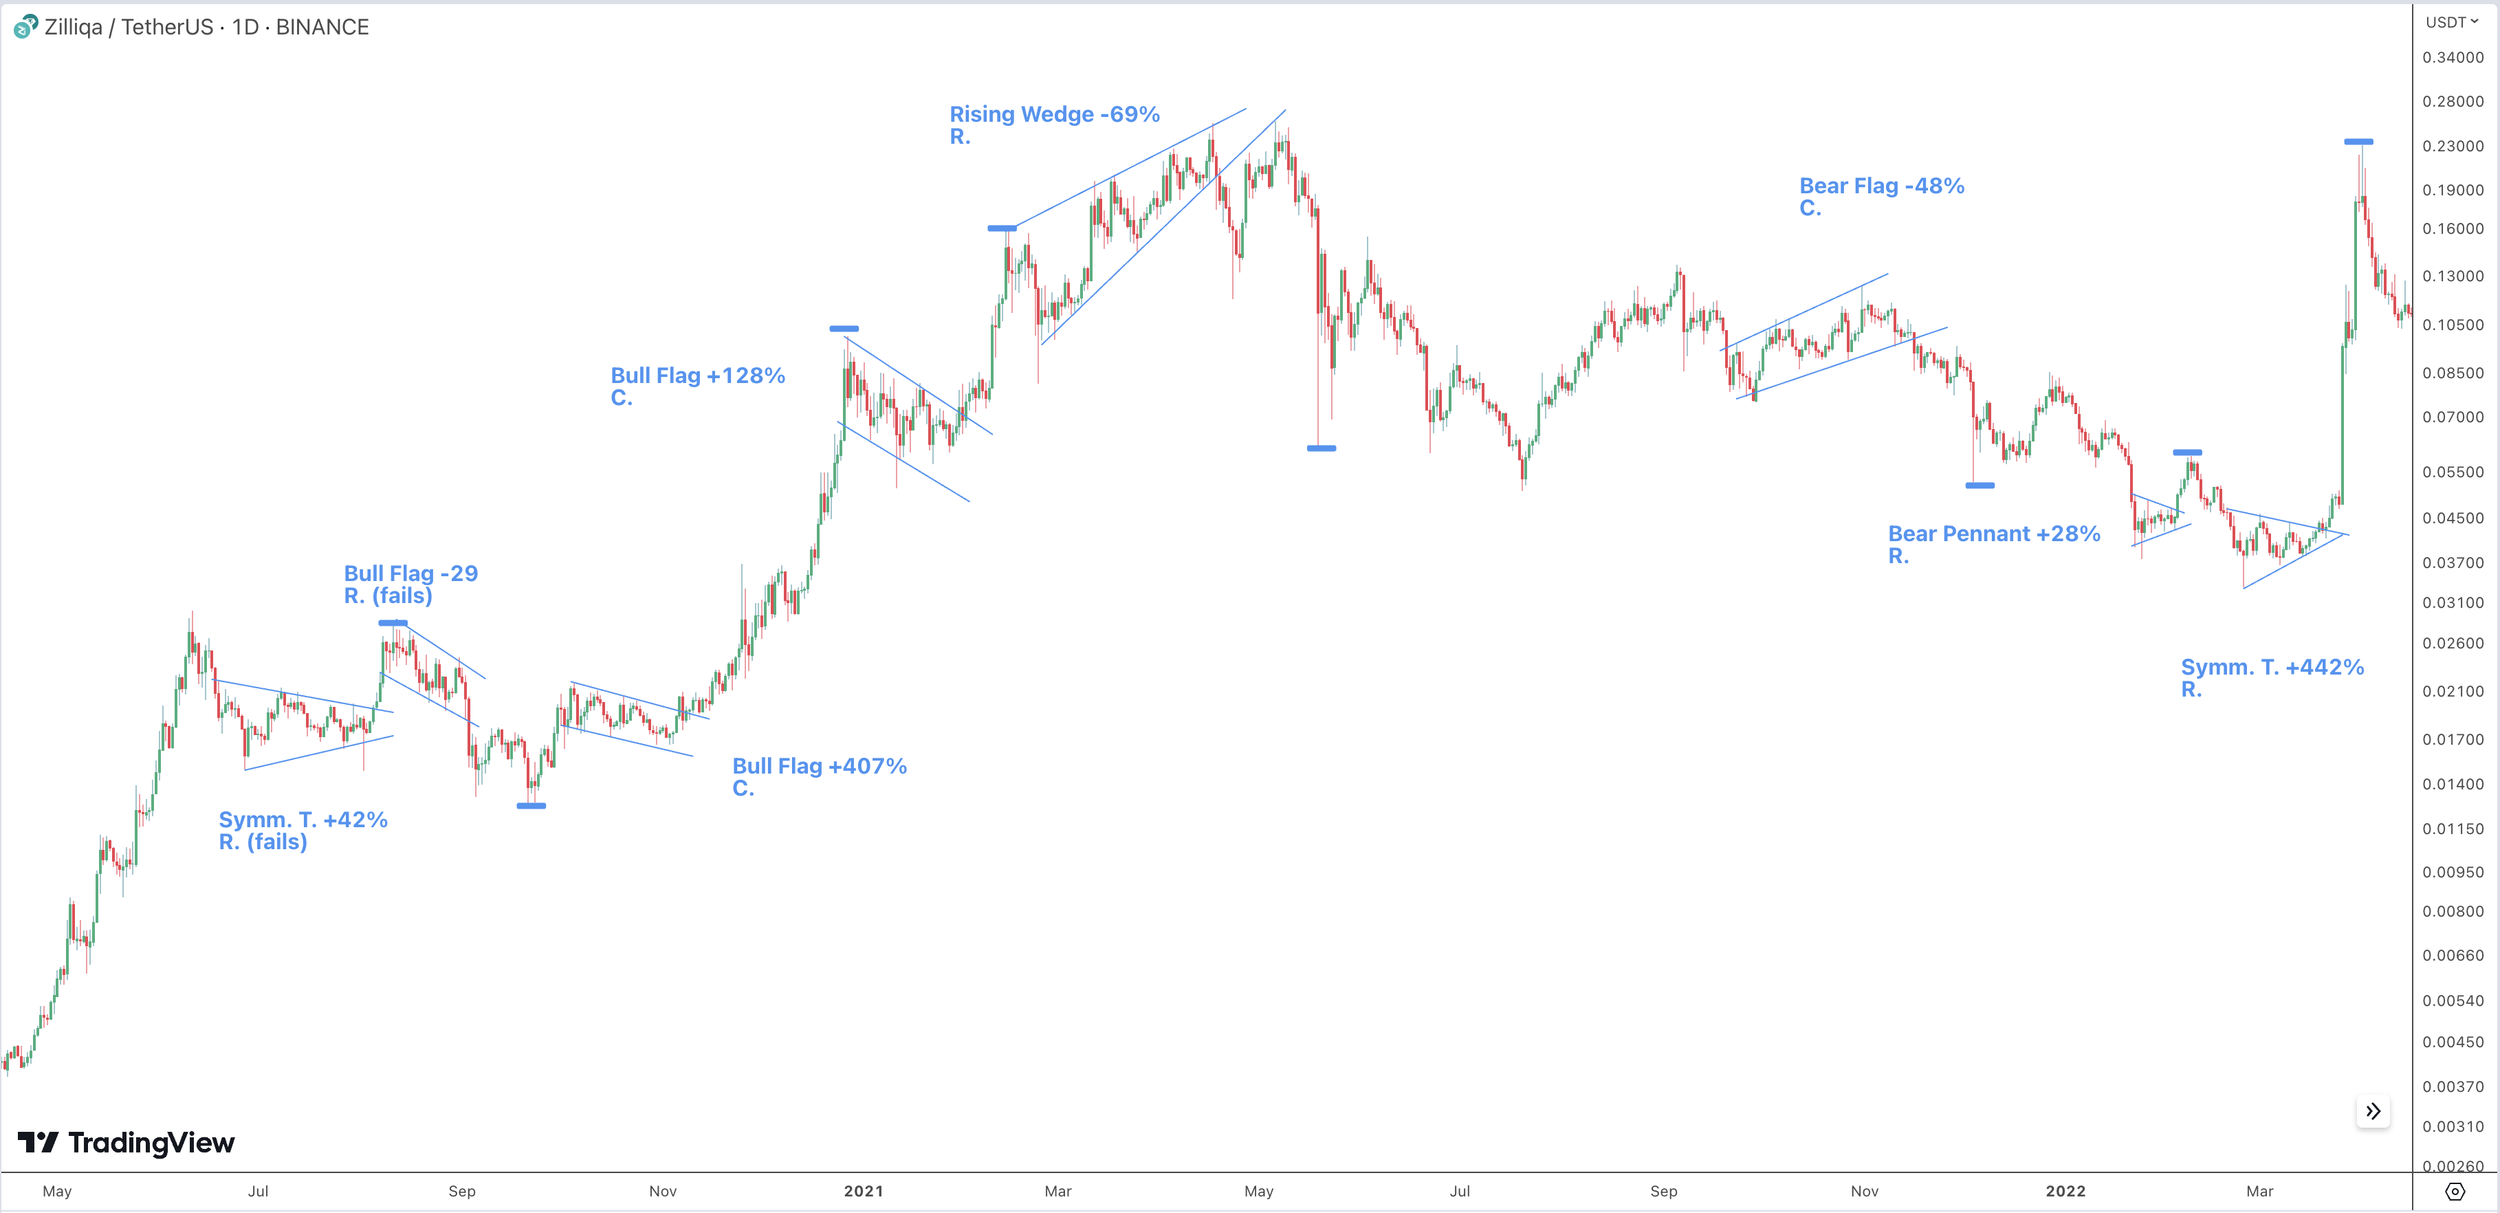
More than 80% of Falling Wedges broke upward.
Interestingly, falling wedges broke out positively 82% of the time (combined trading pairs).
However, that positive breakout is often short-lived. See the Chart Logic Handbook for details!
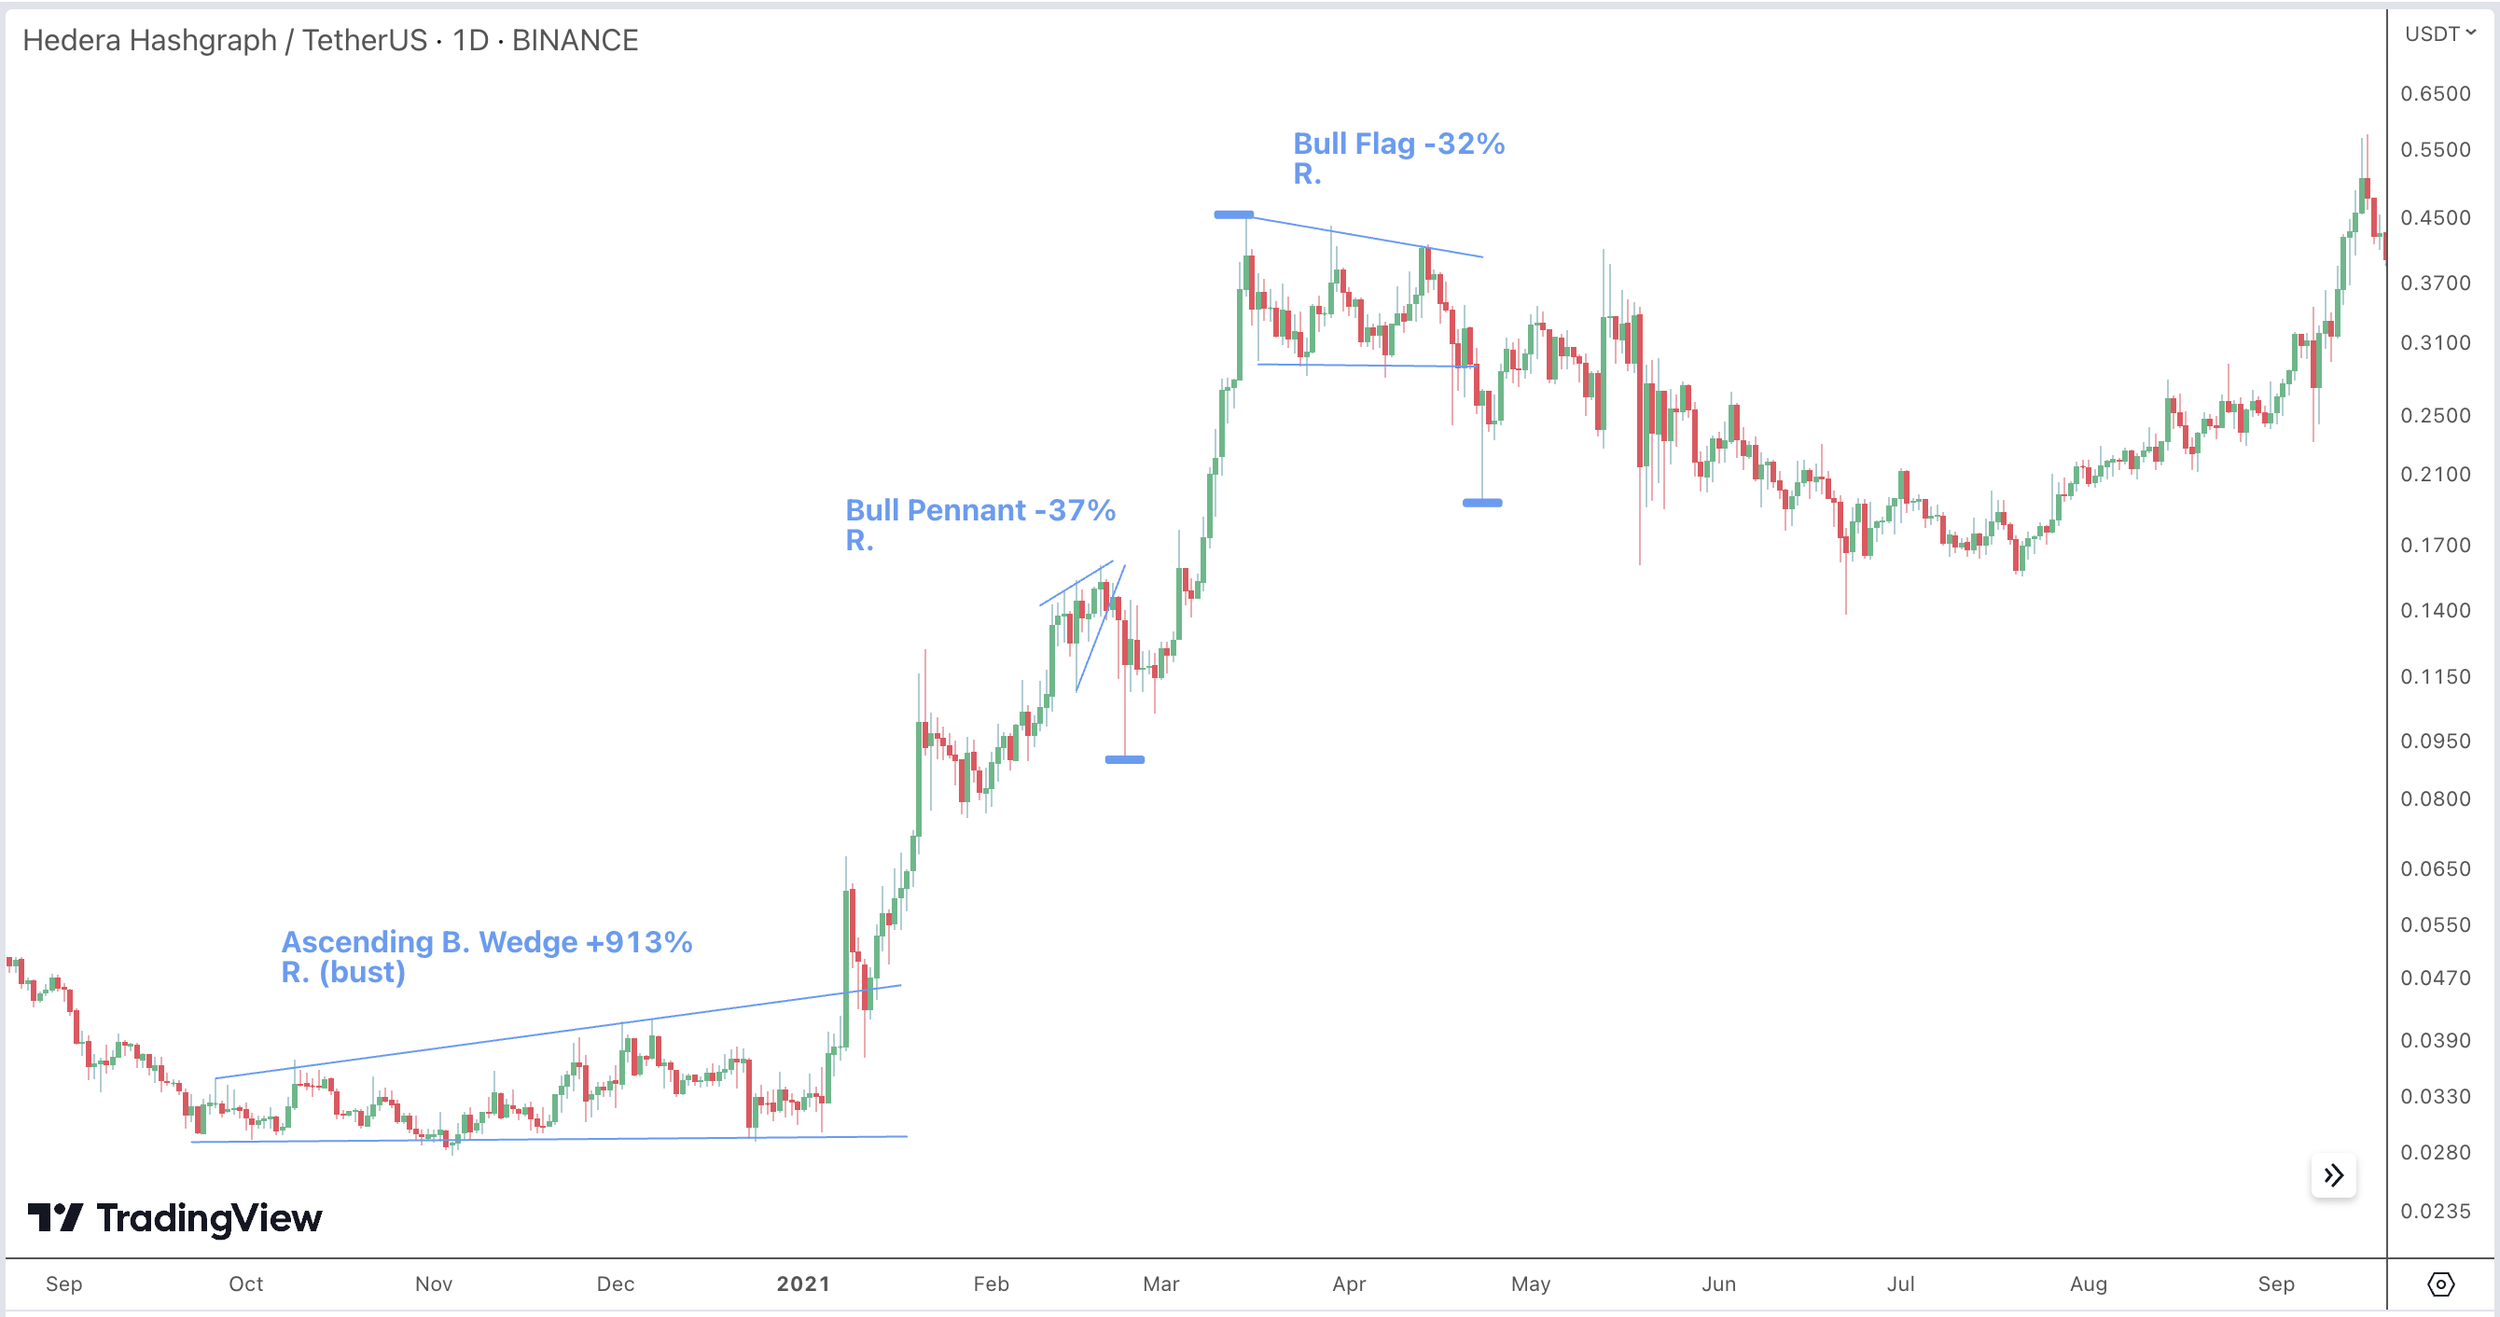
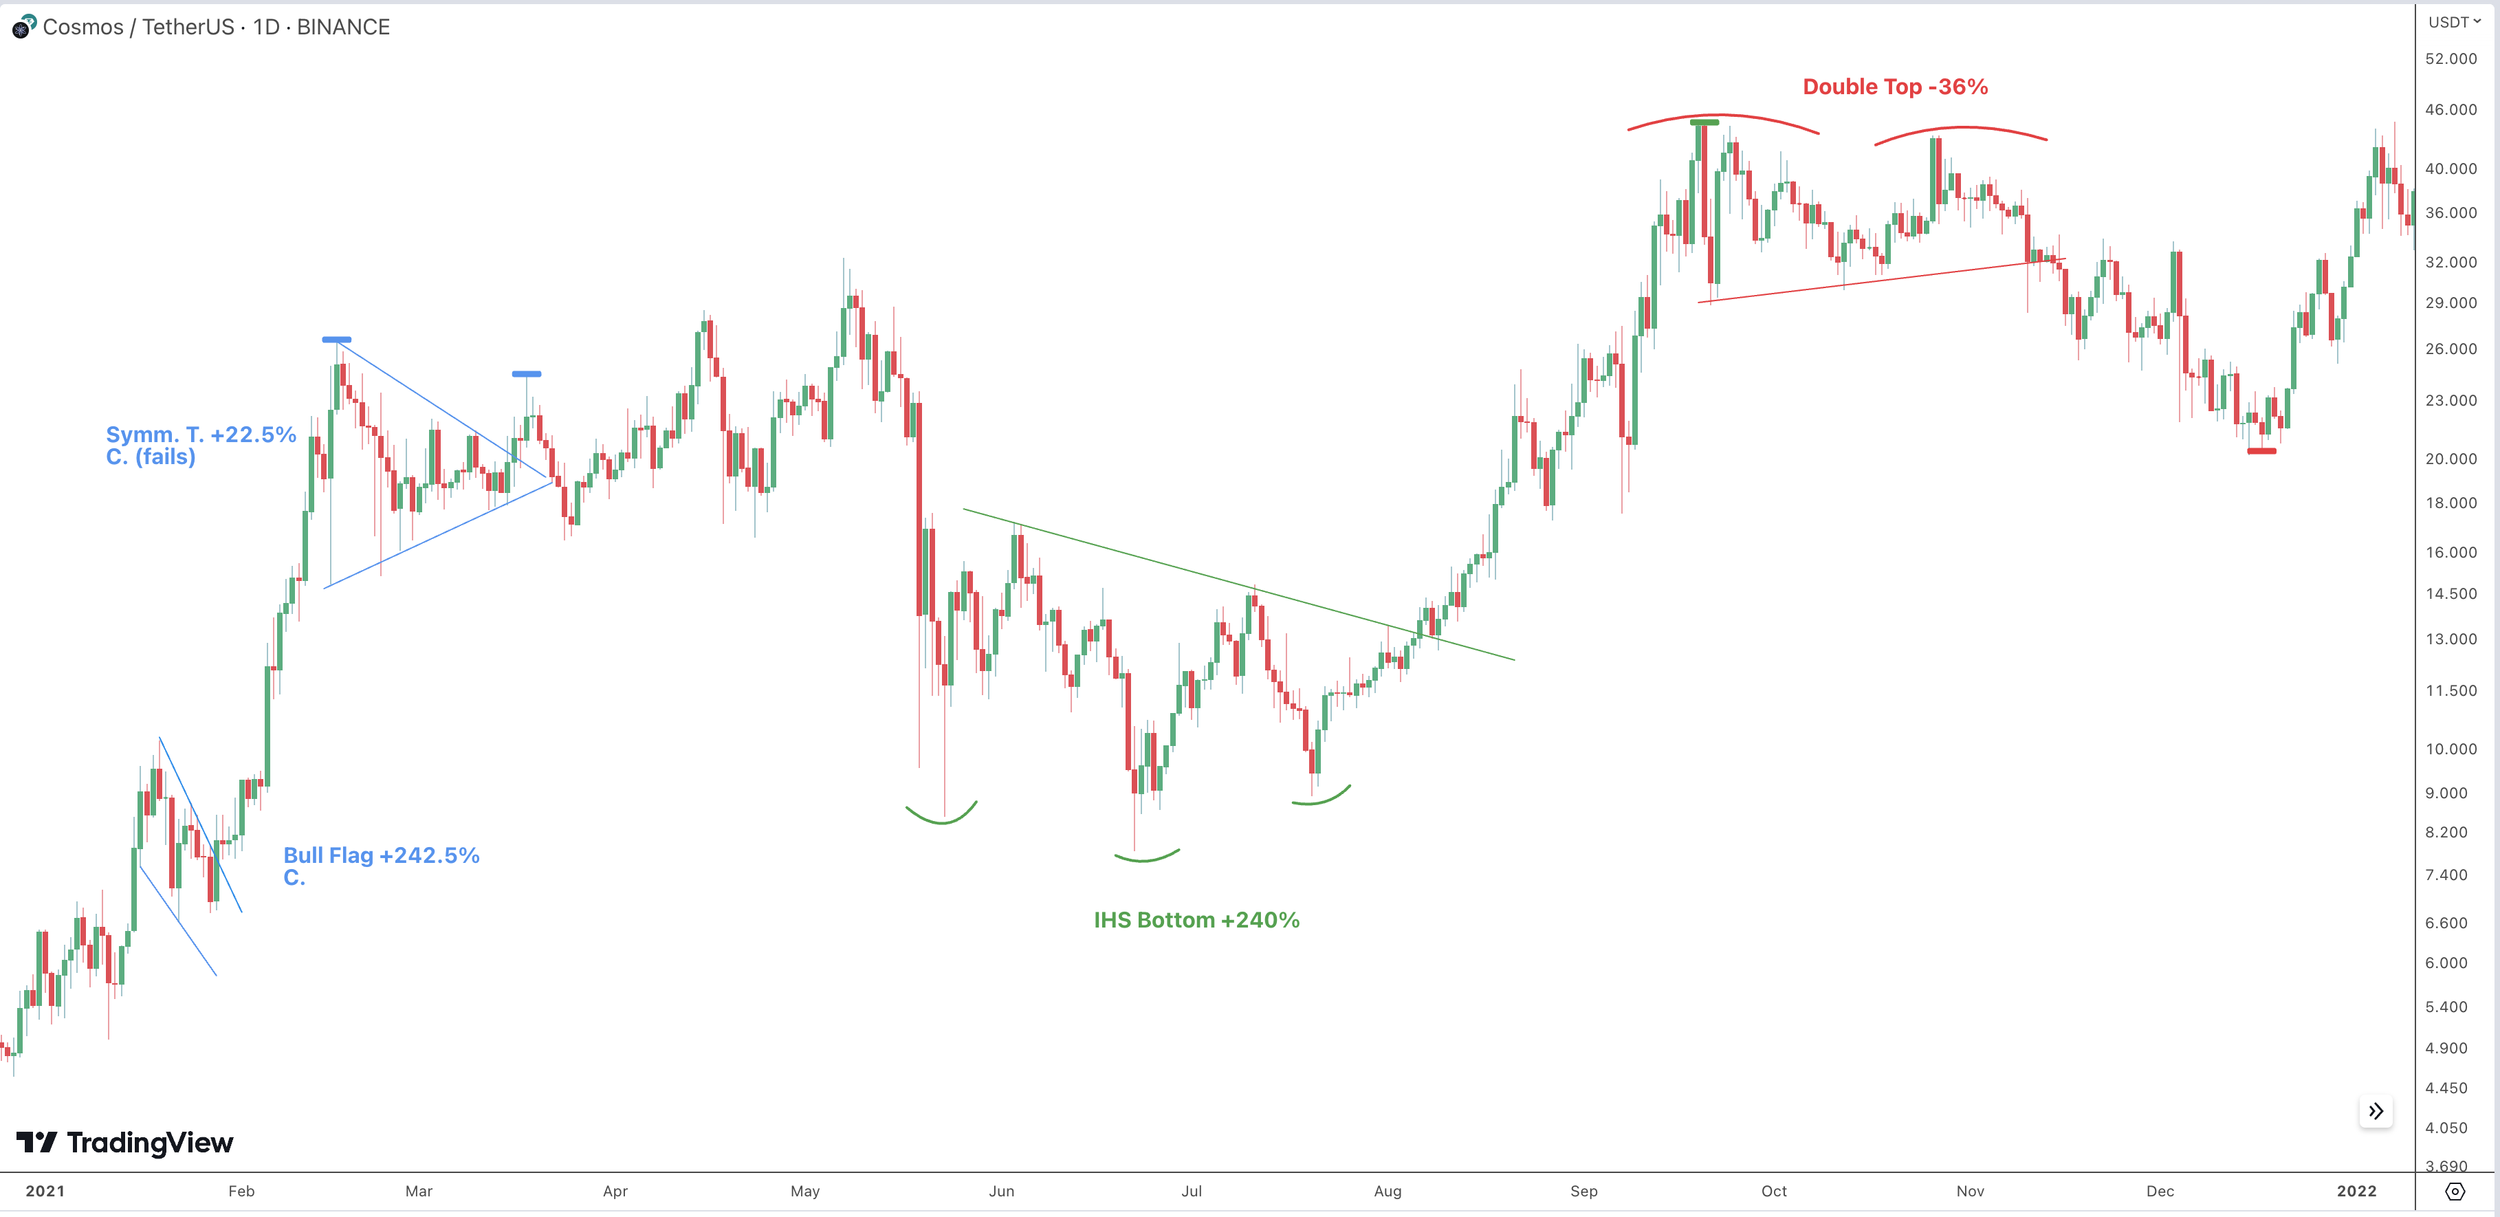
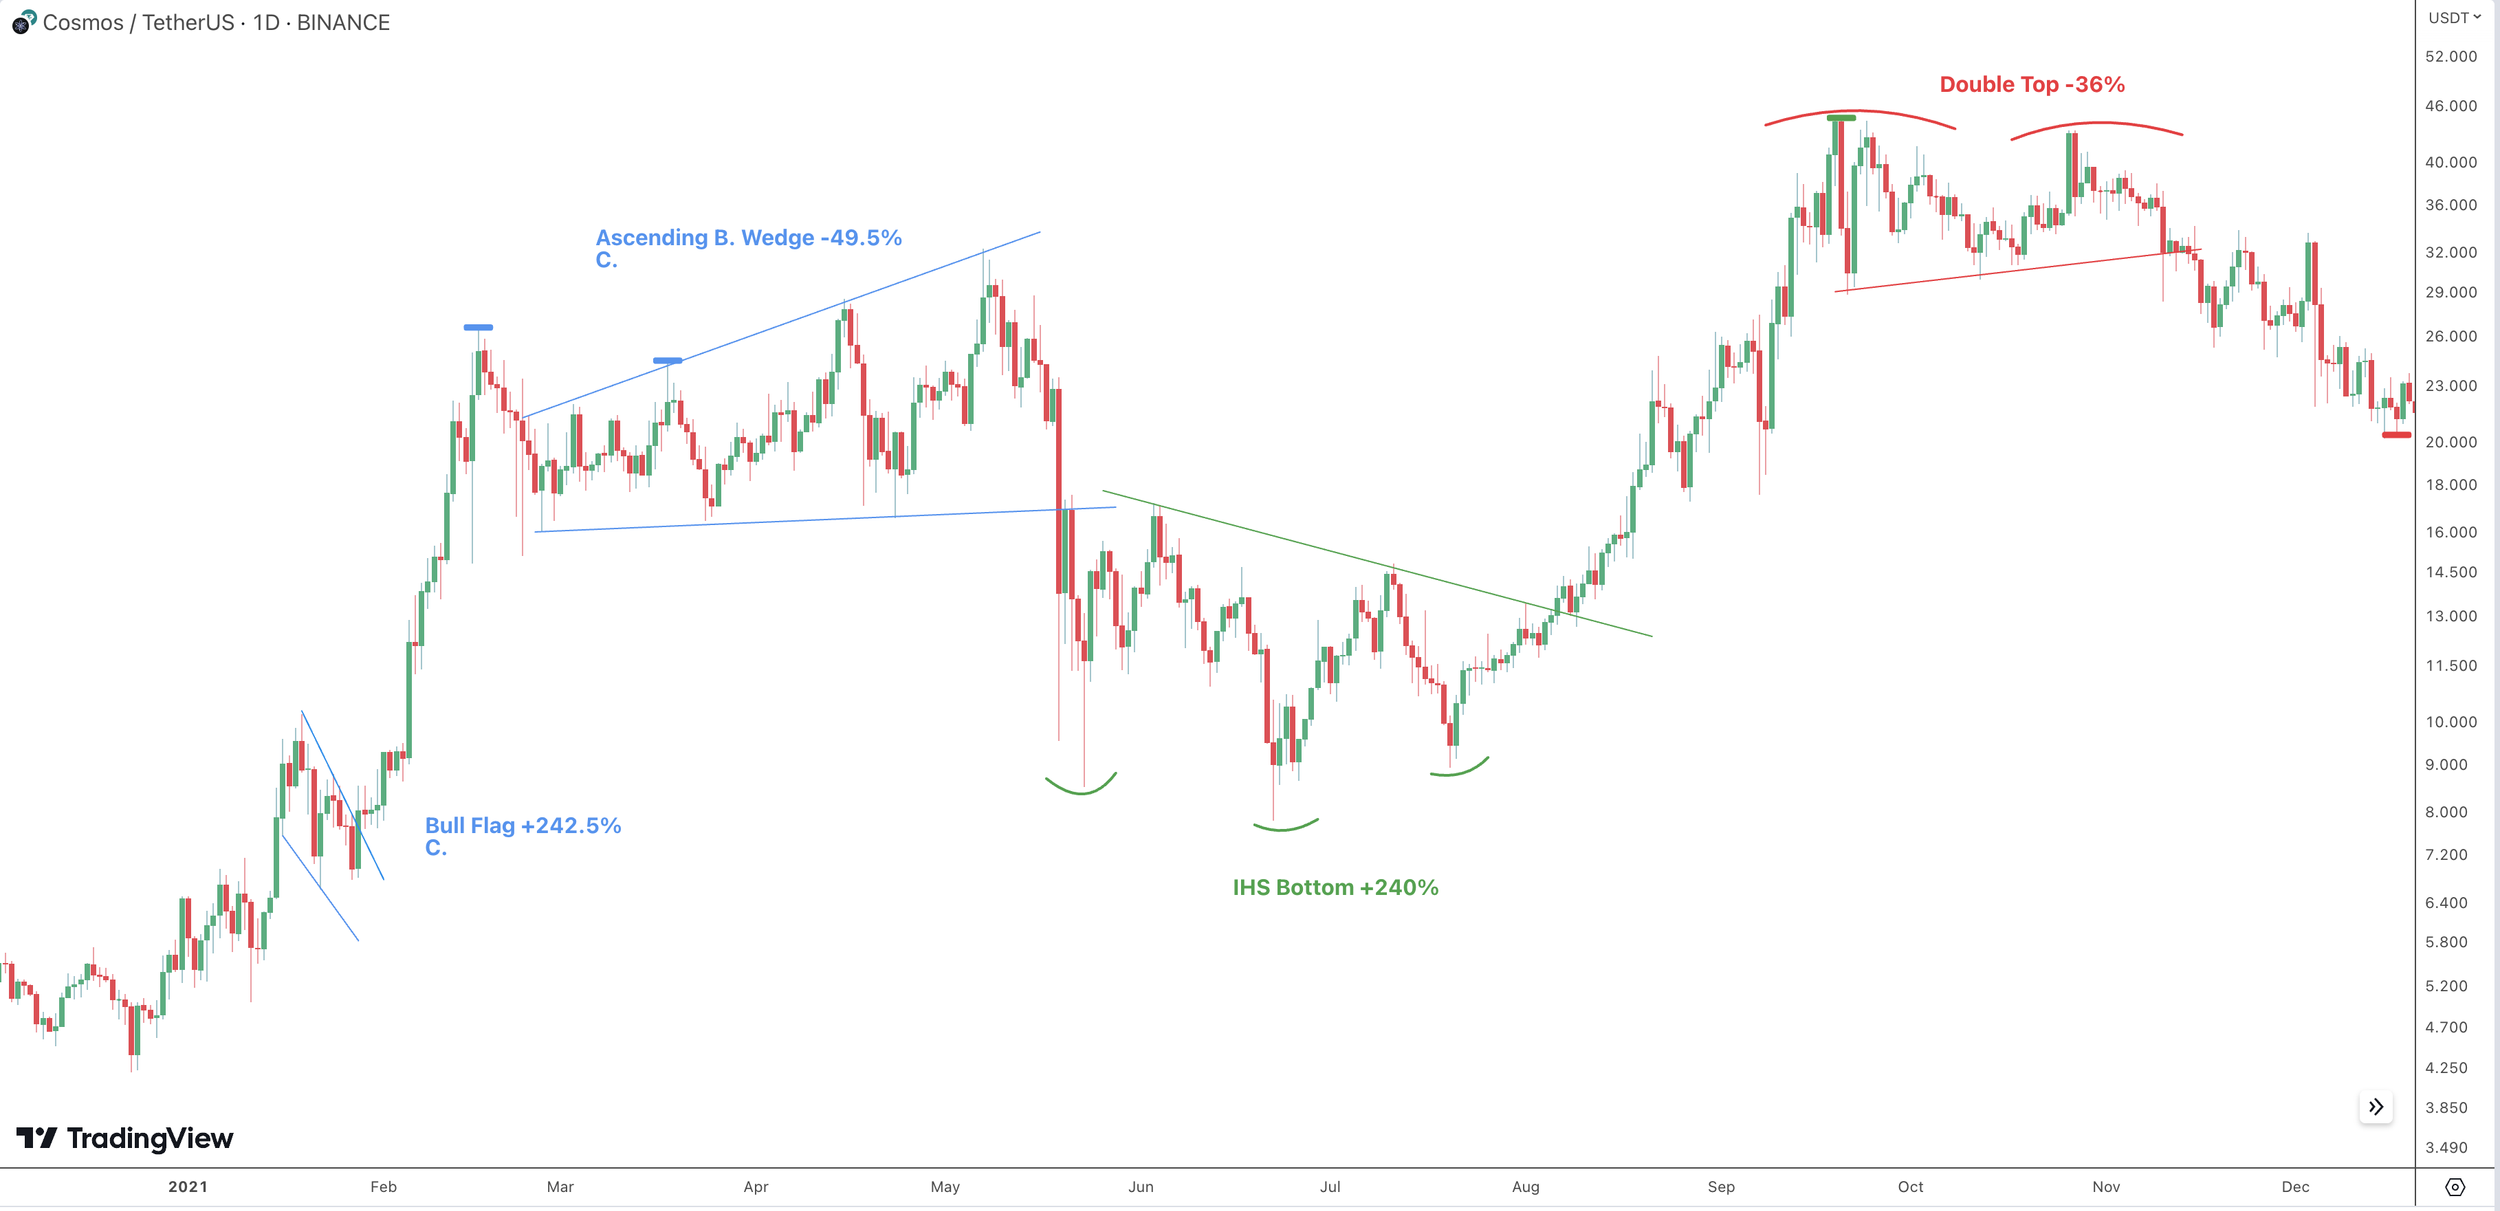
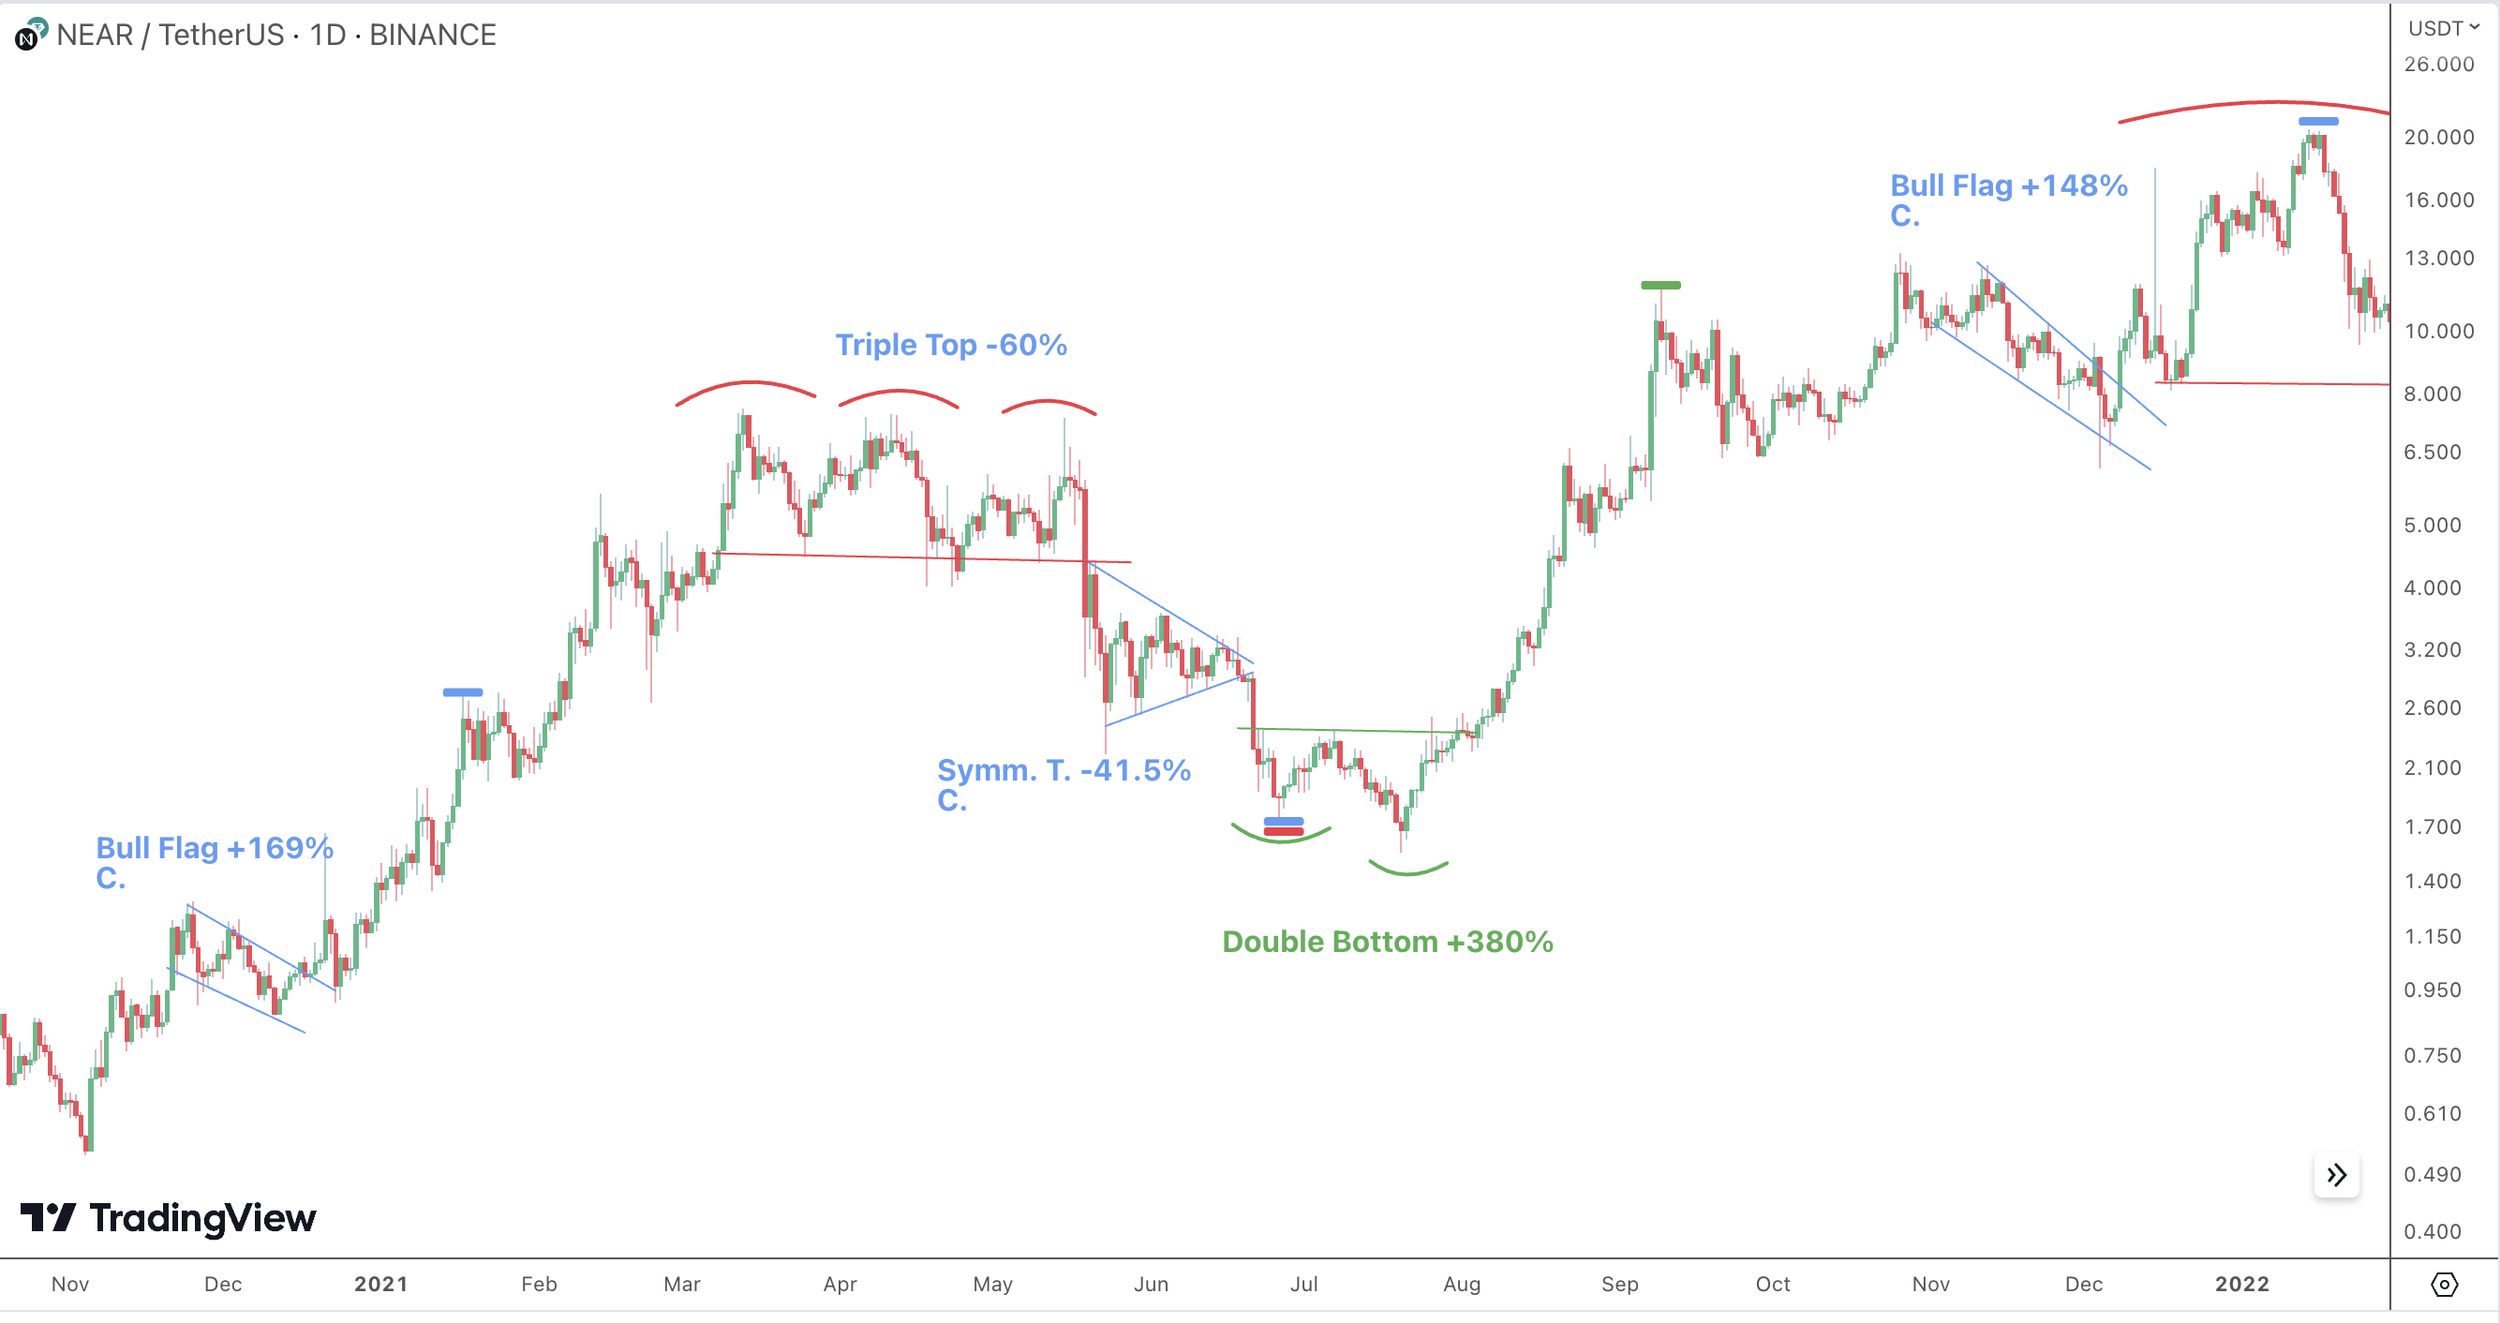
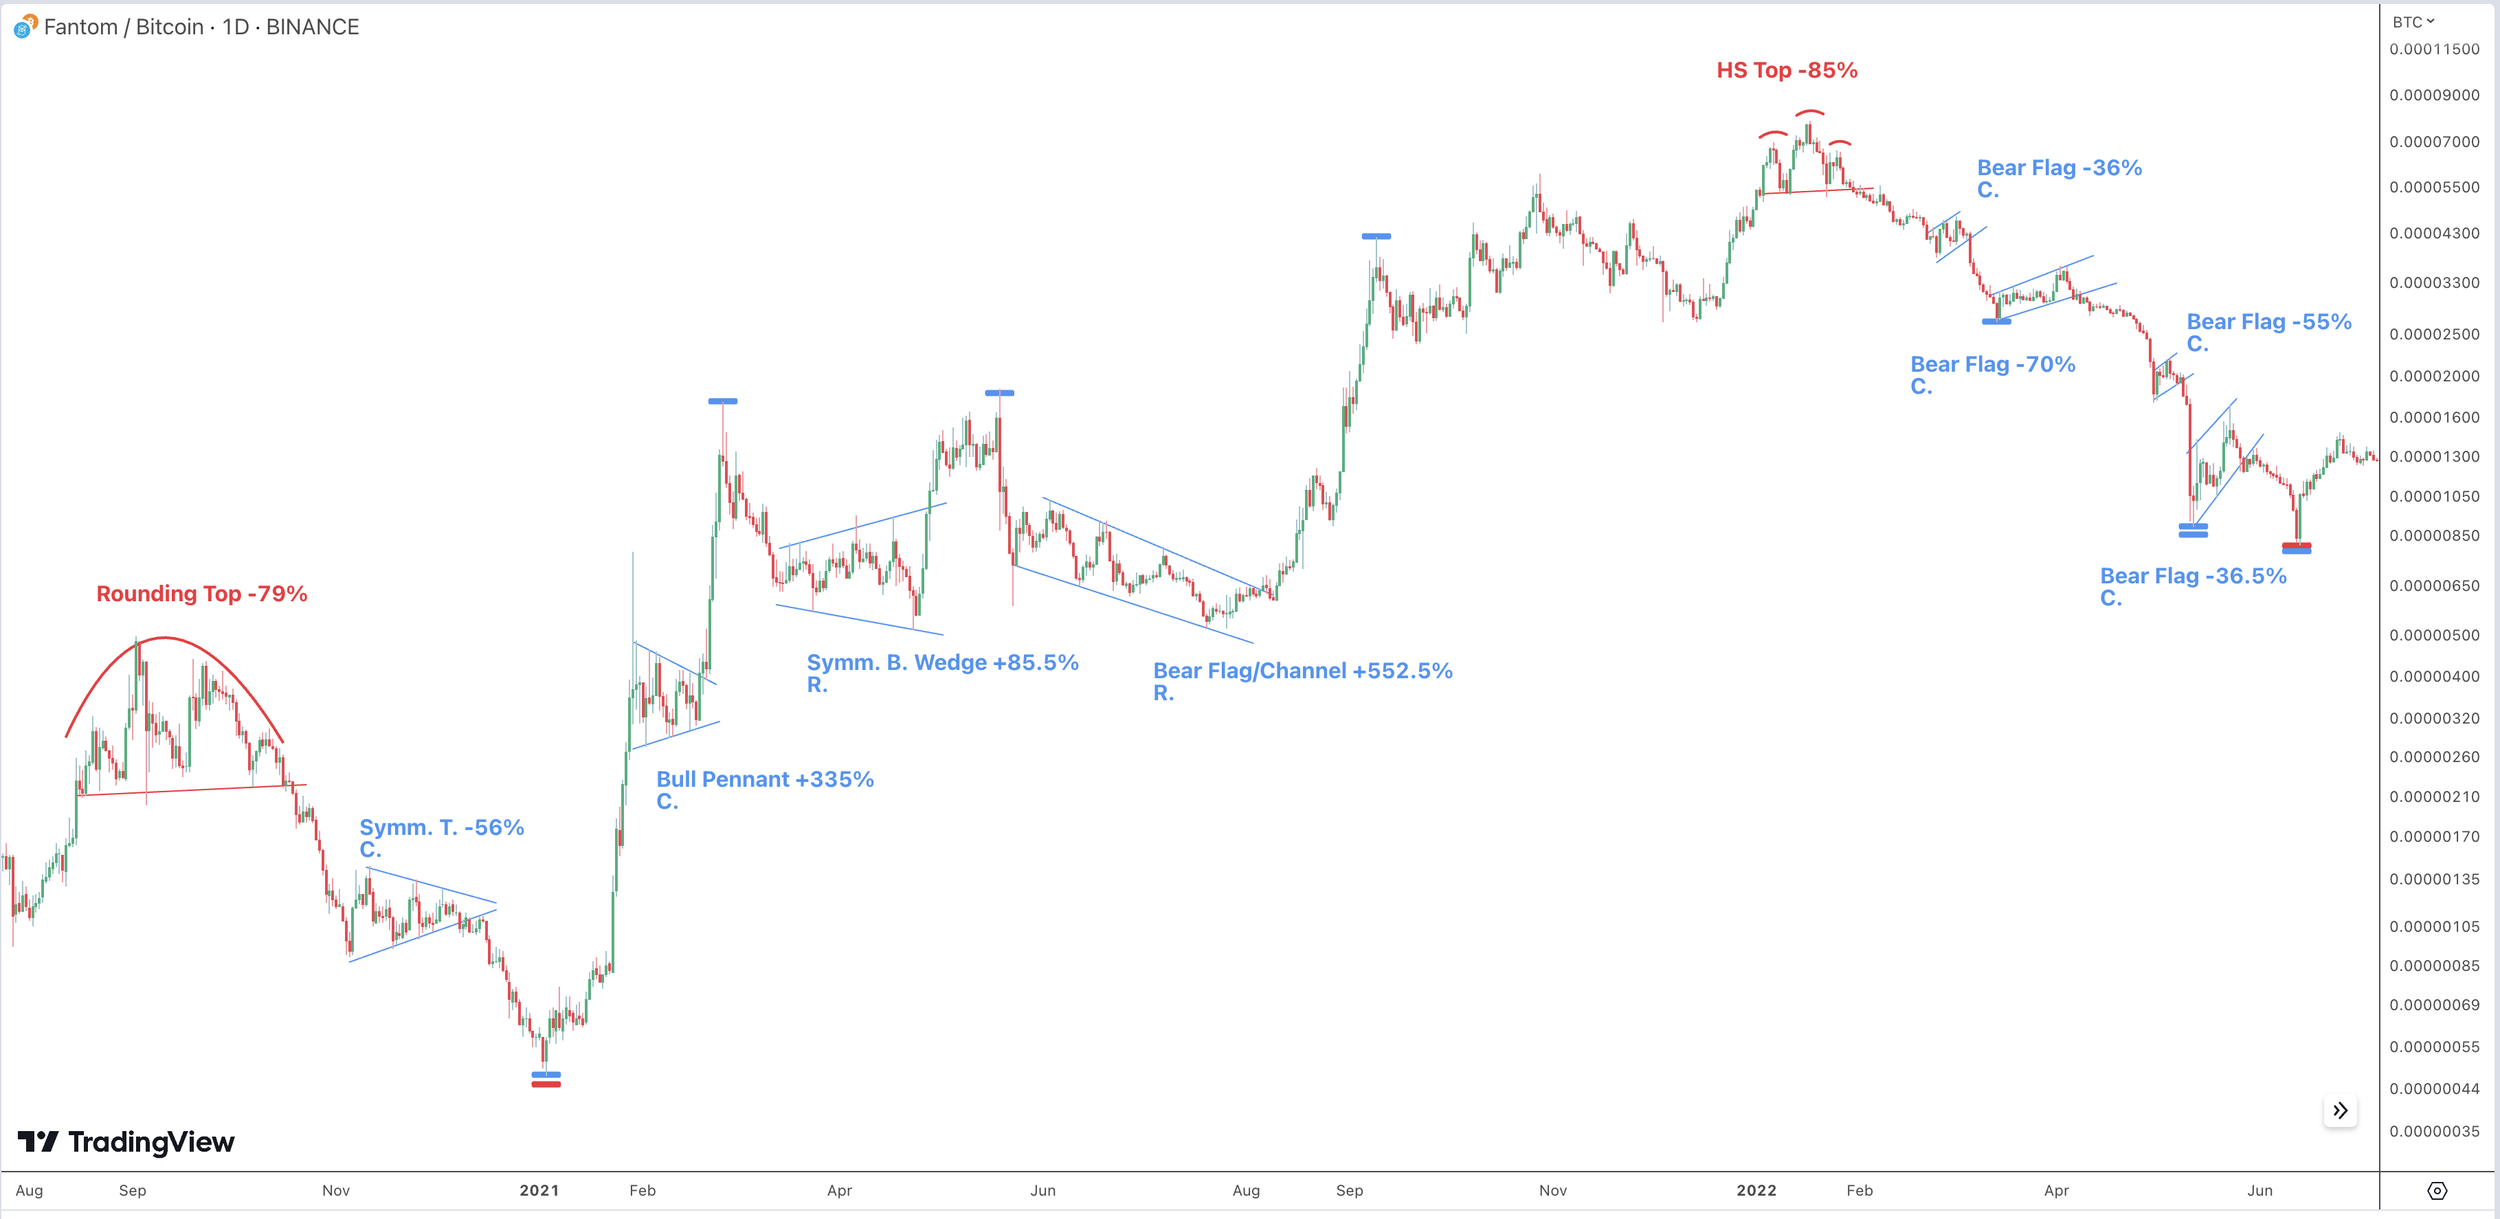
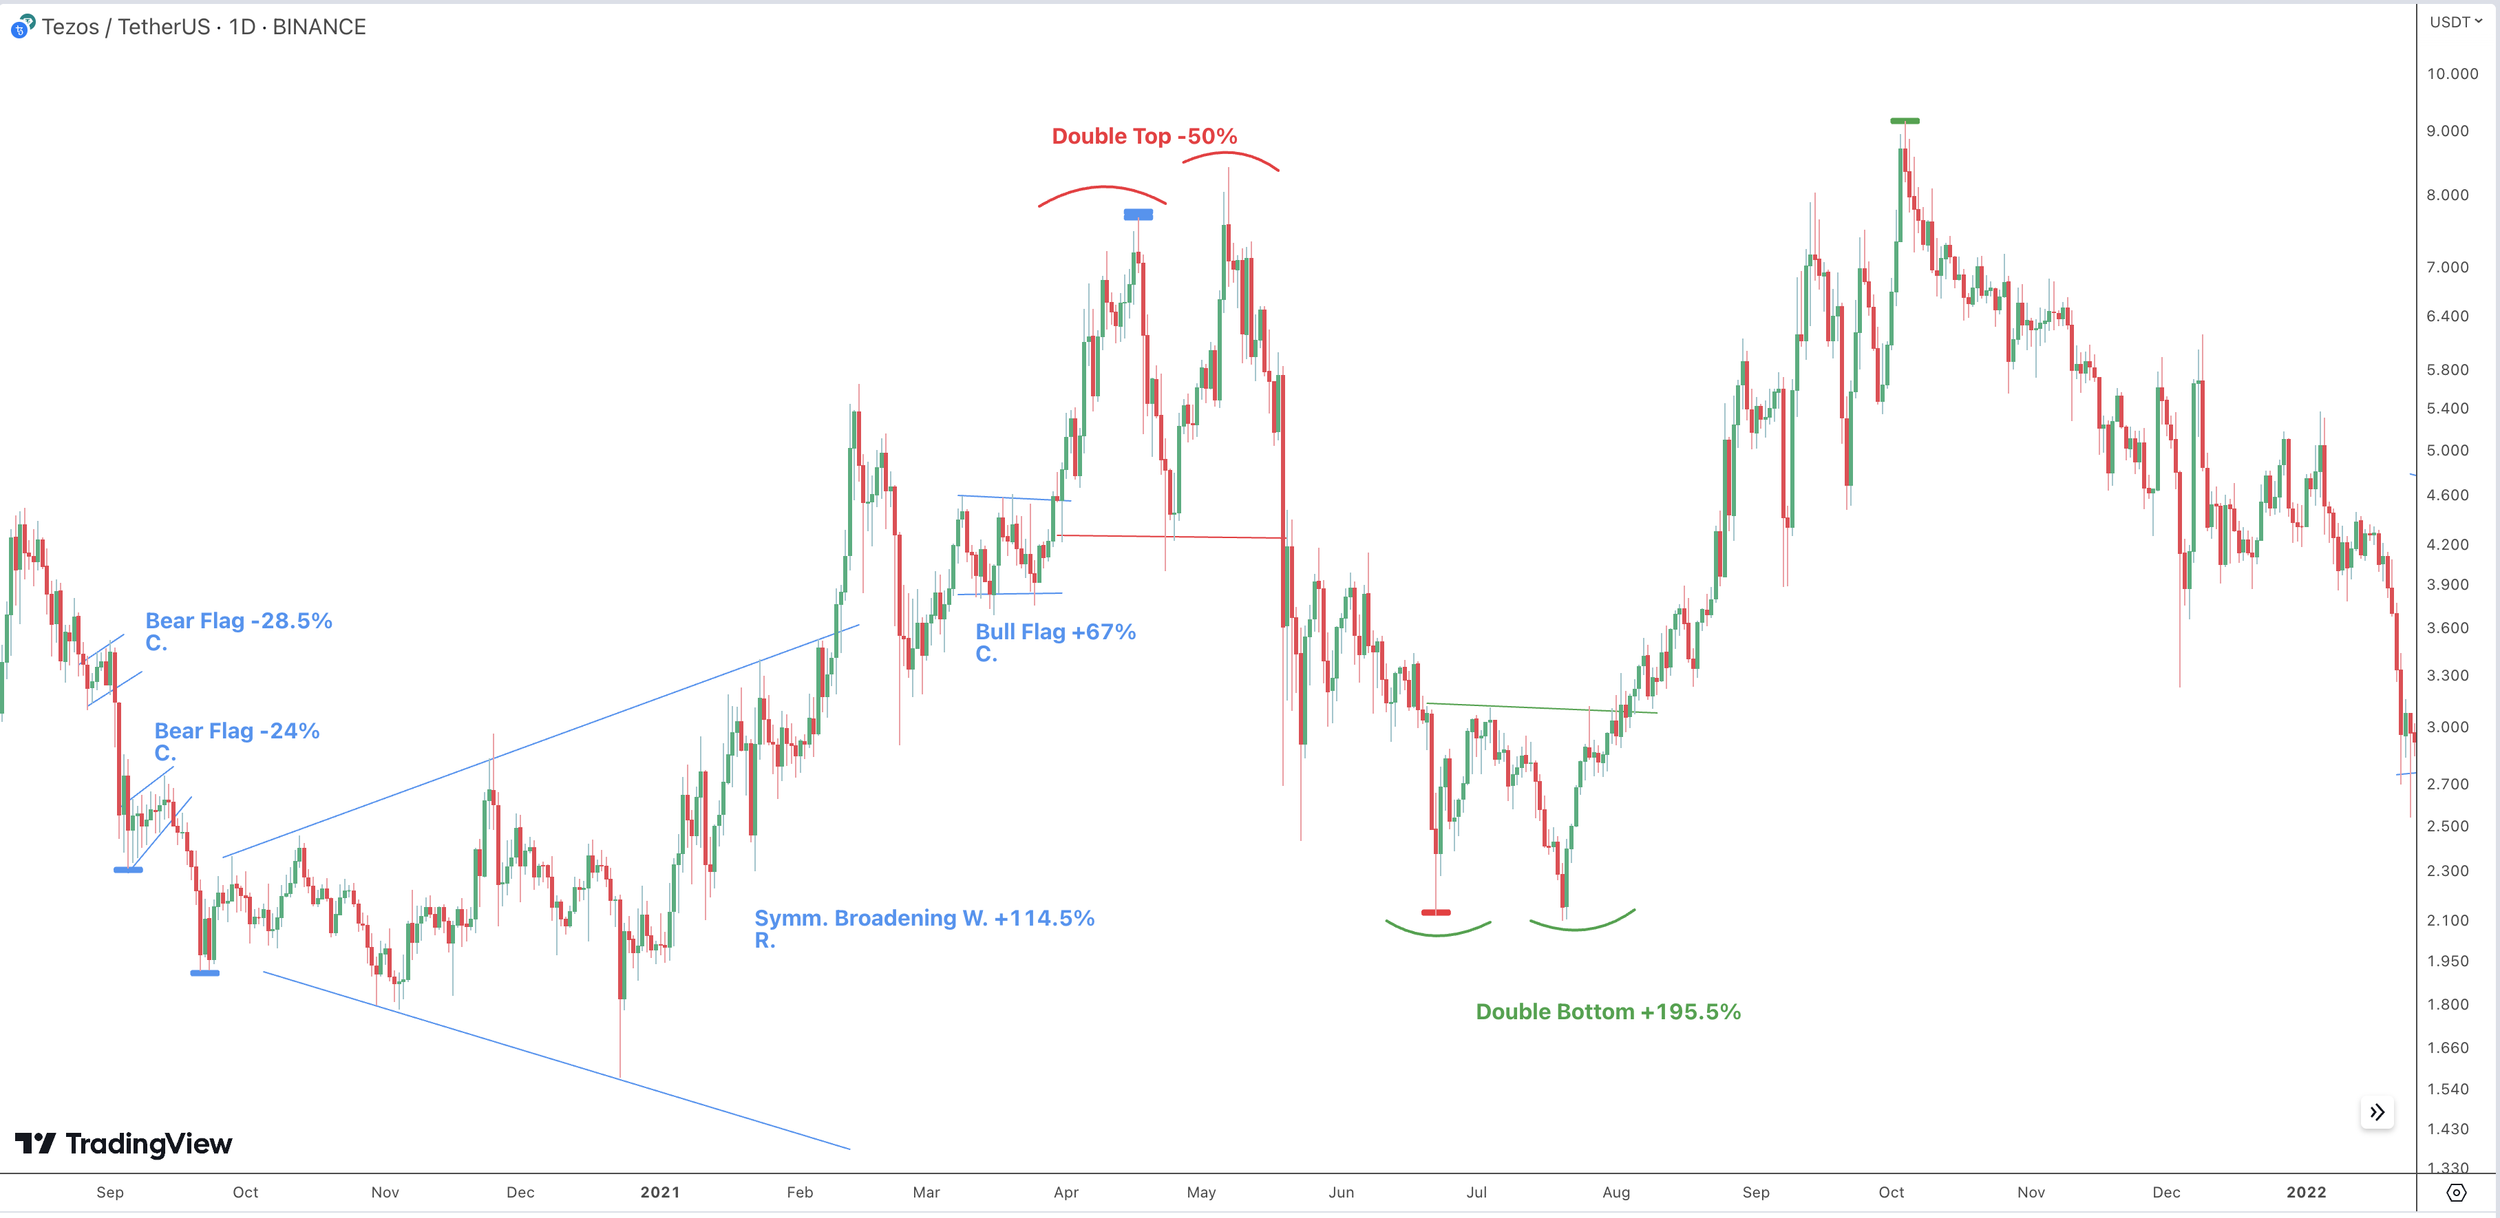
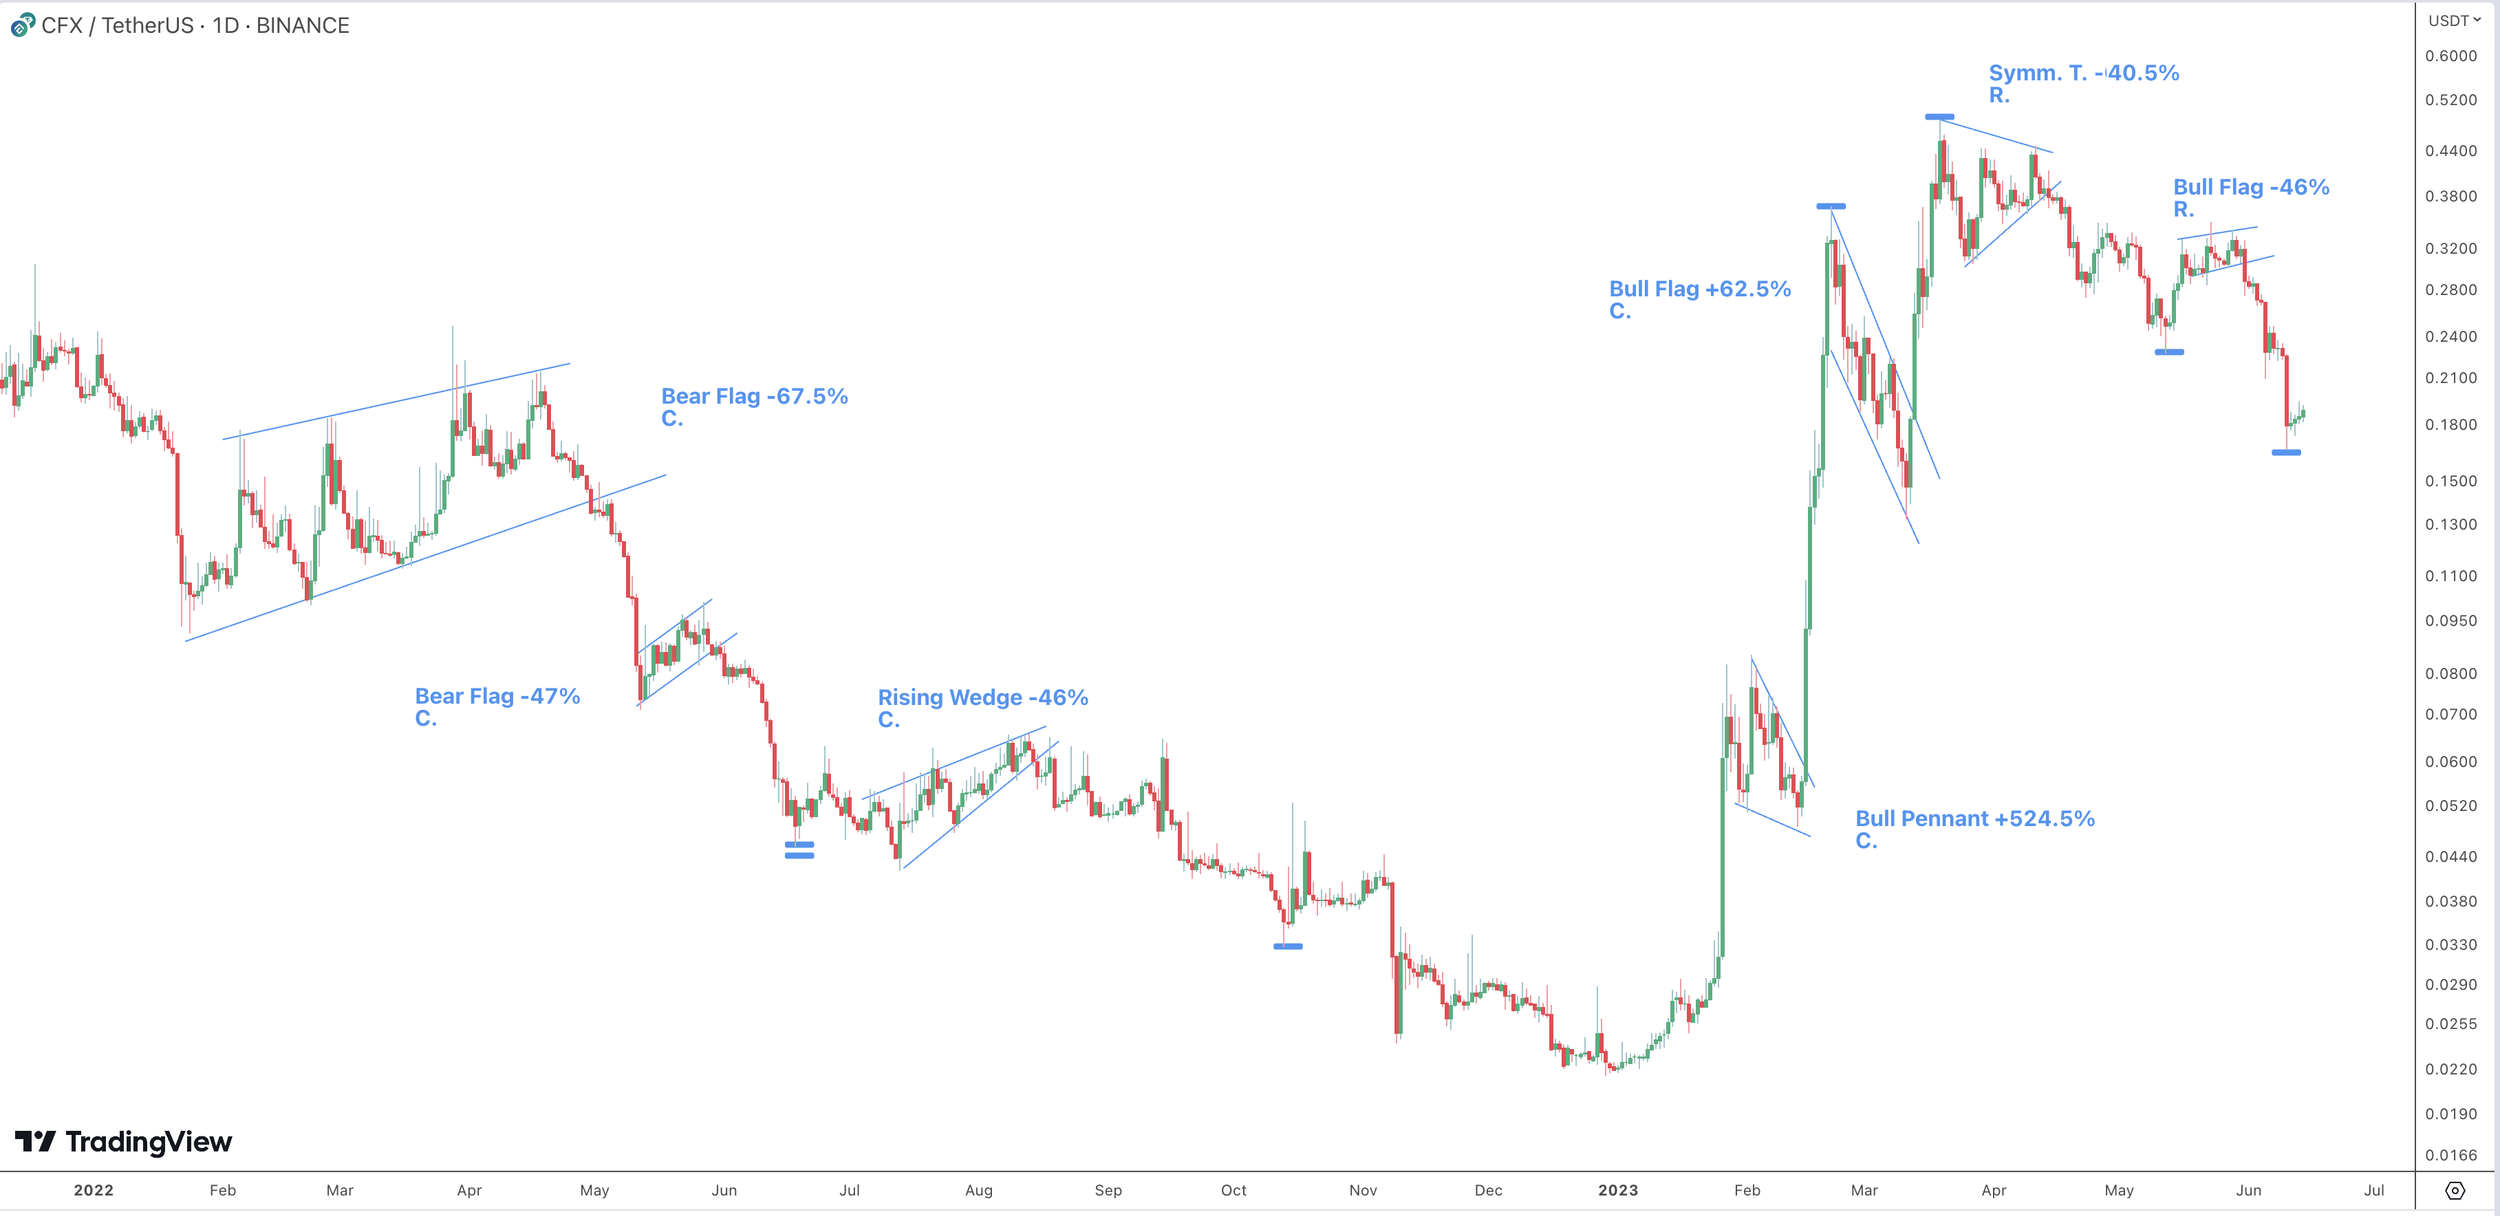
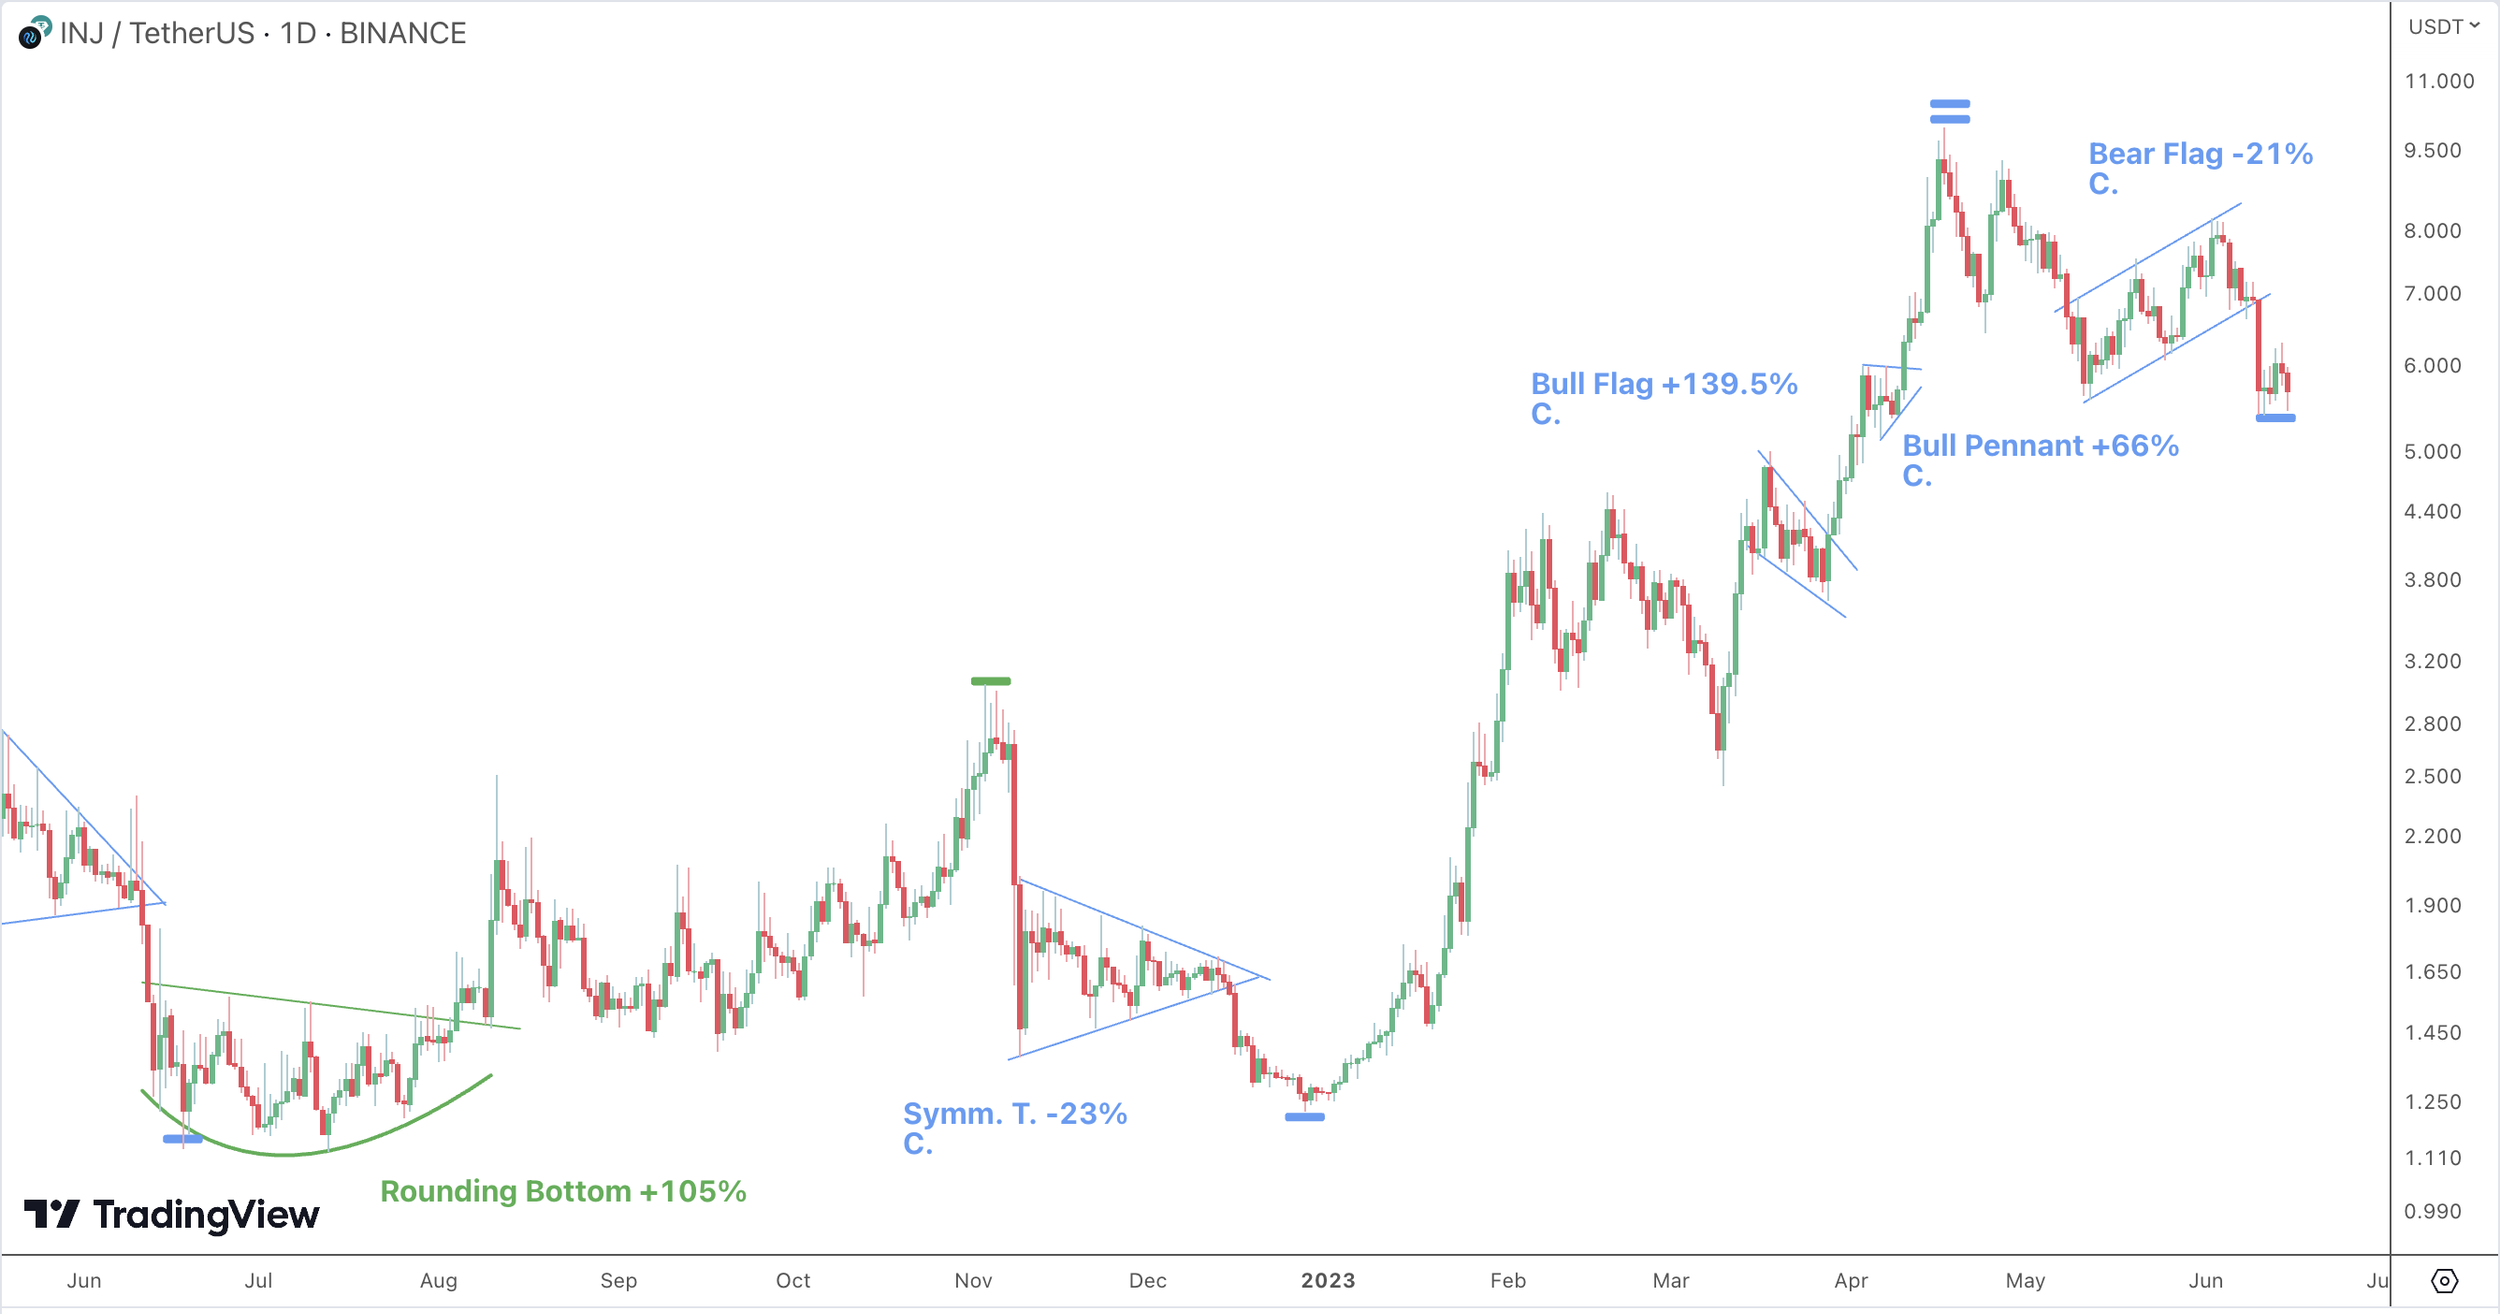
The largest single pattern move was a 3,287% Bull Flag (XVG/USD)!
No joke, and over the course of just two weeks!
When moon?
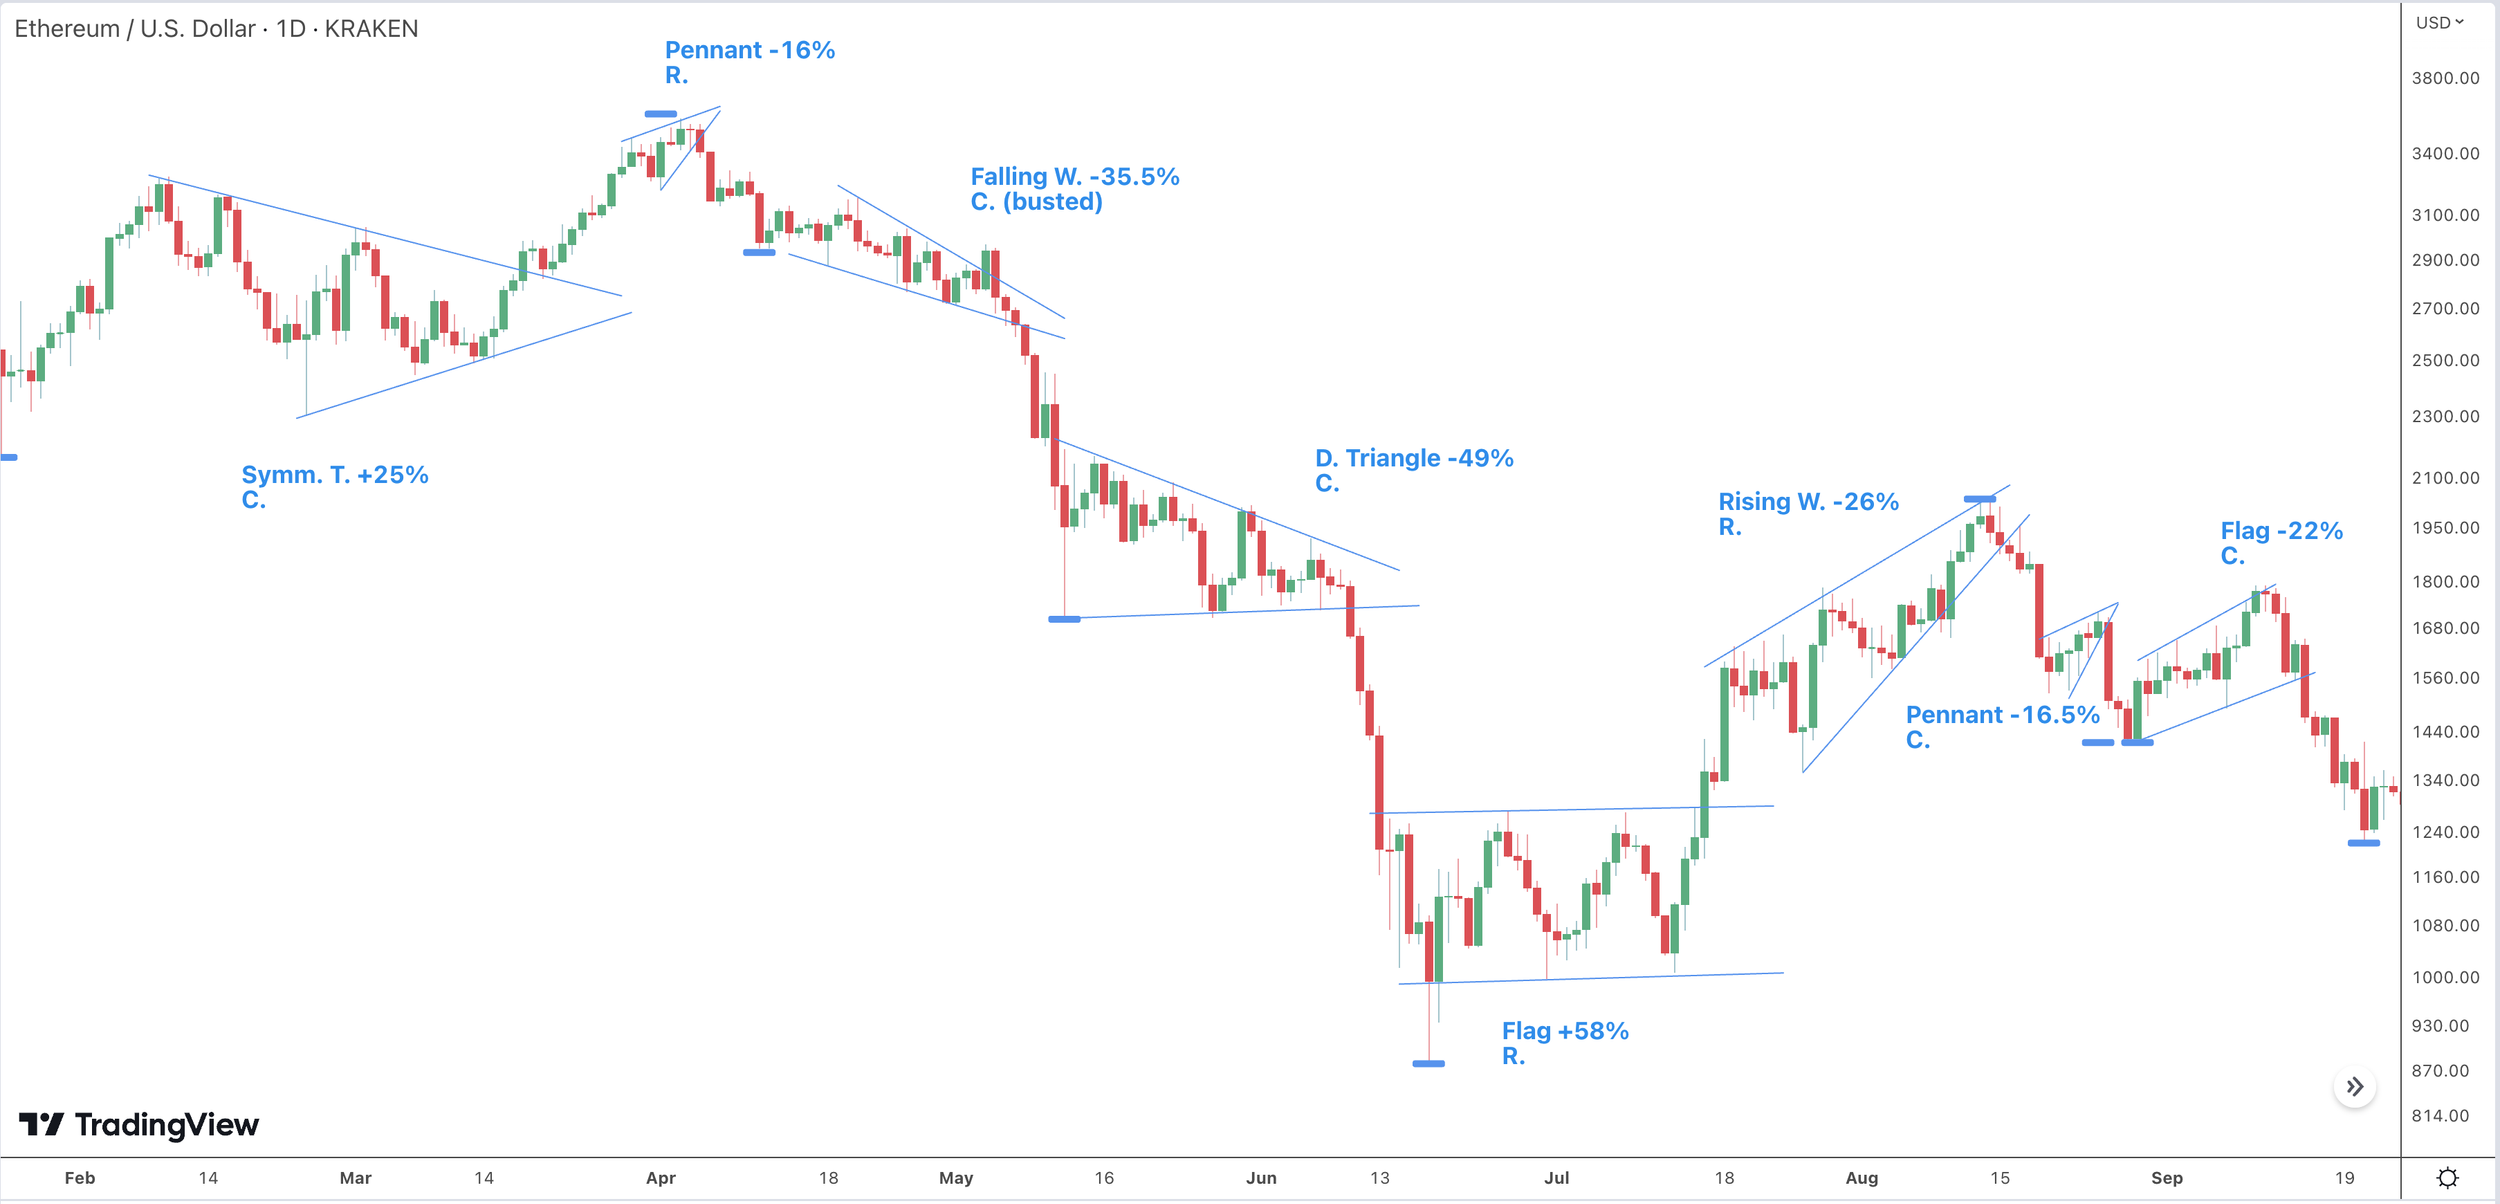
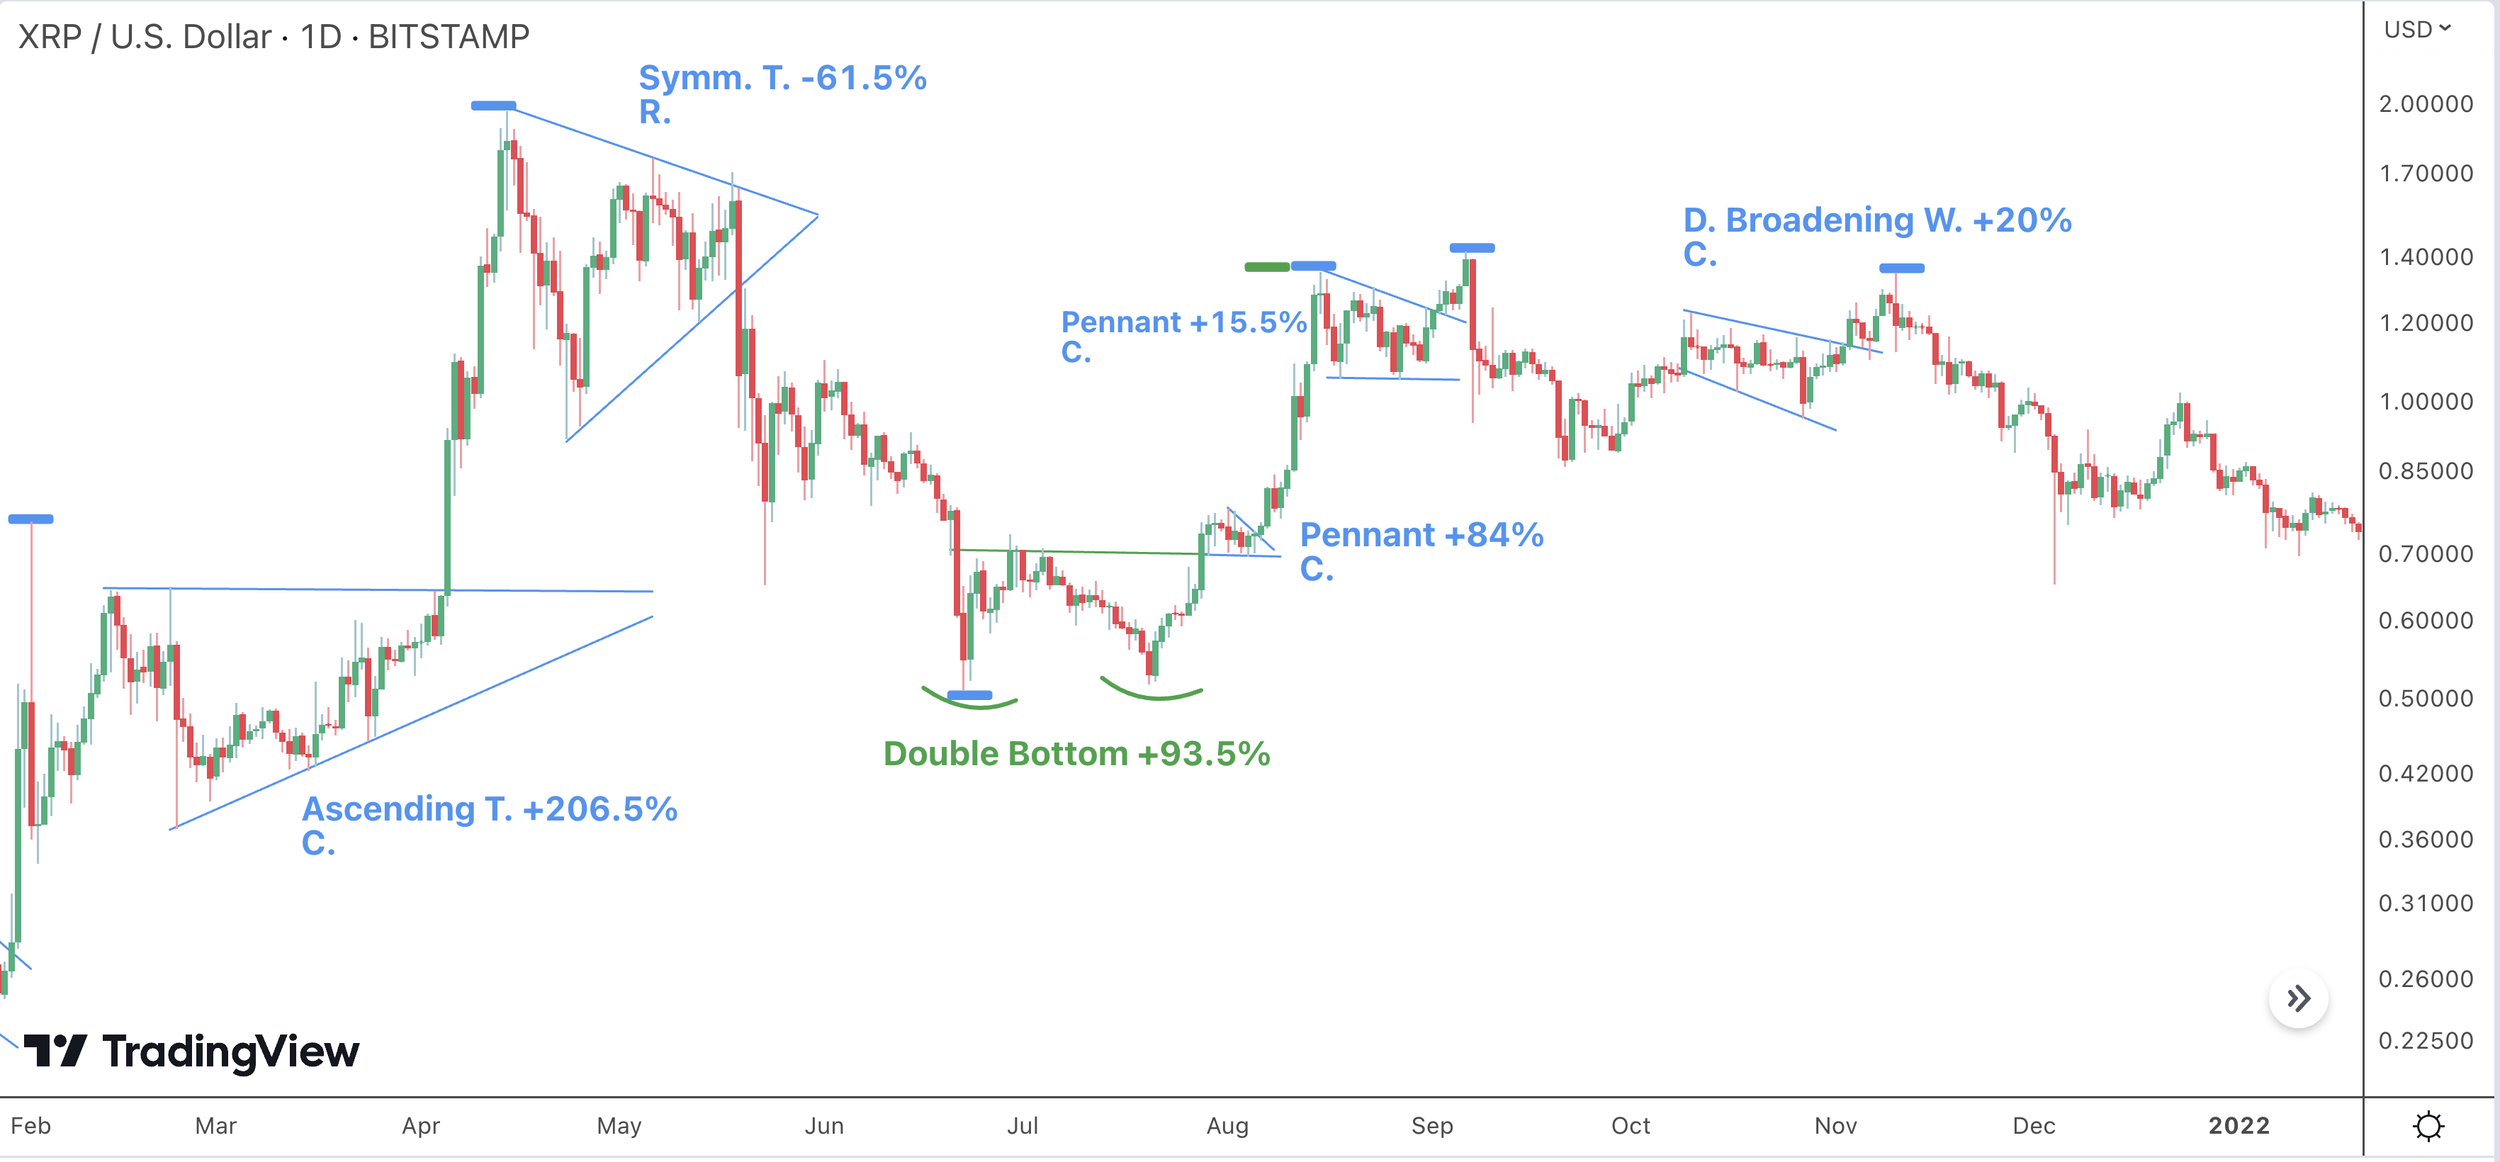
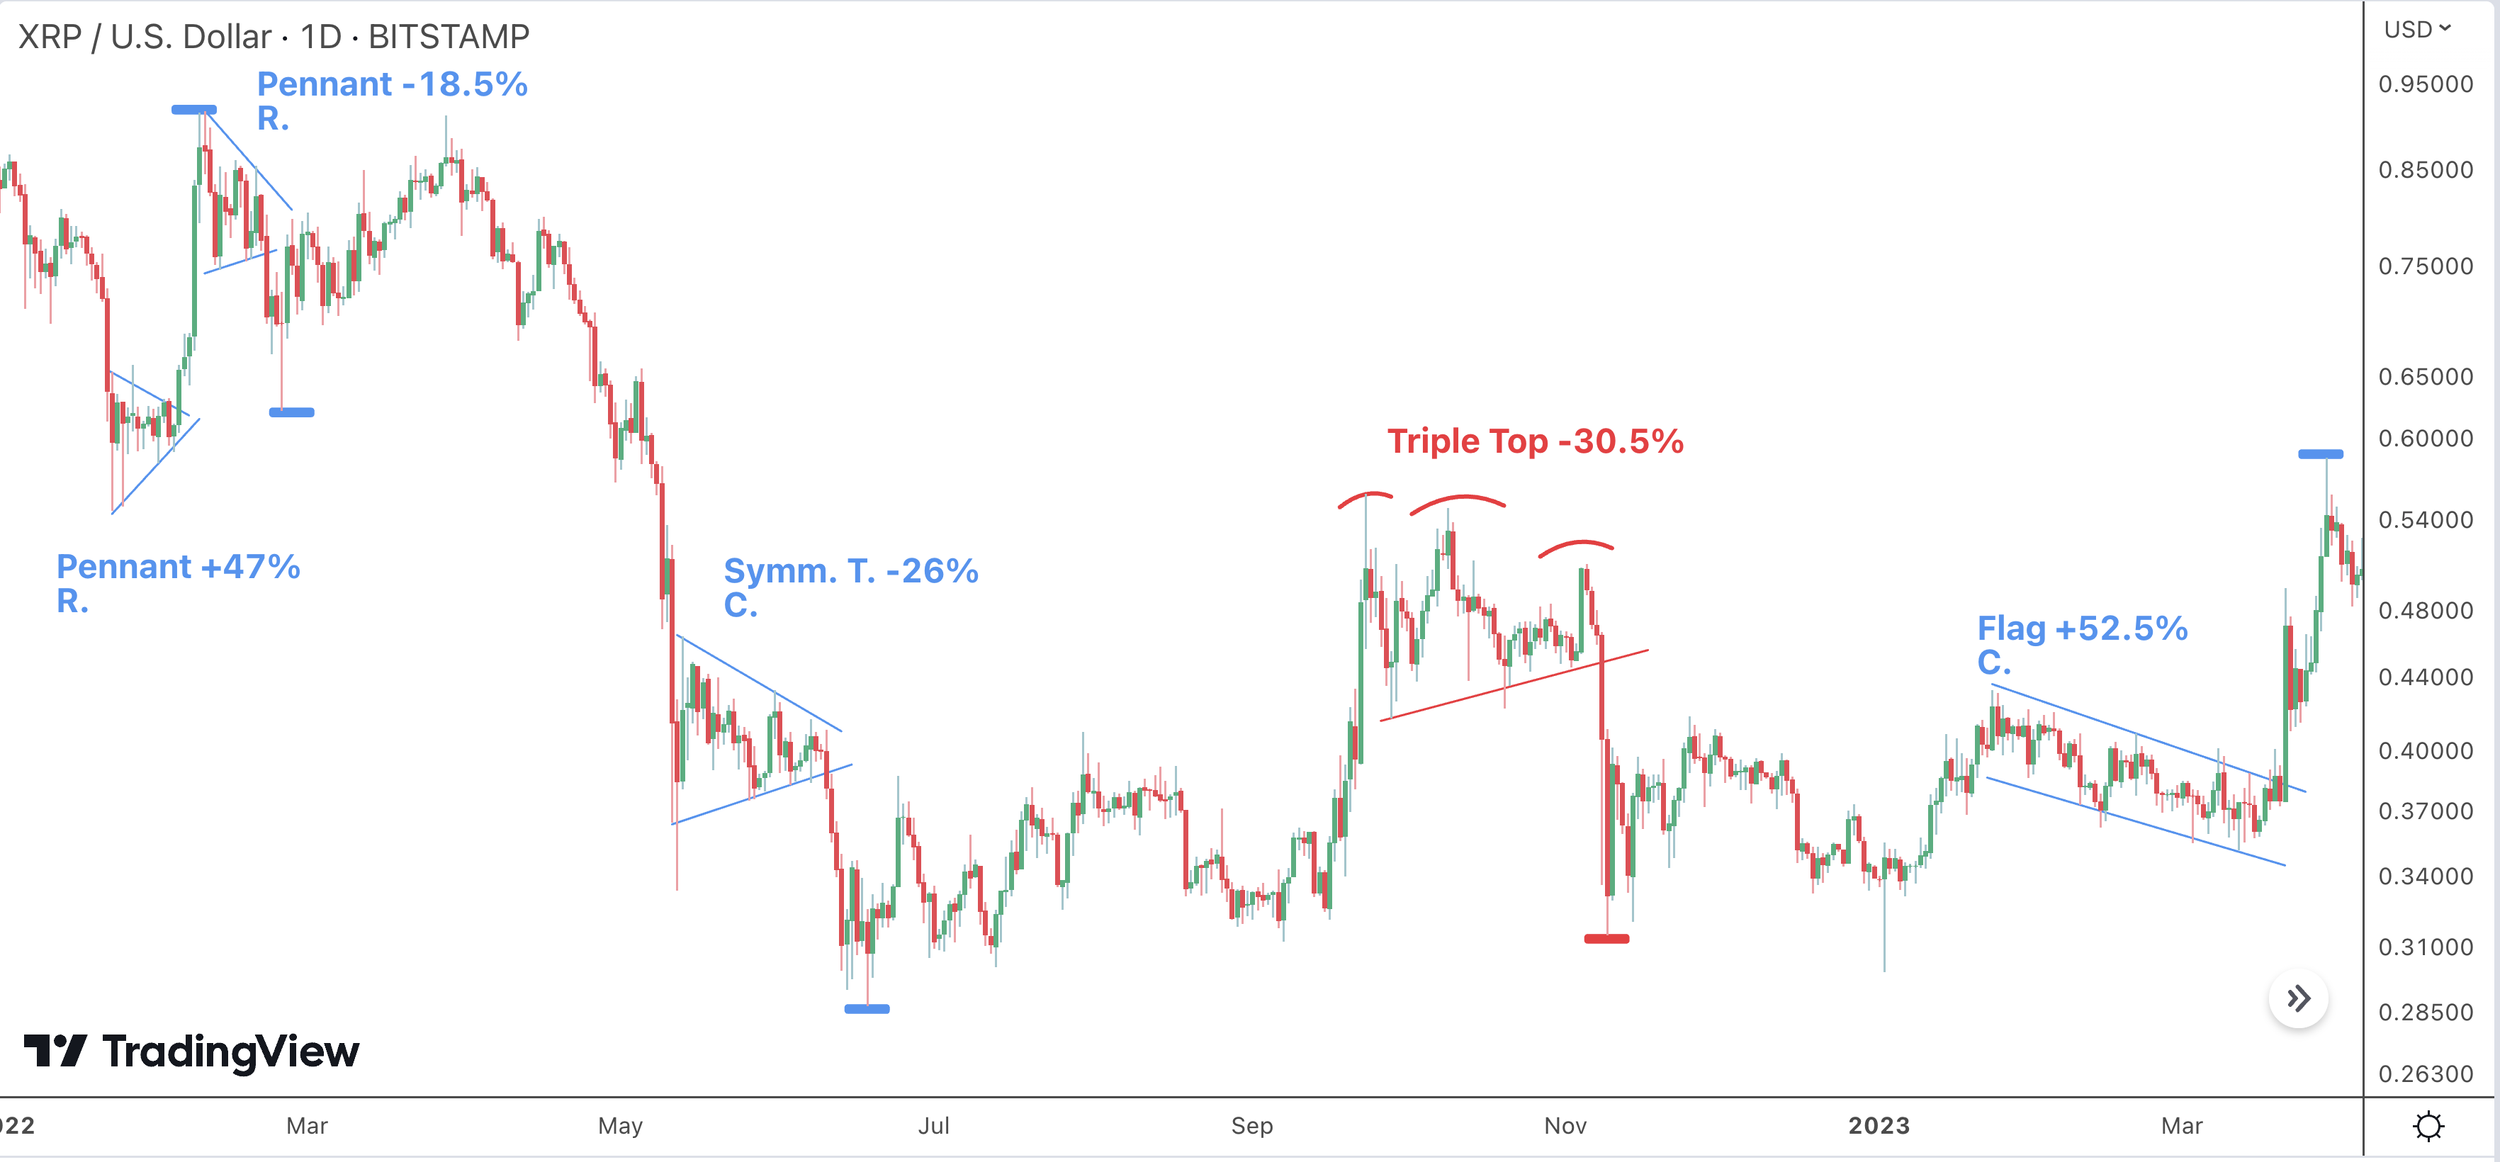
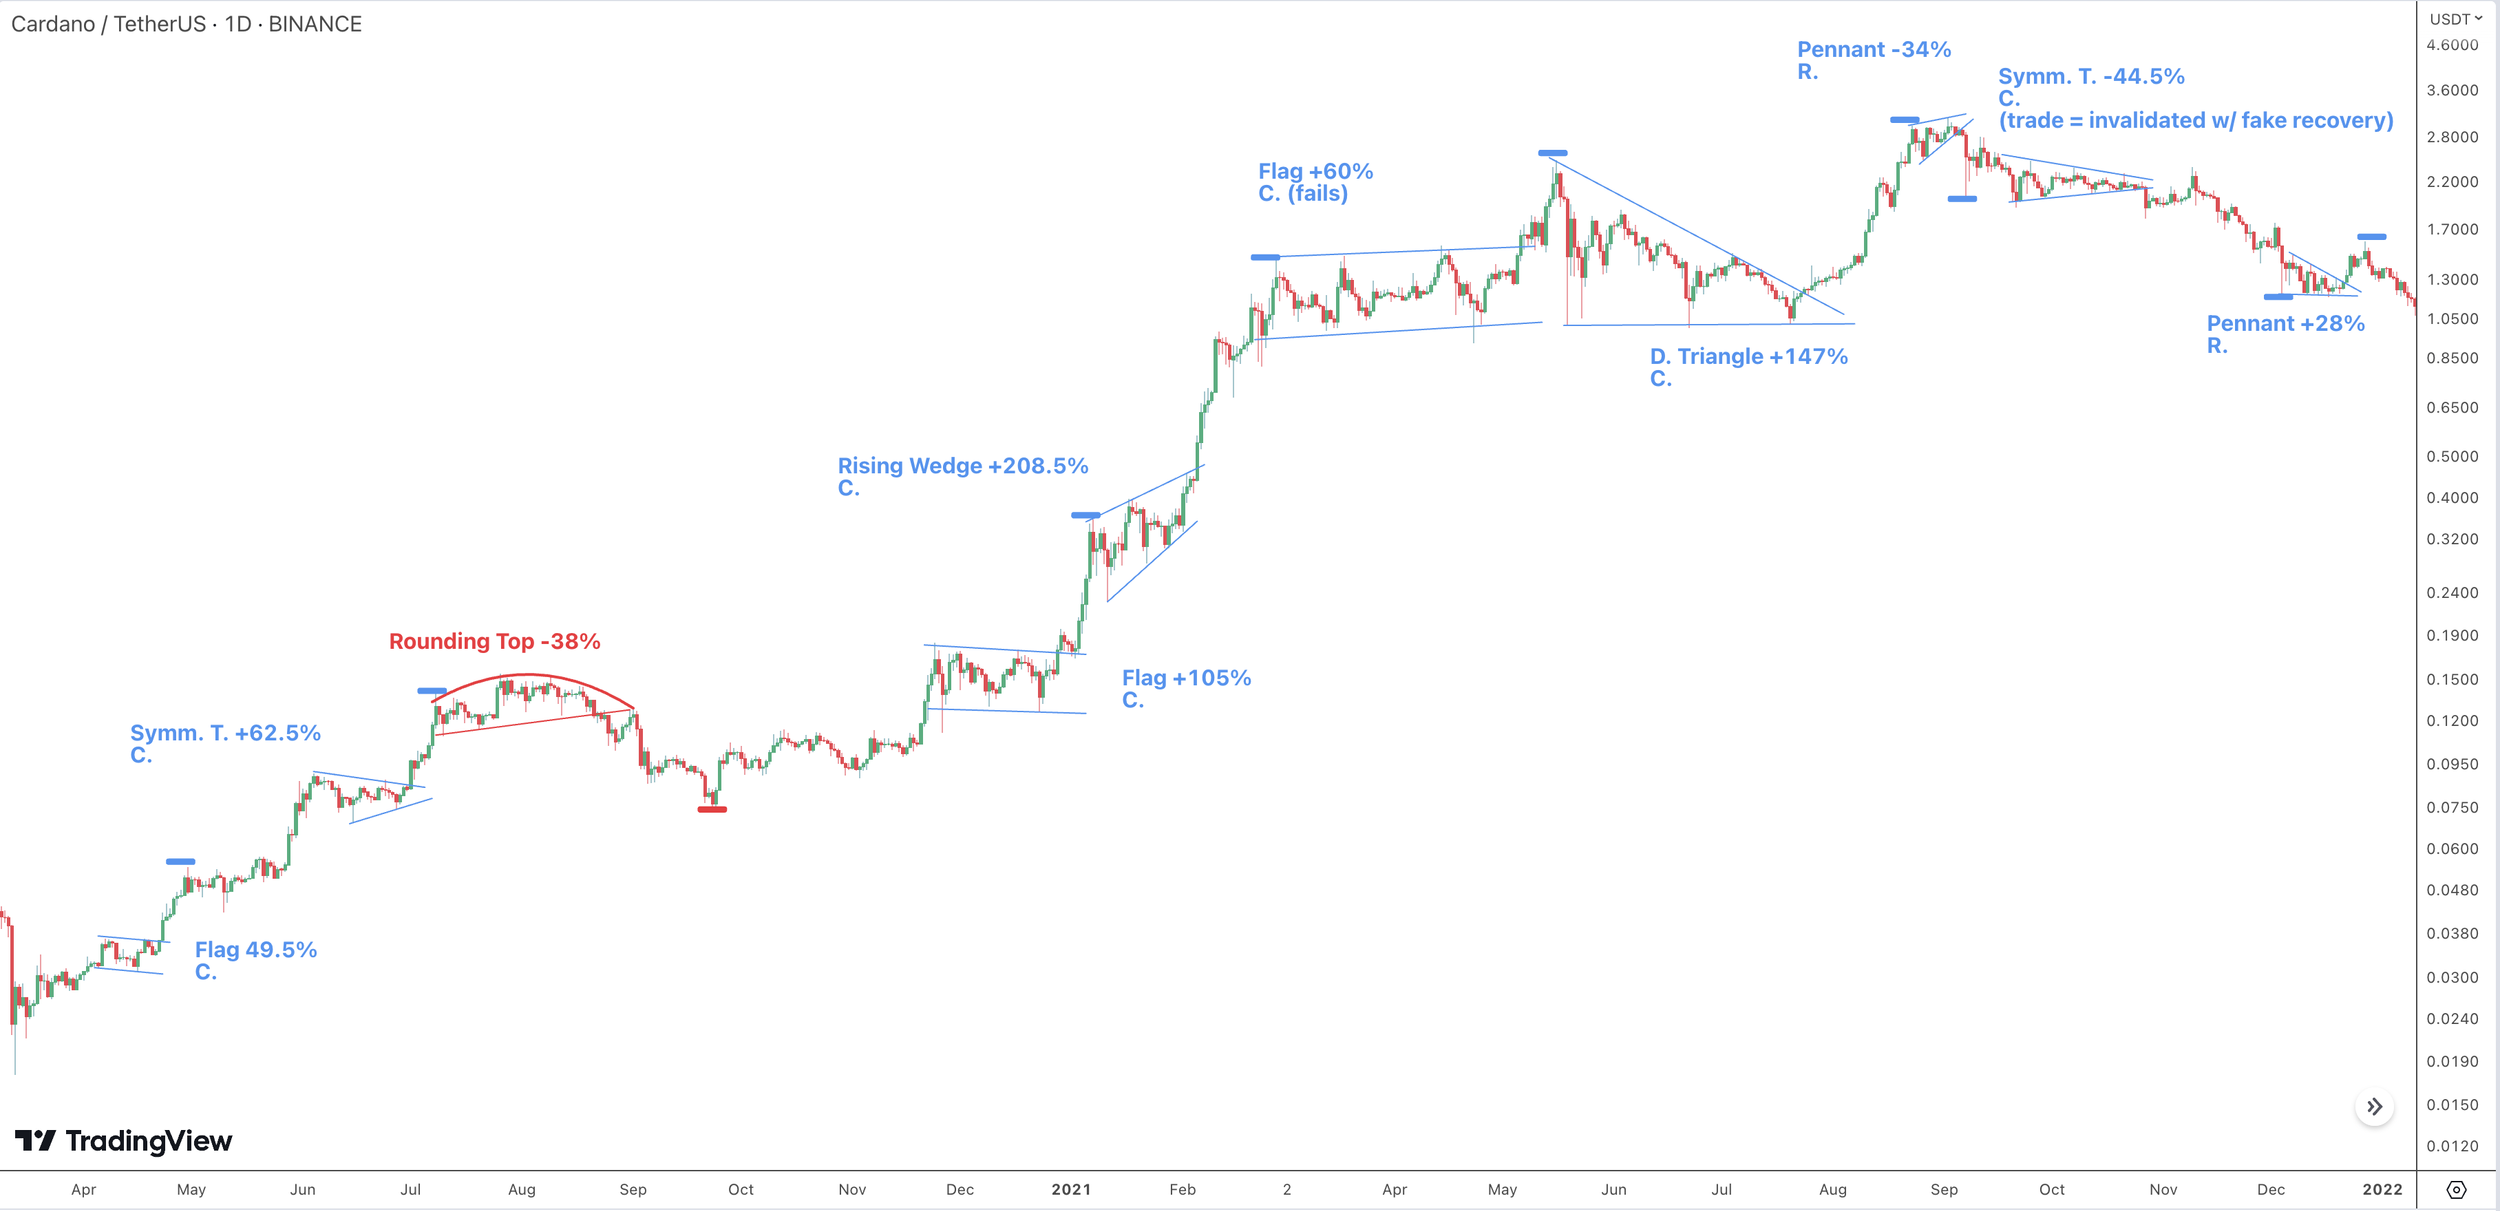
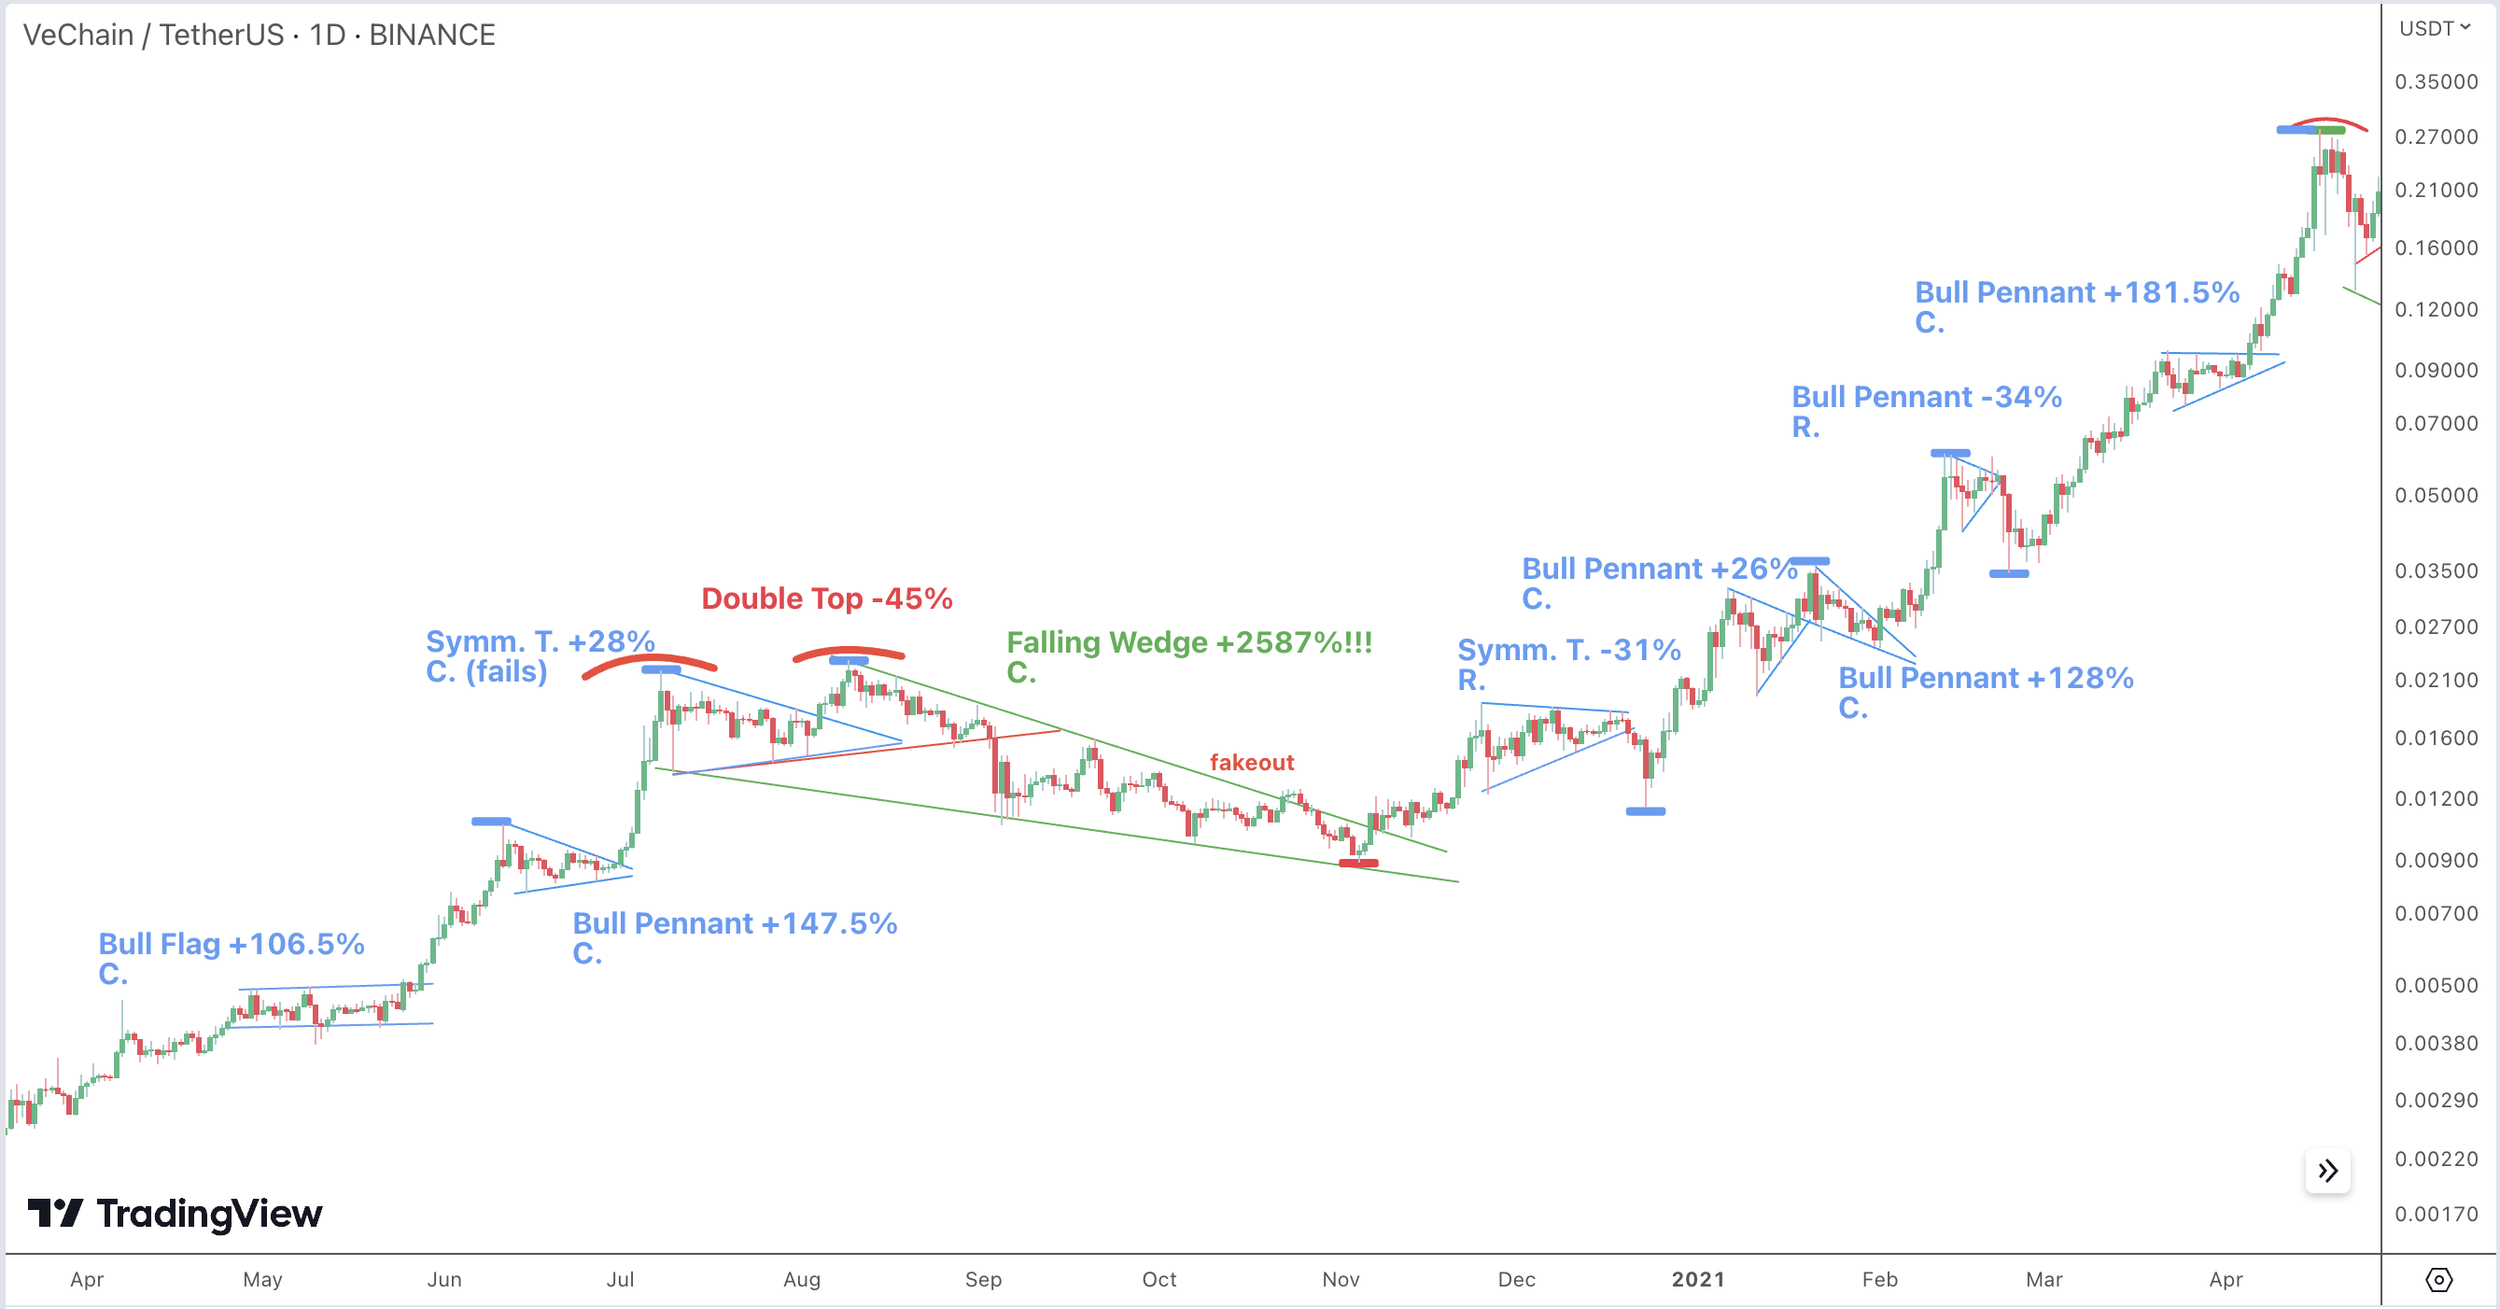
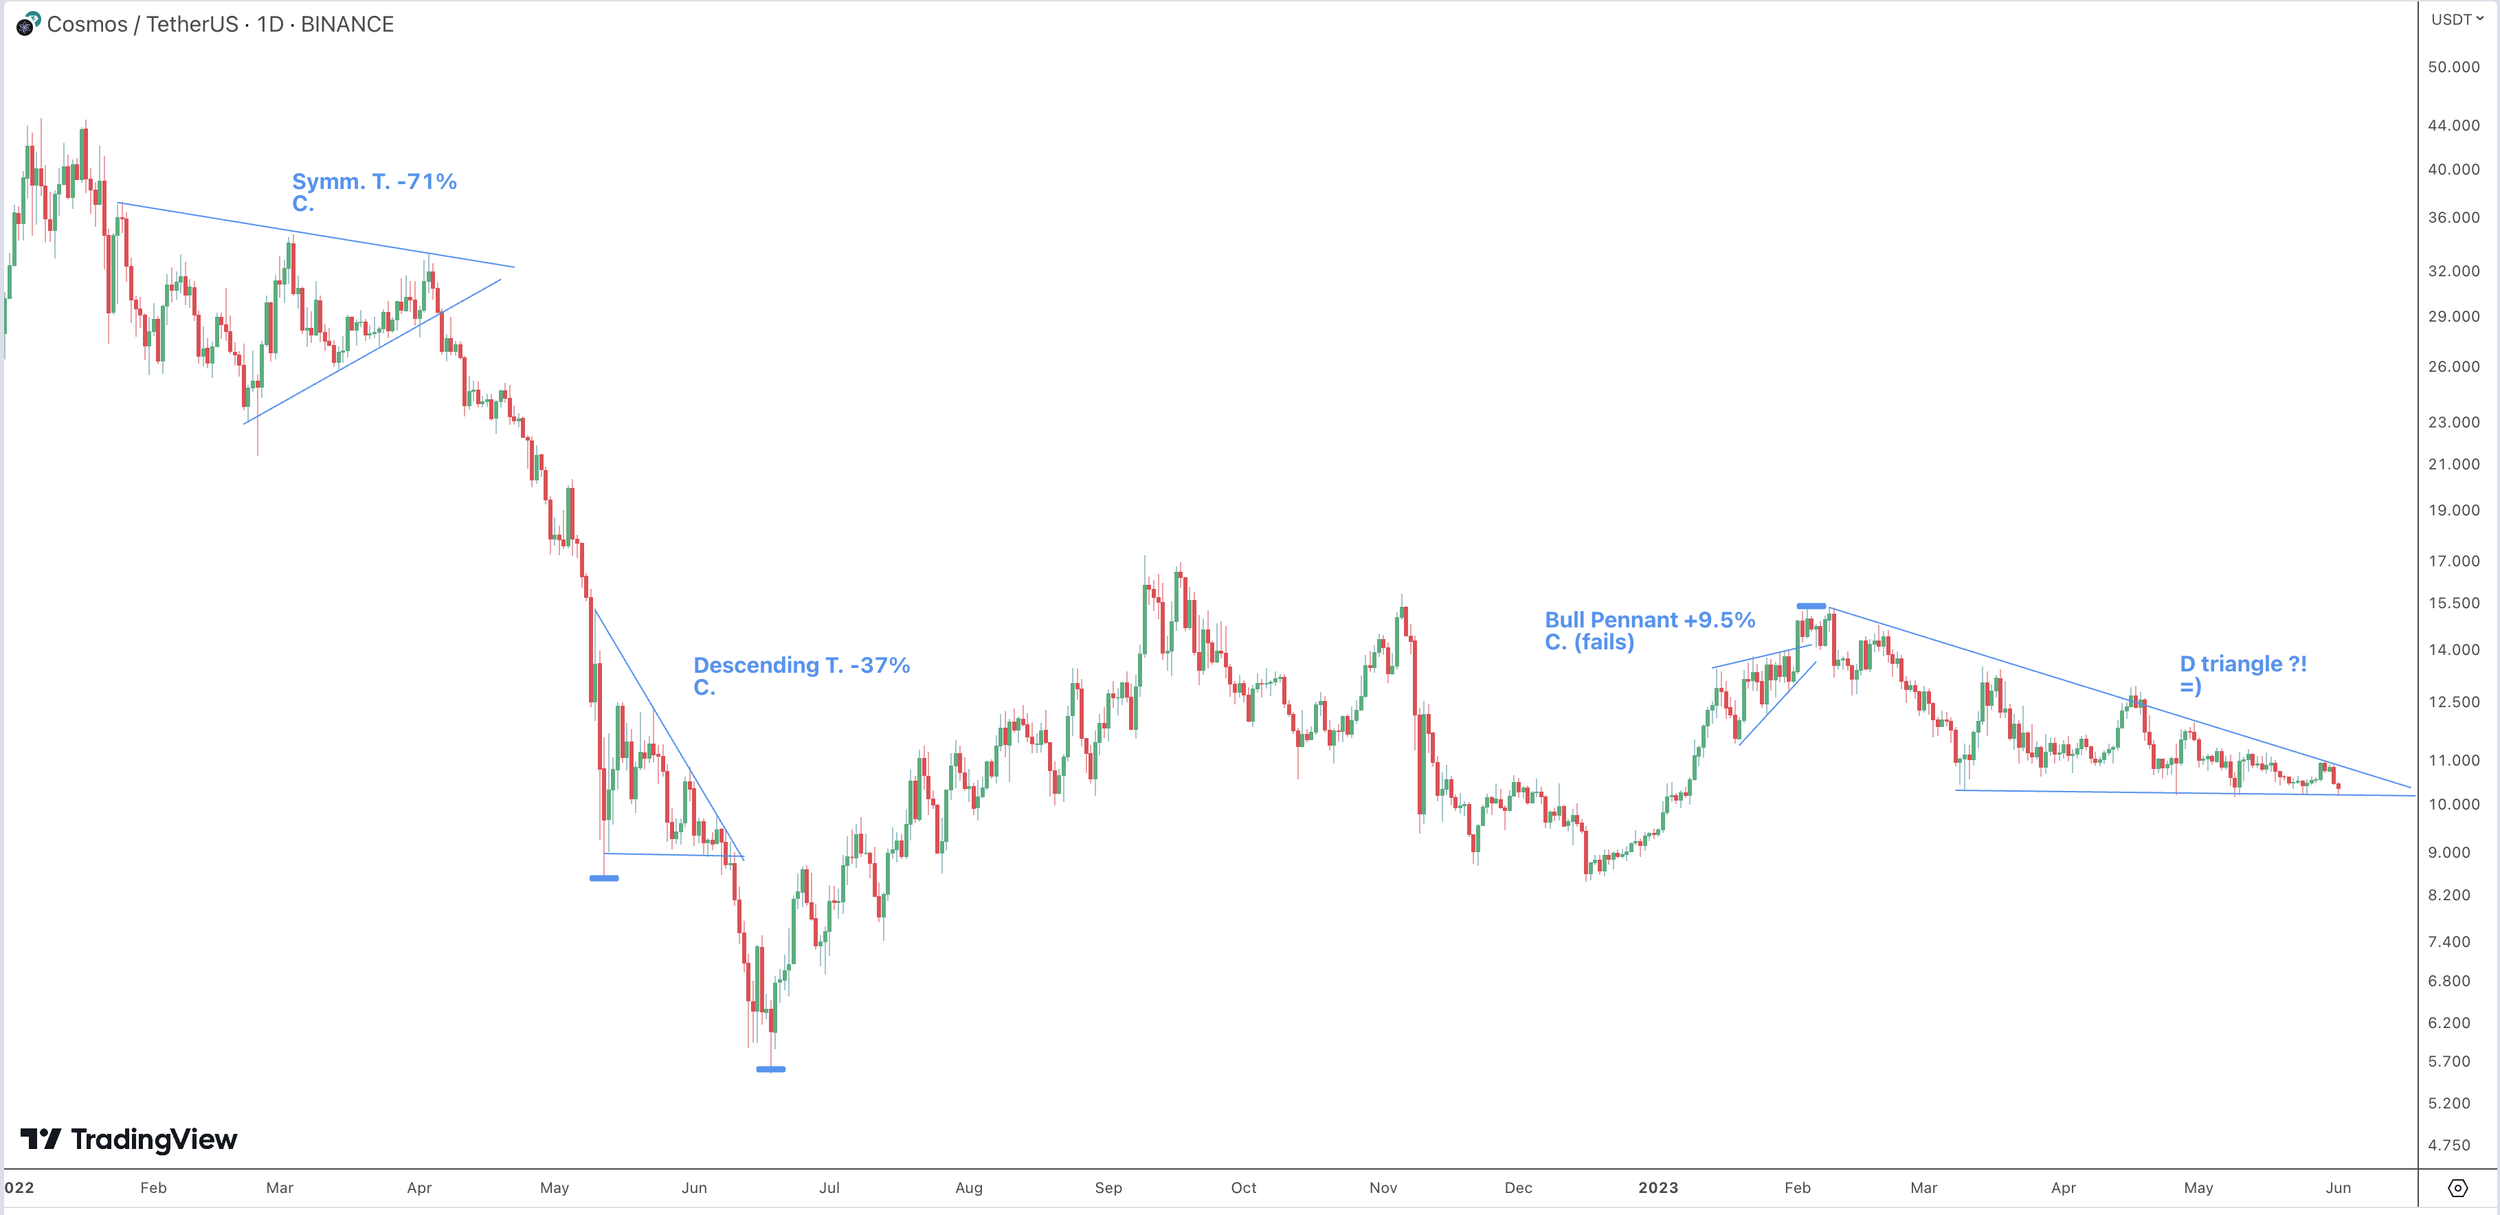
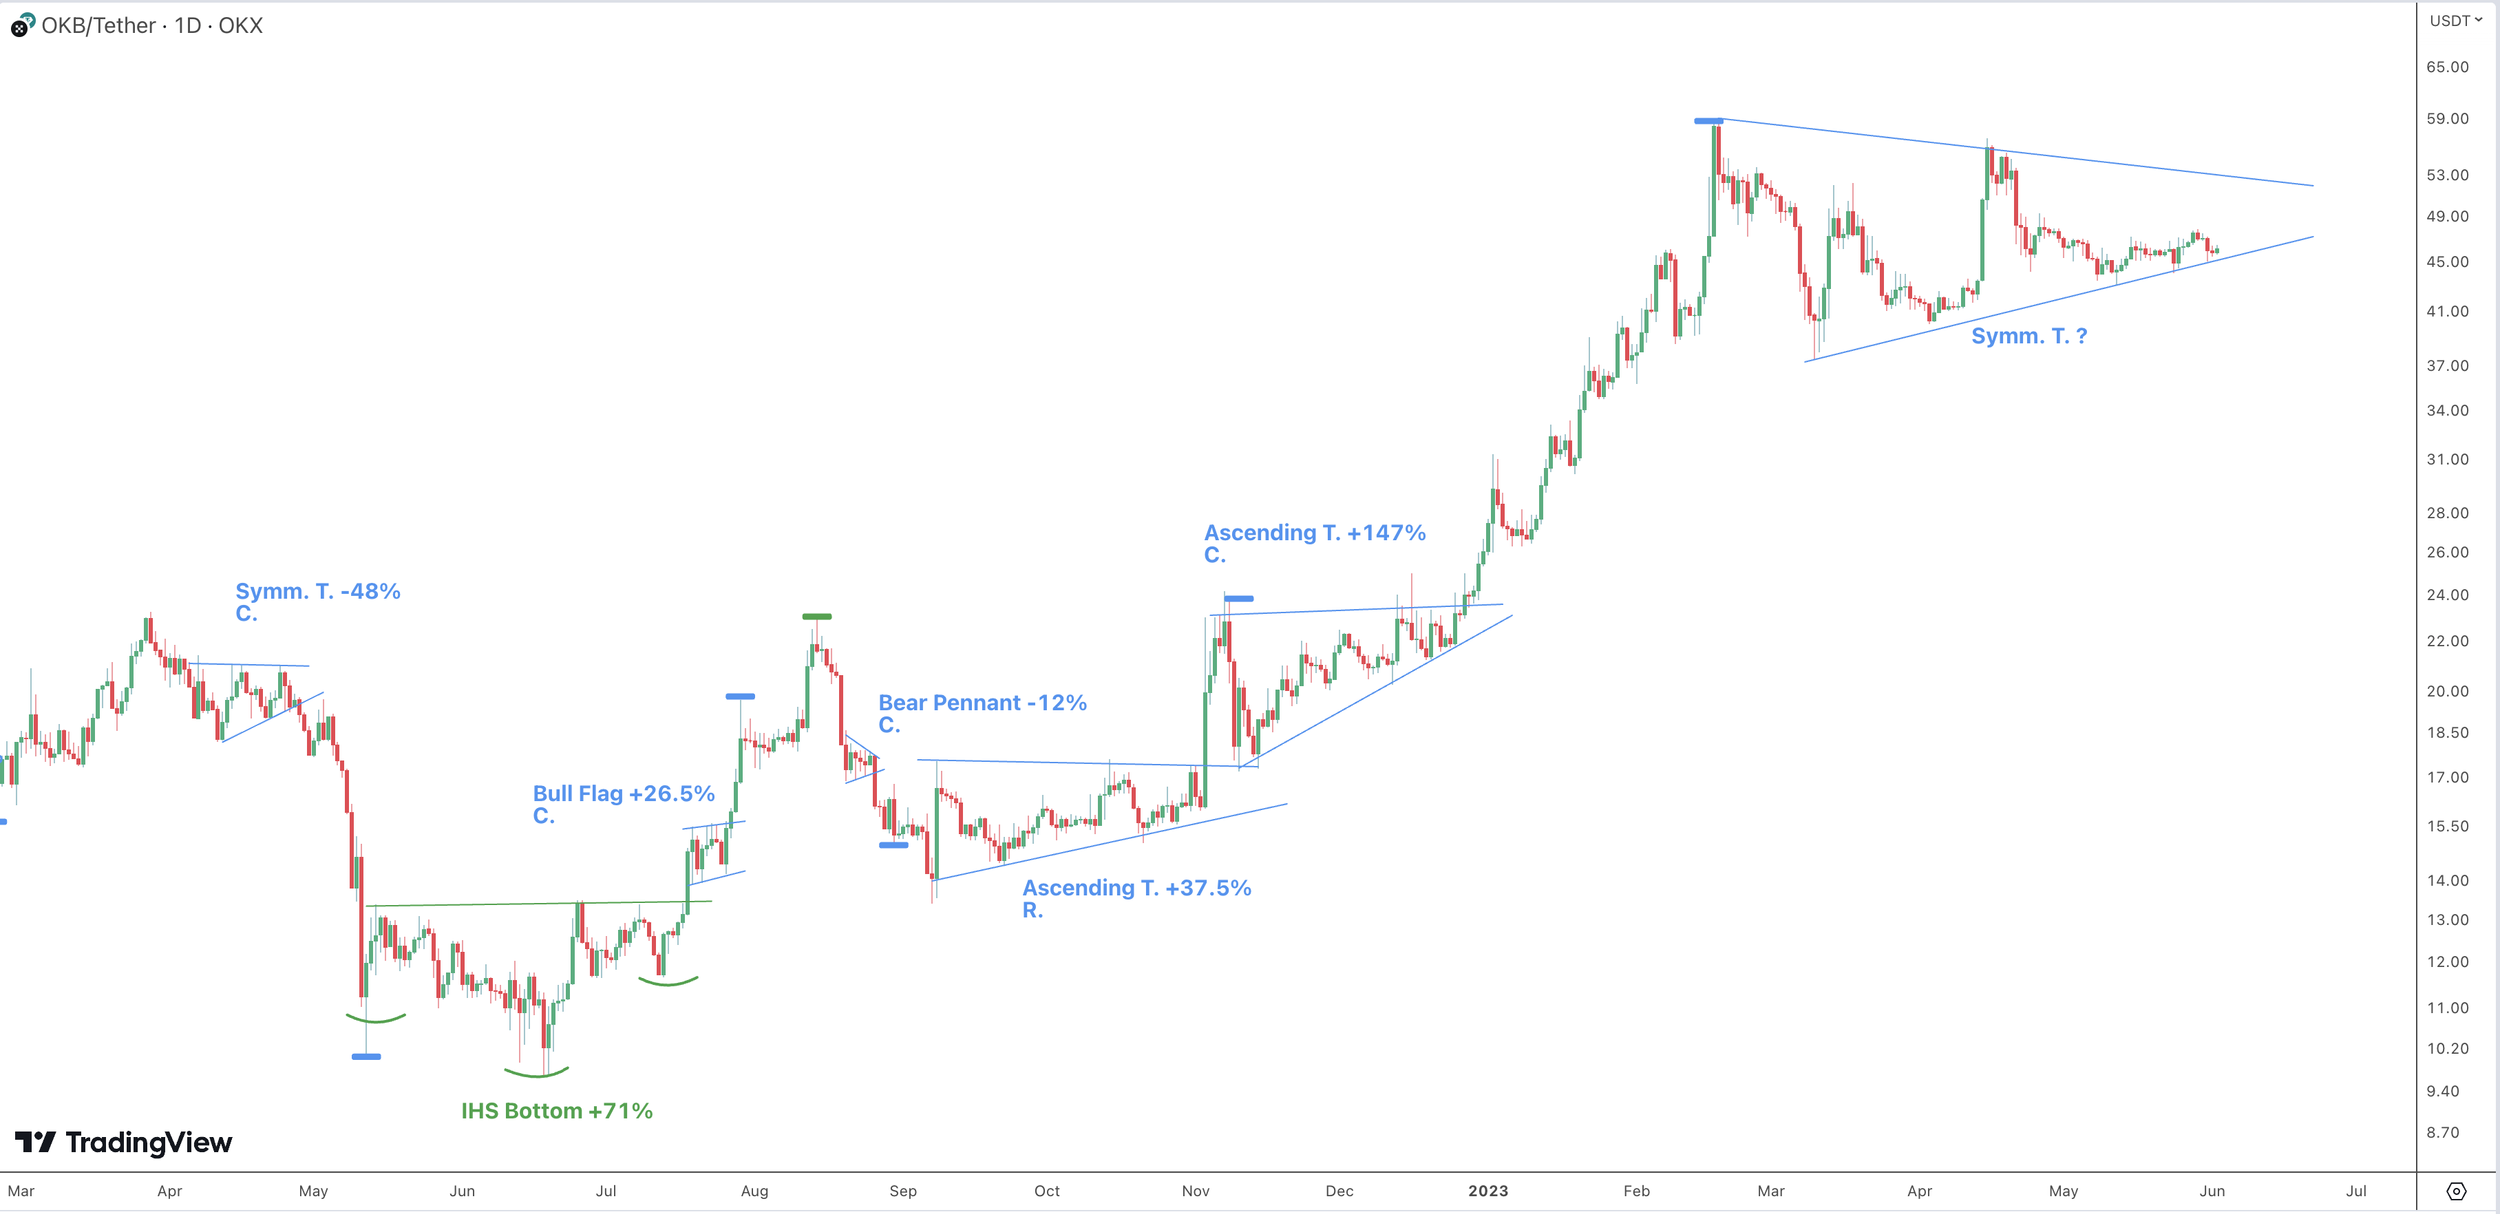
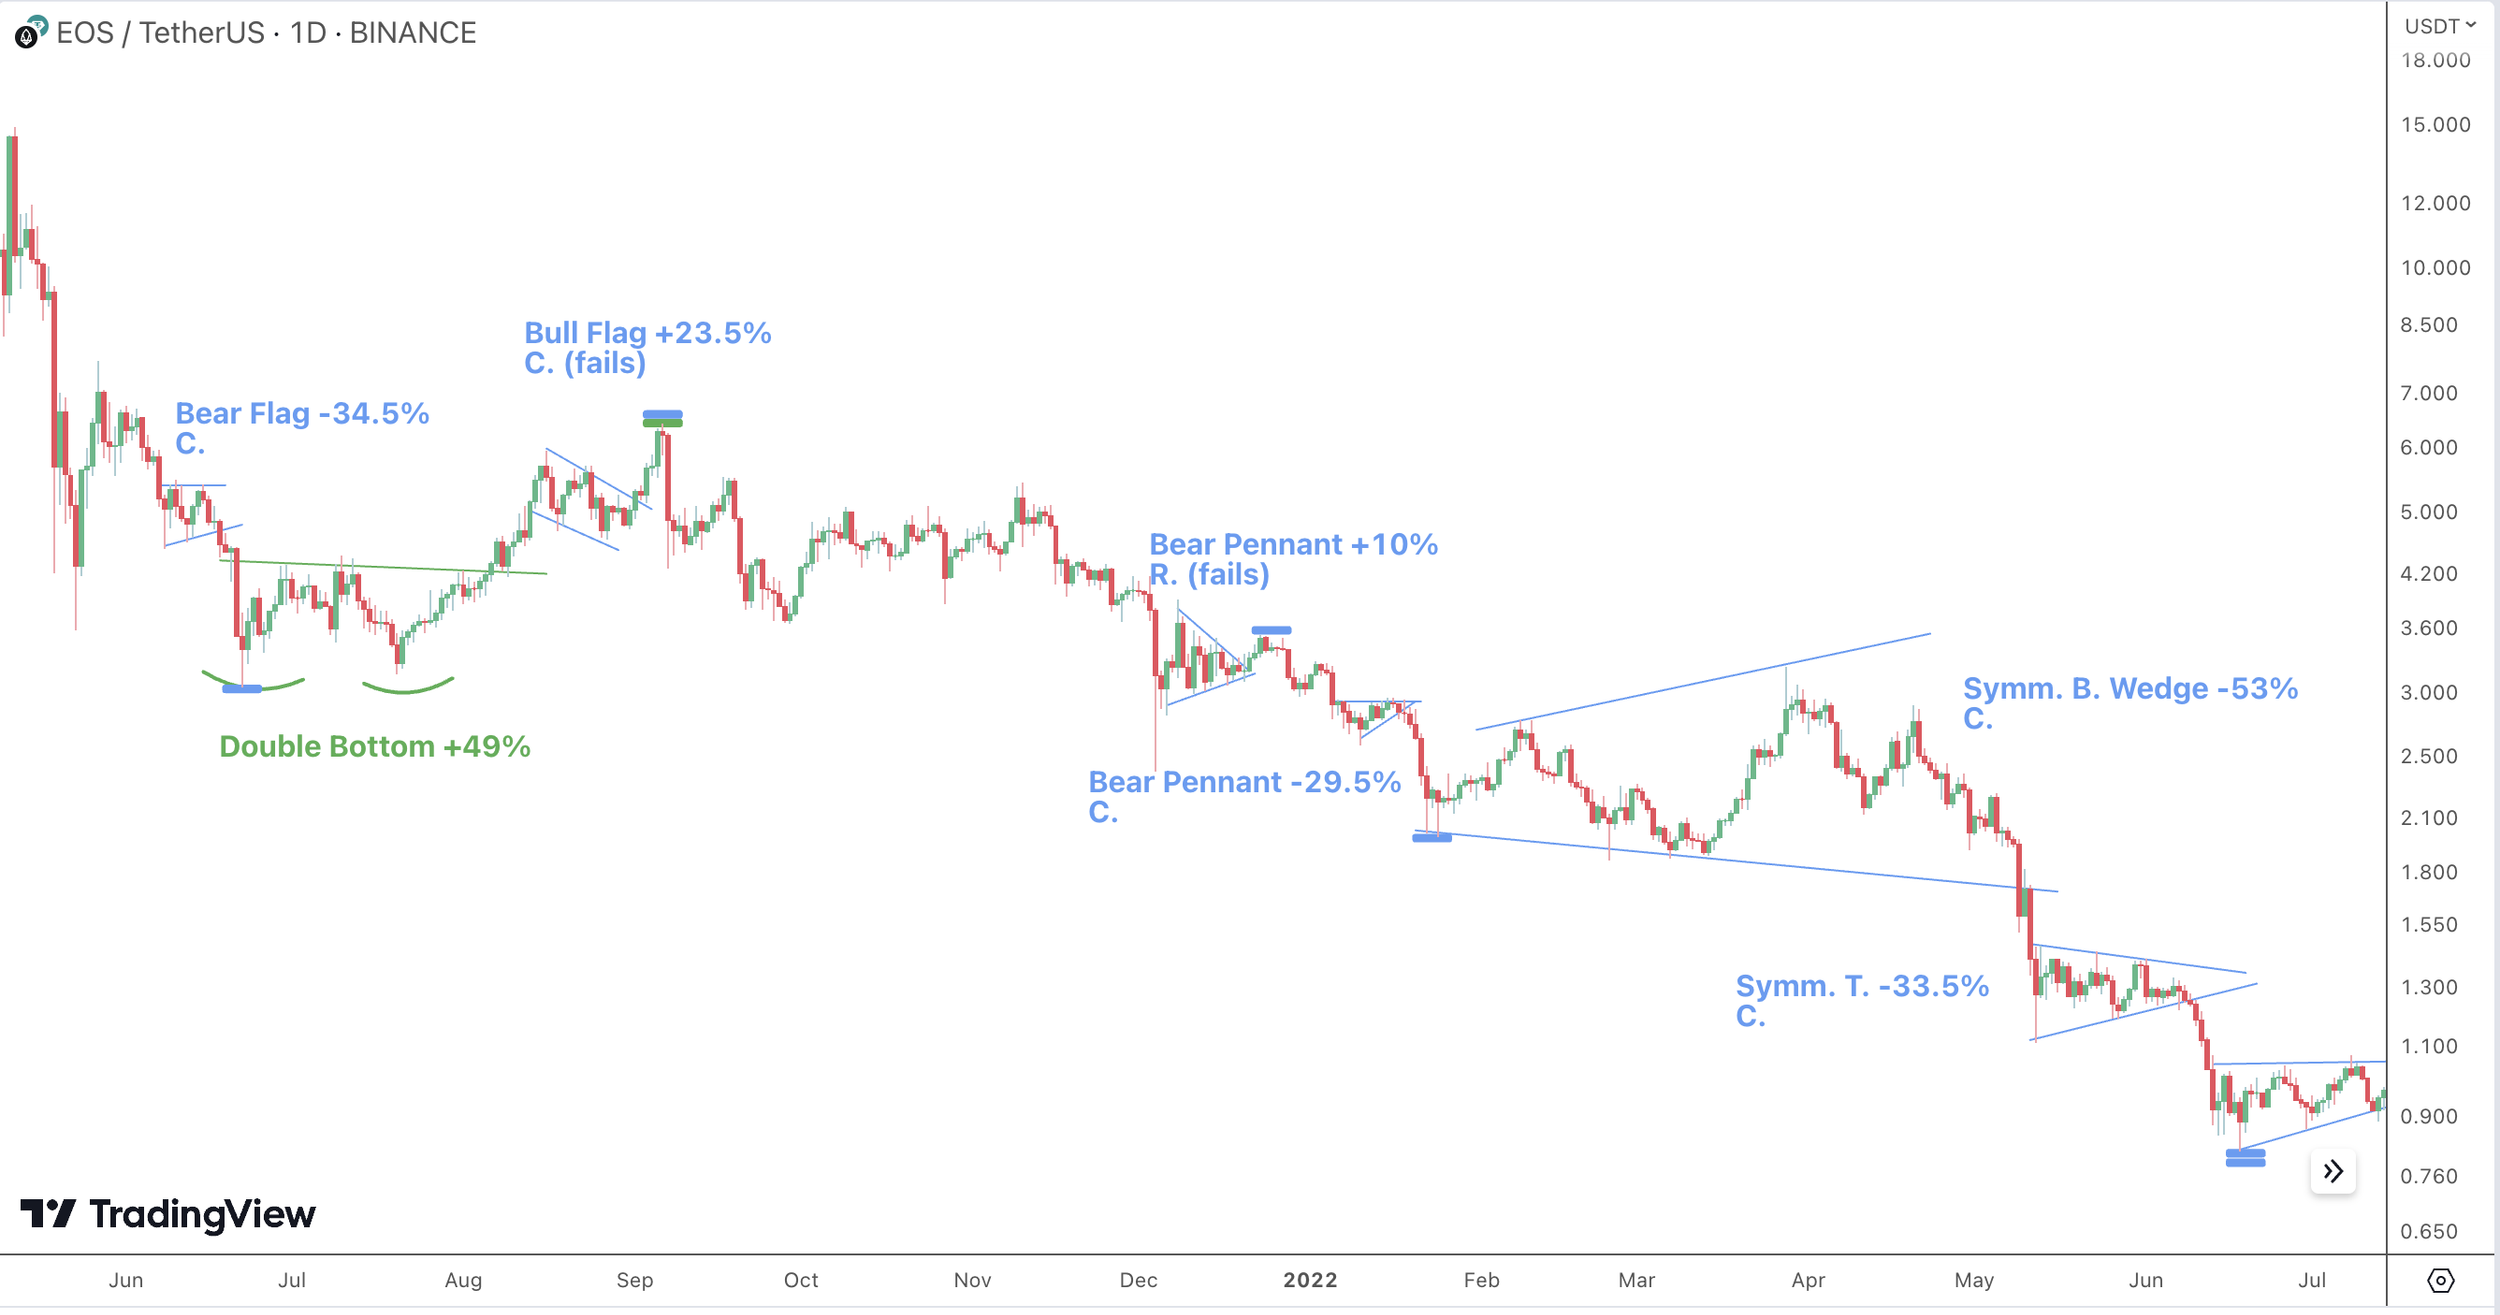
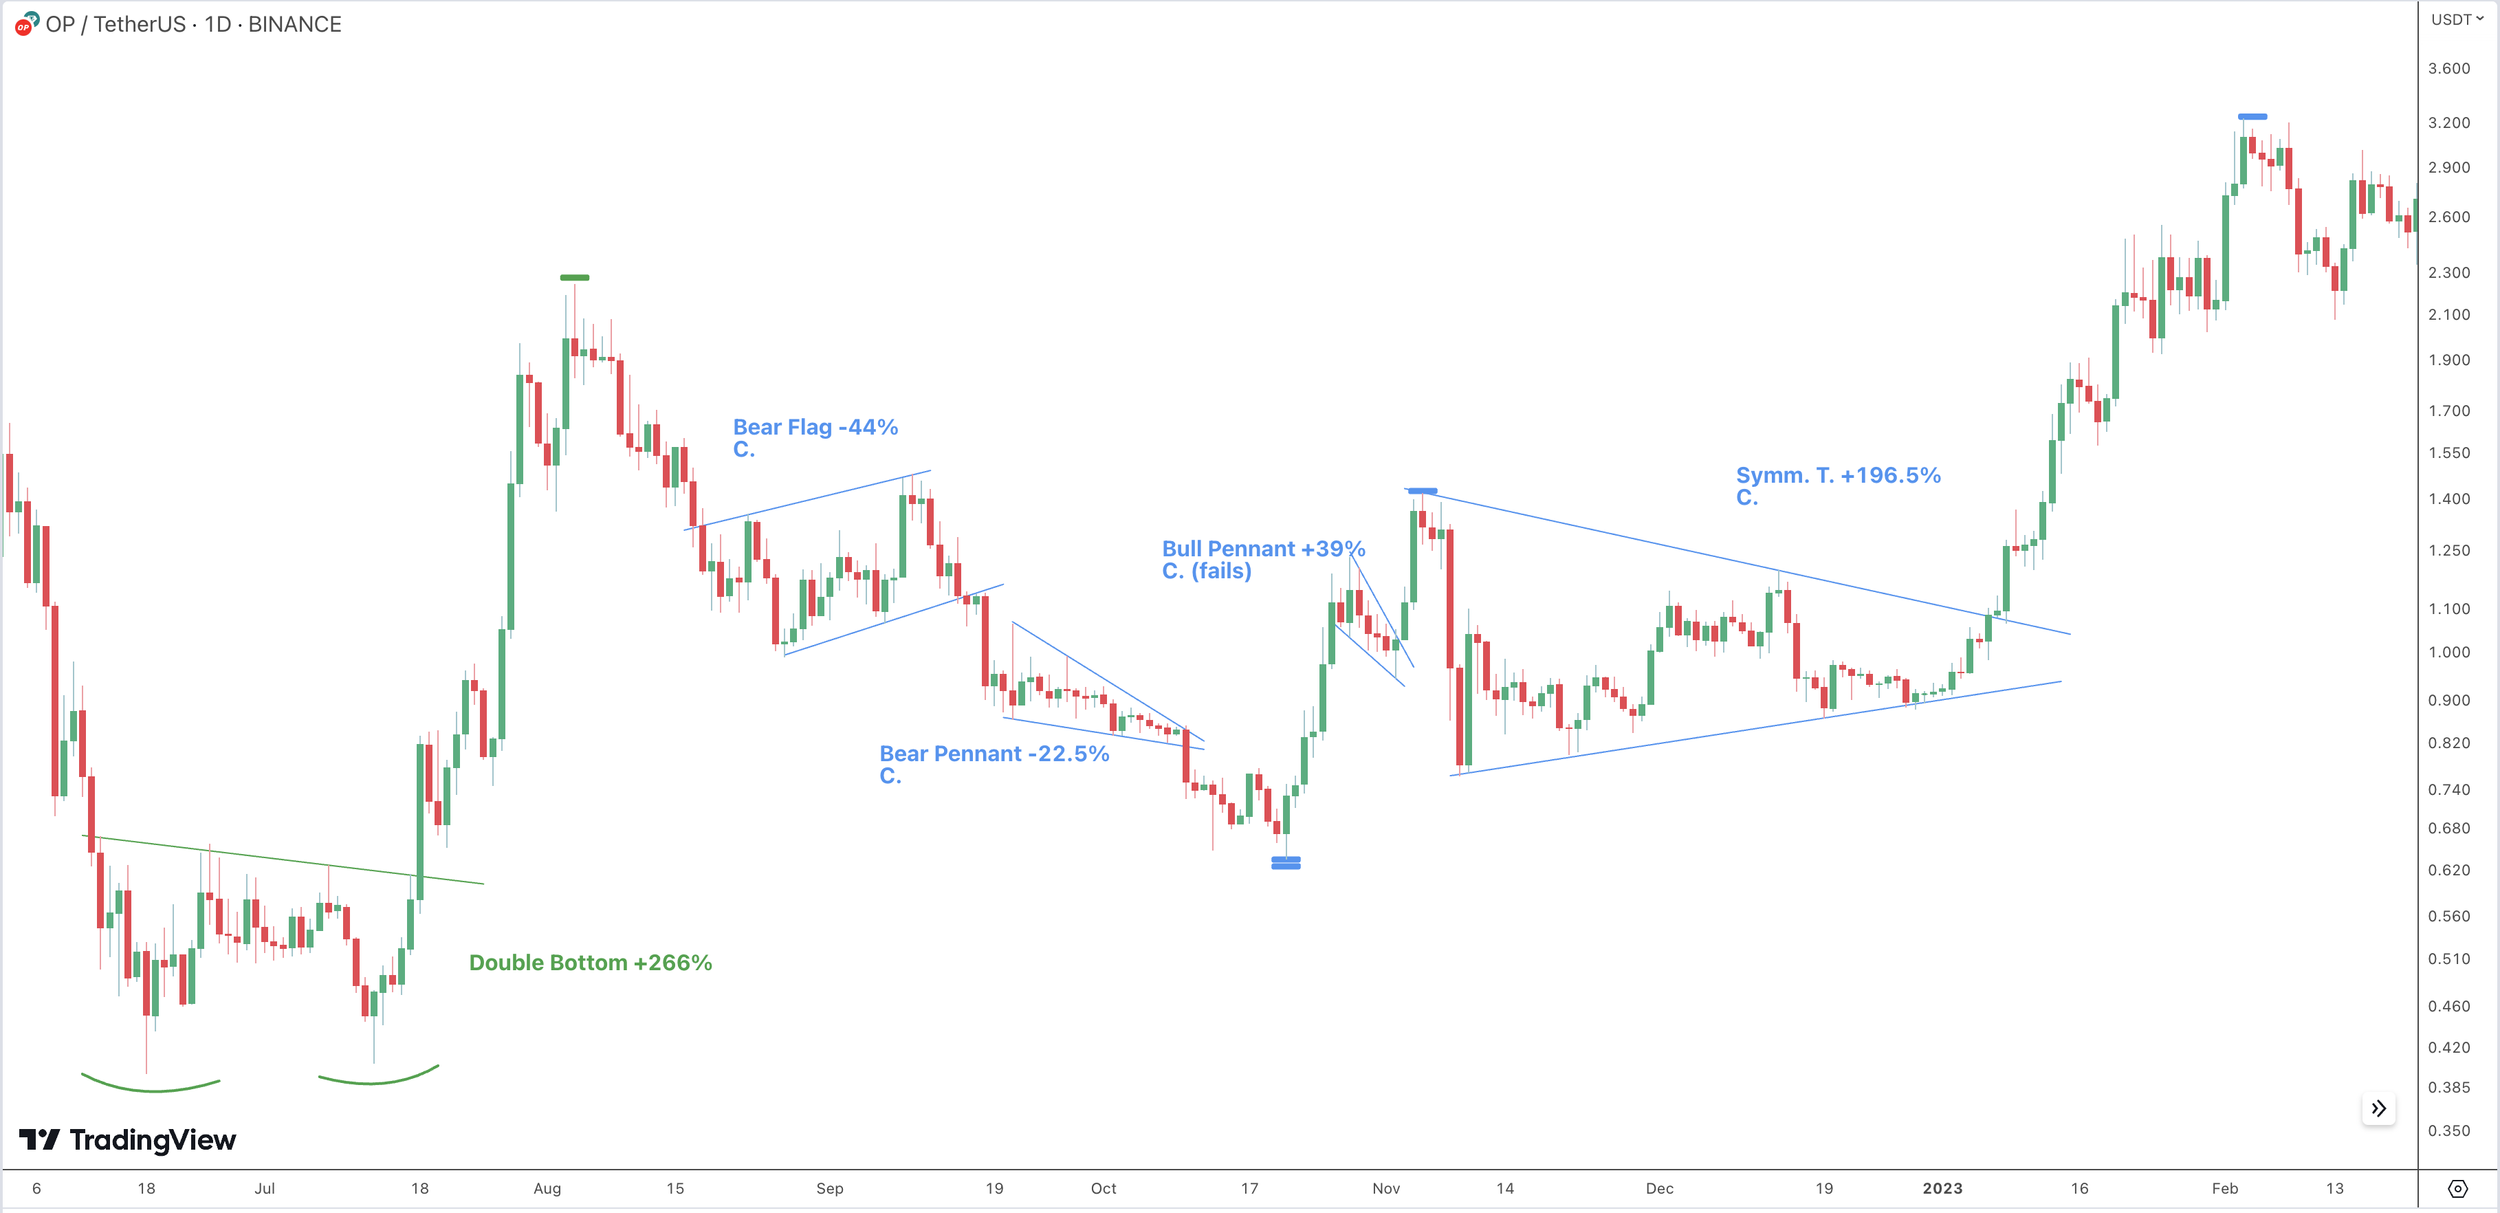
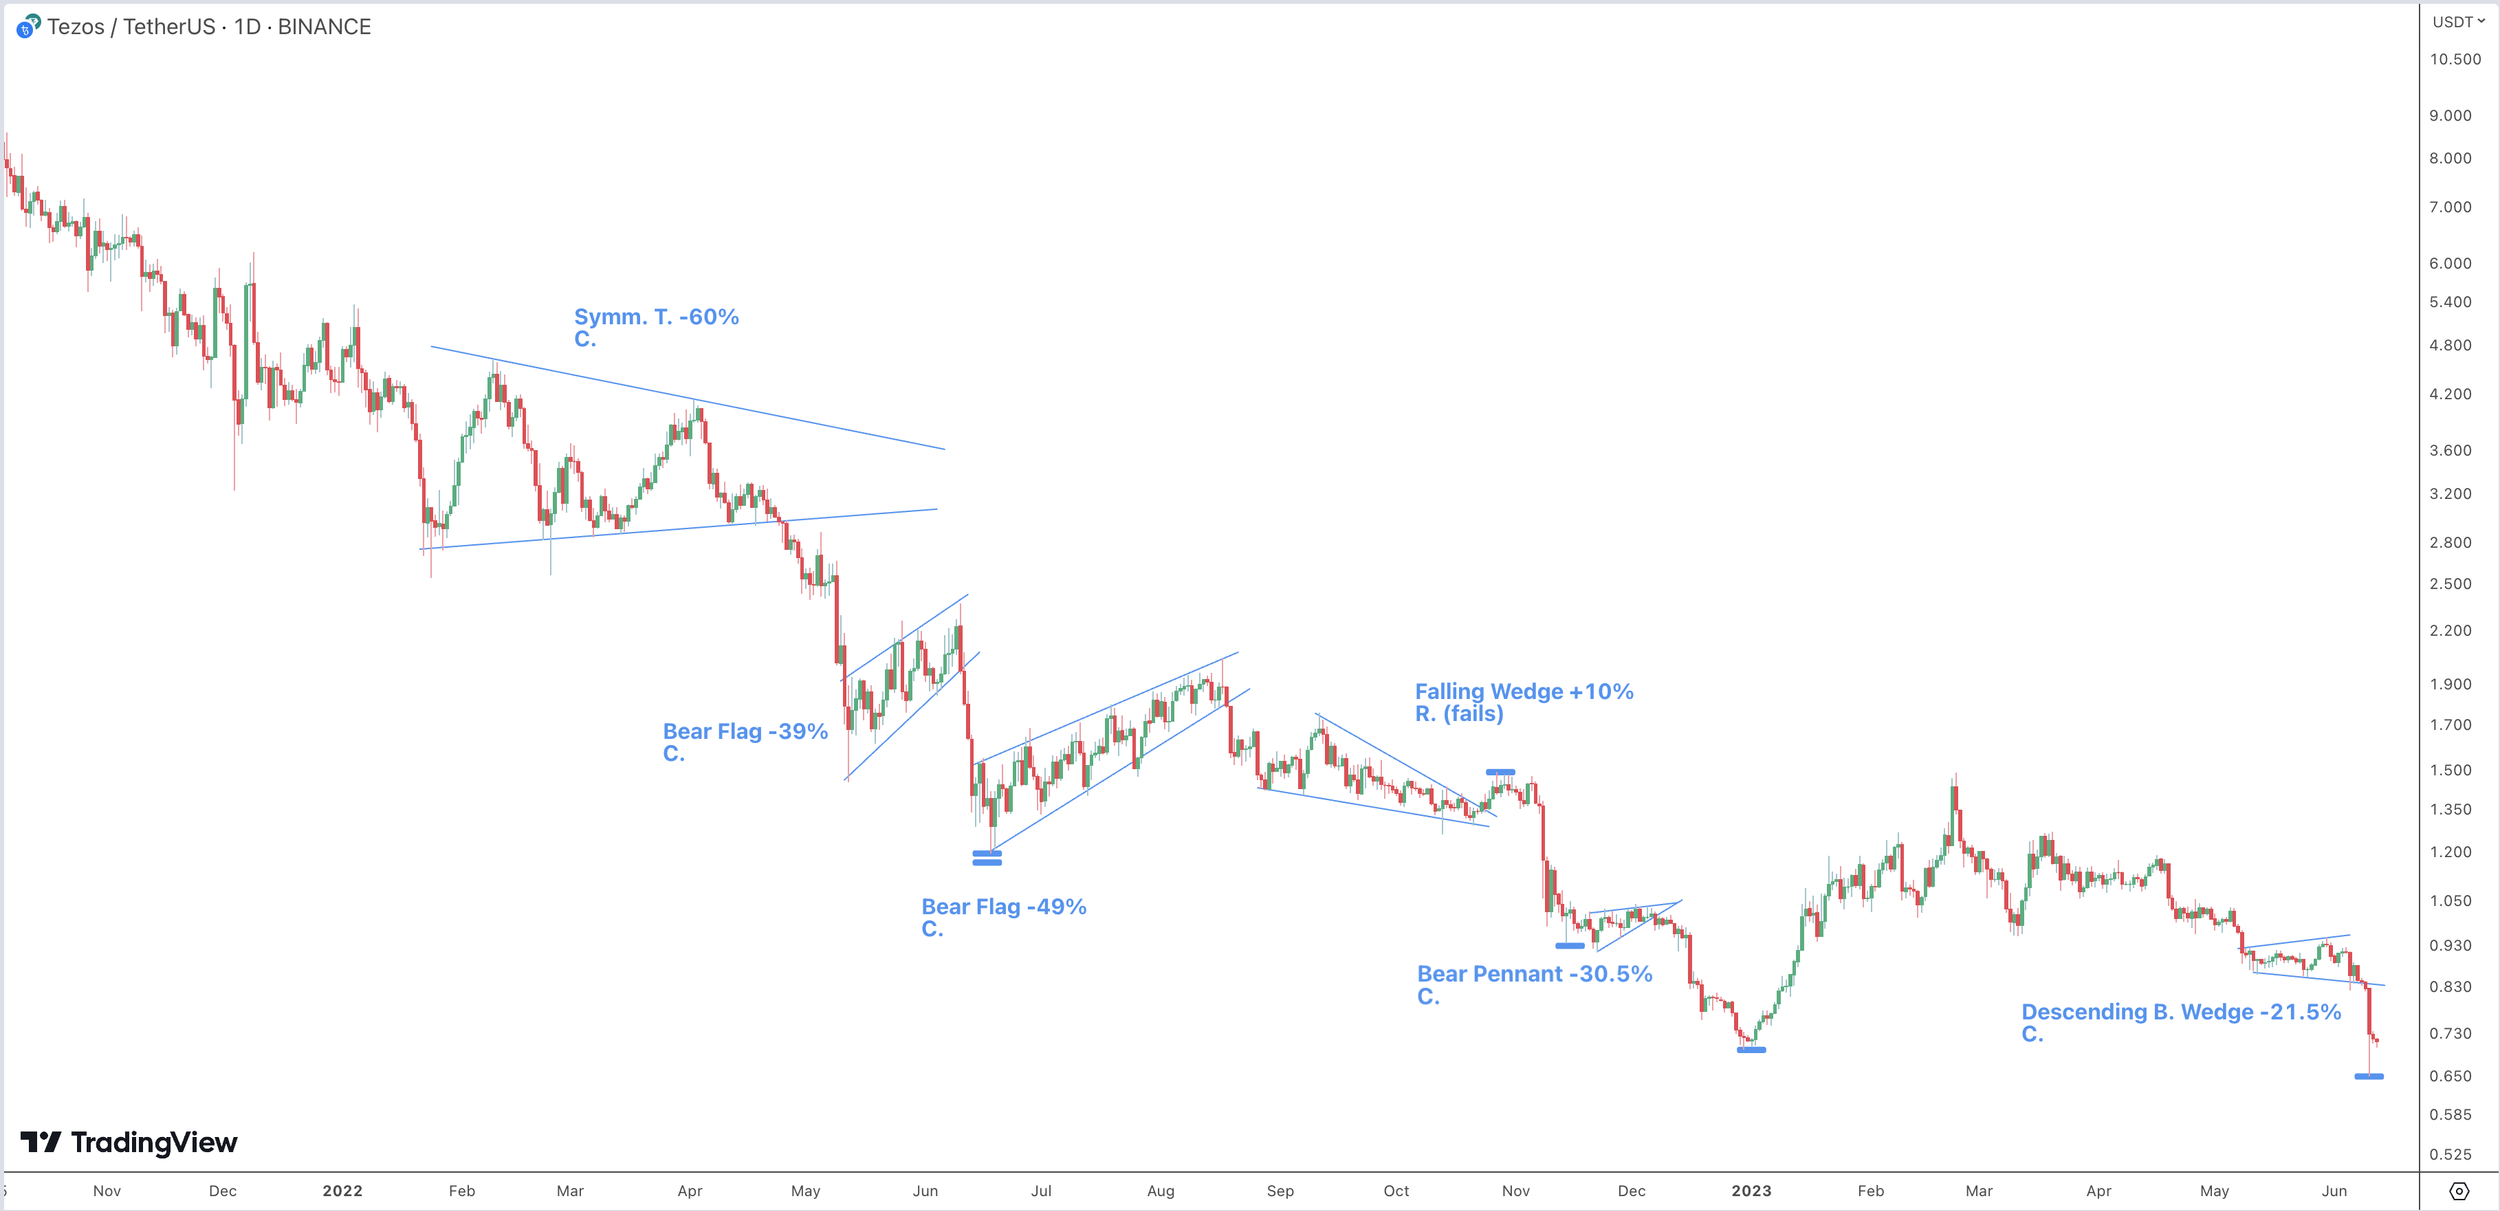
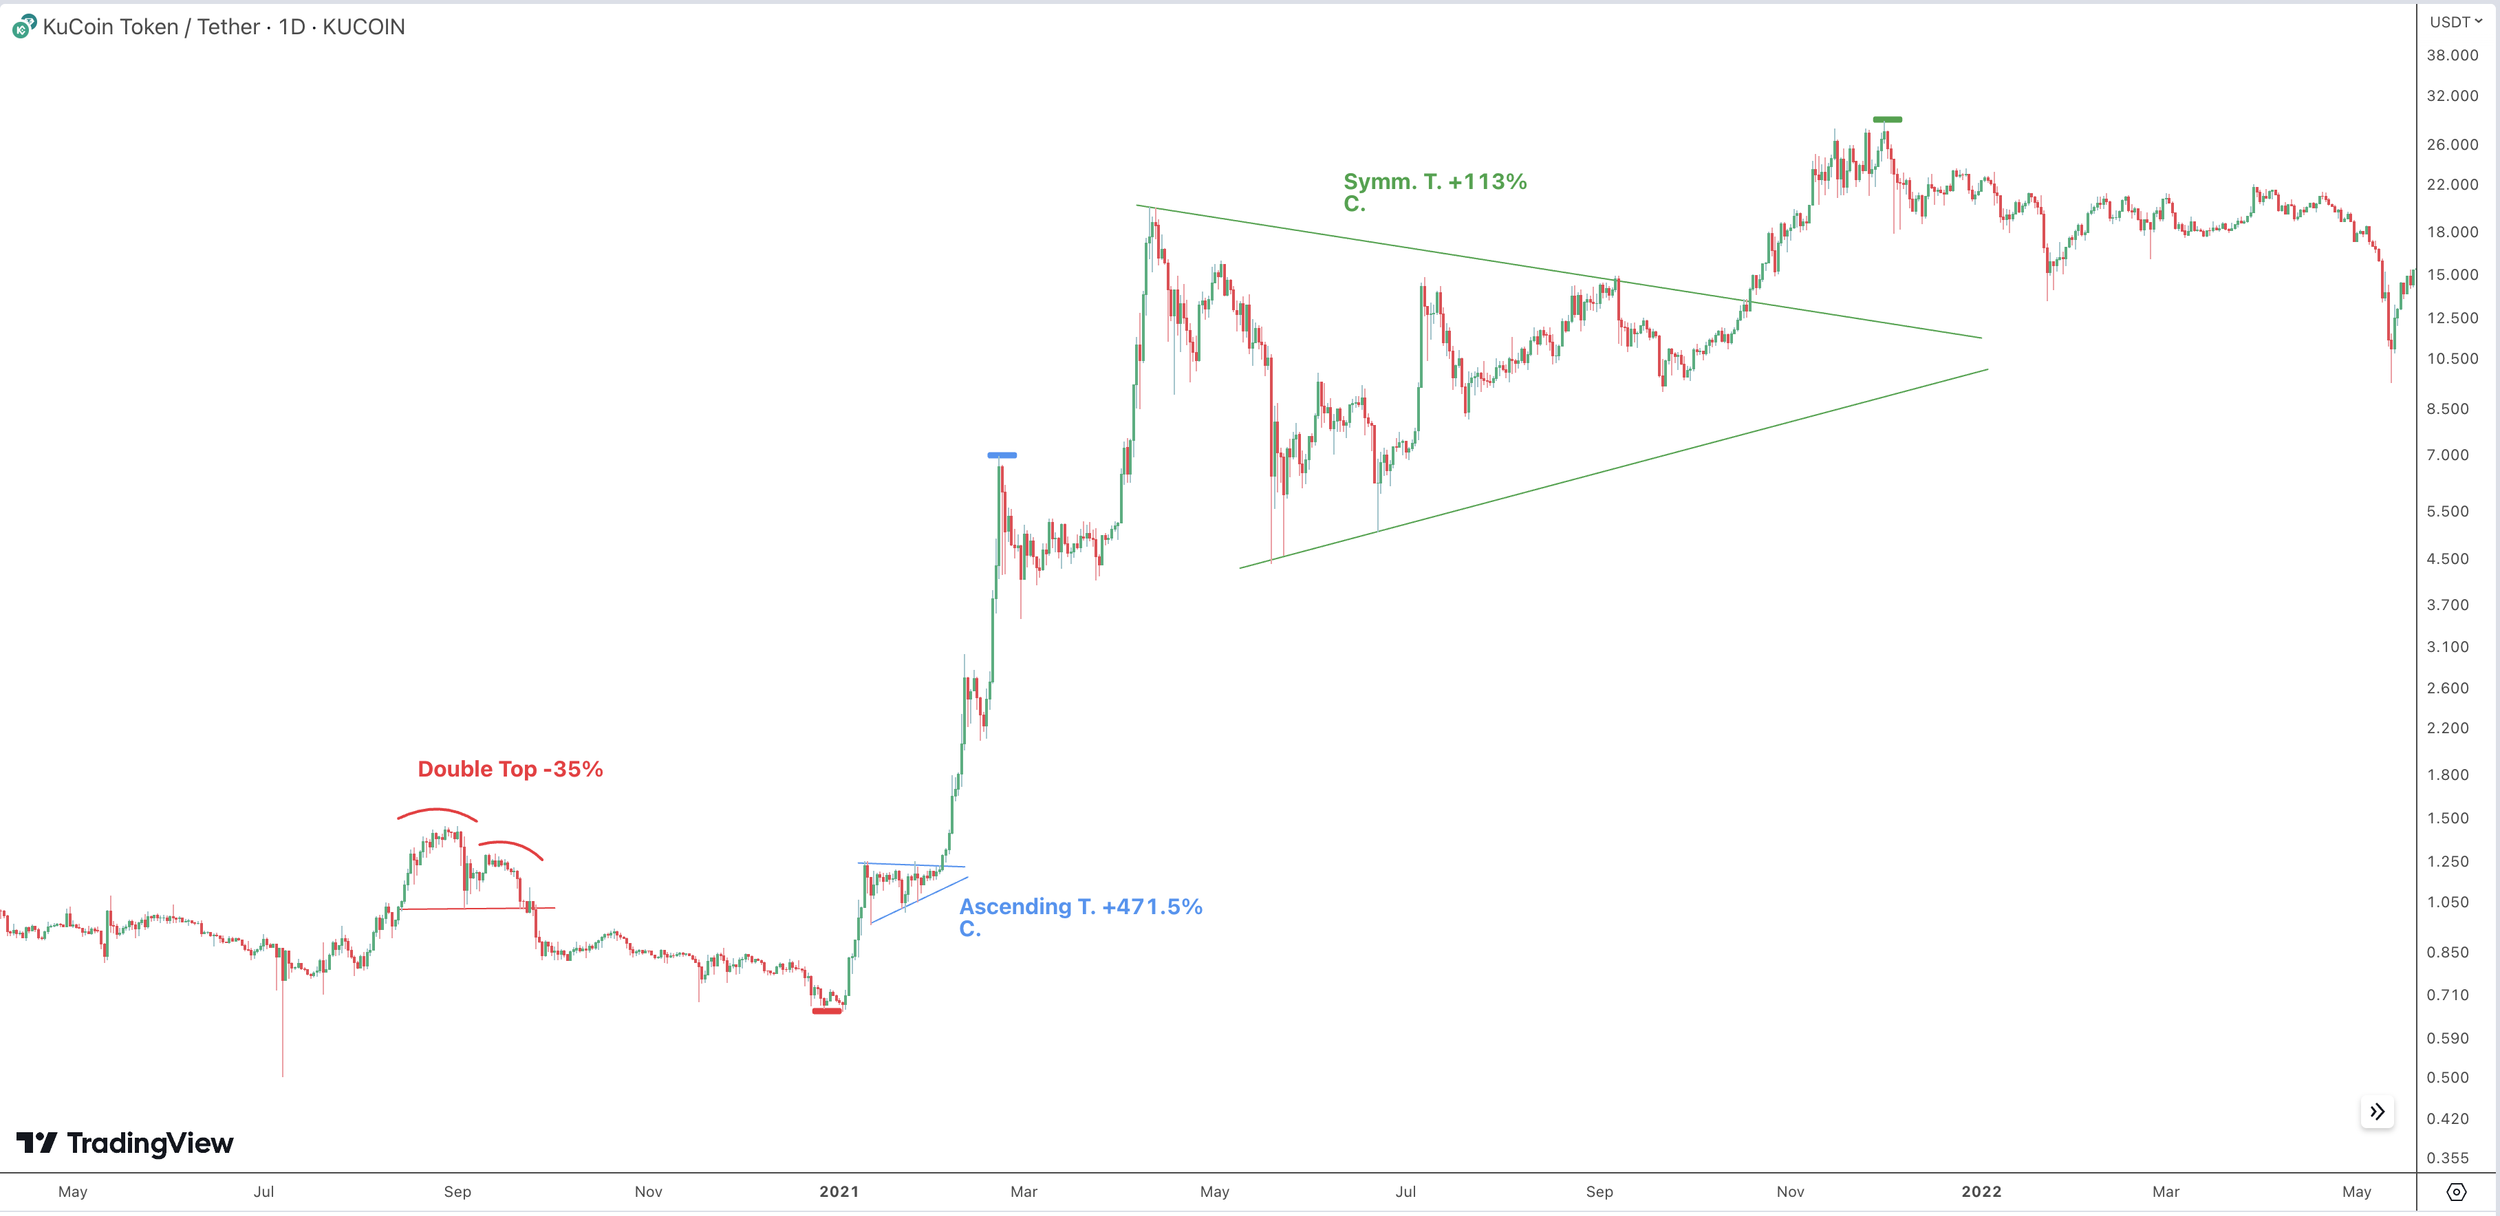
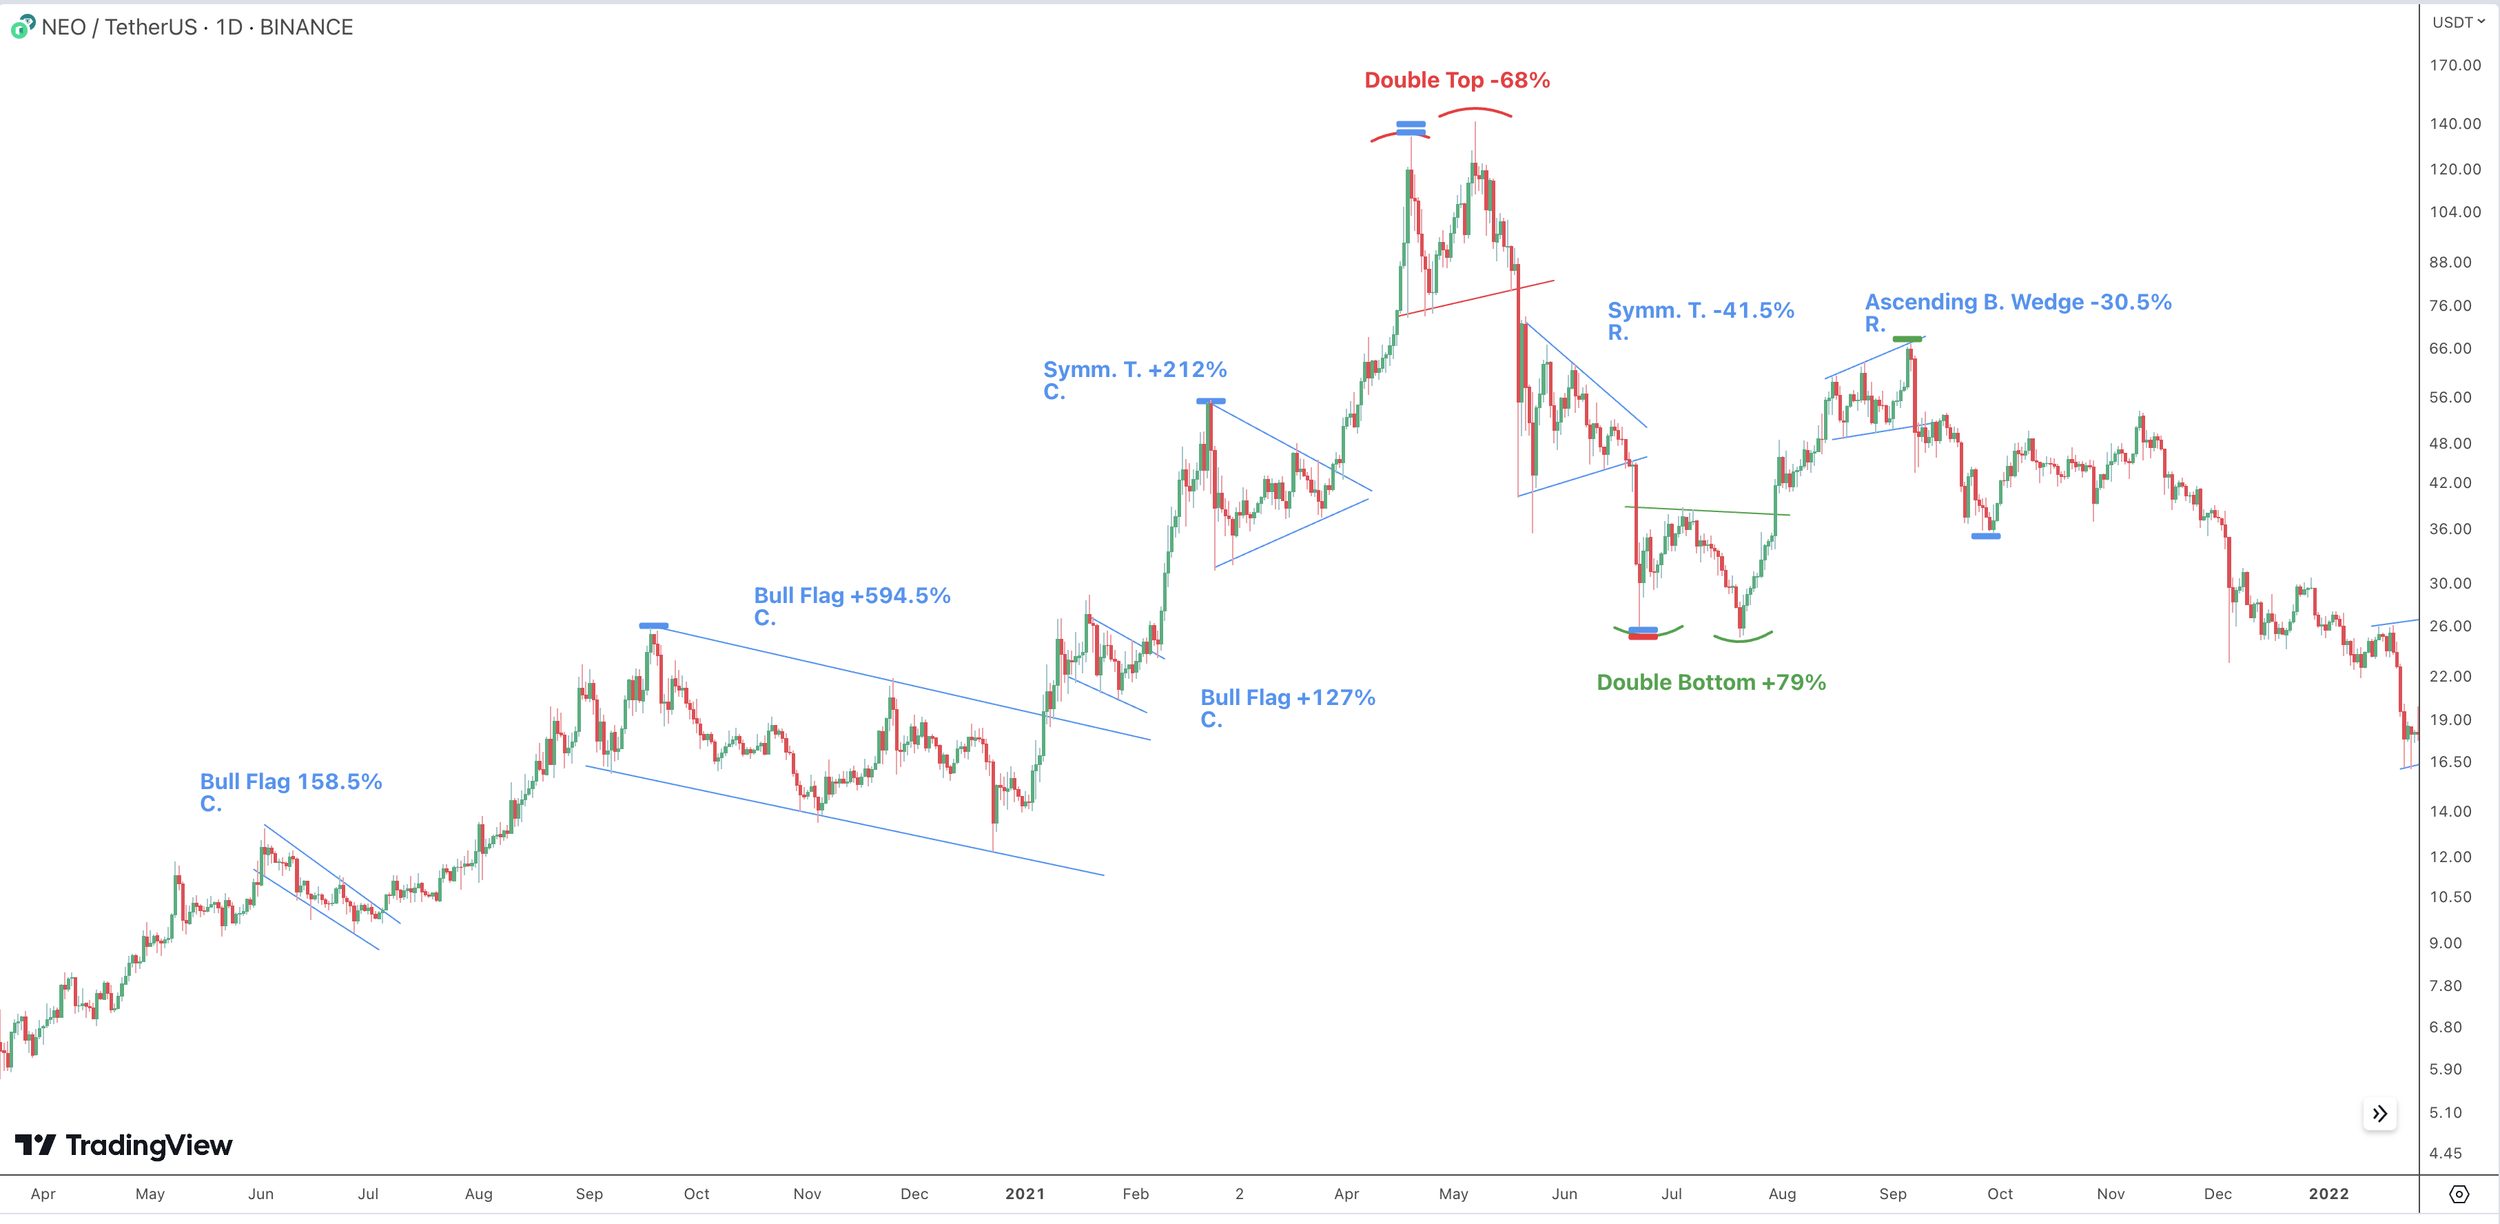
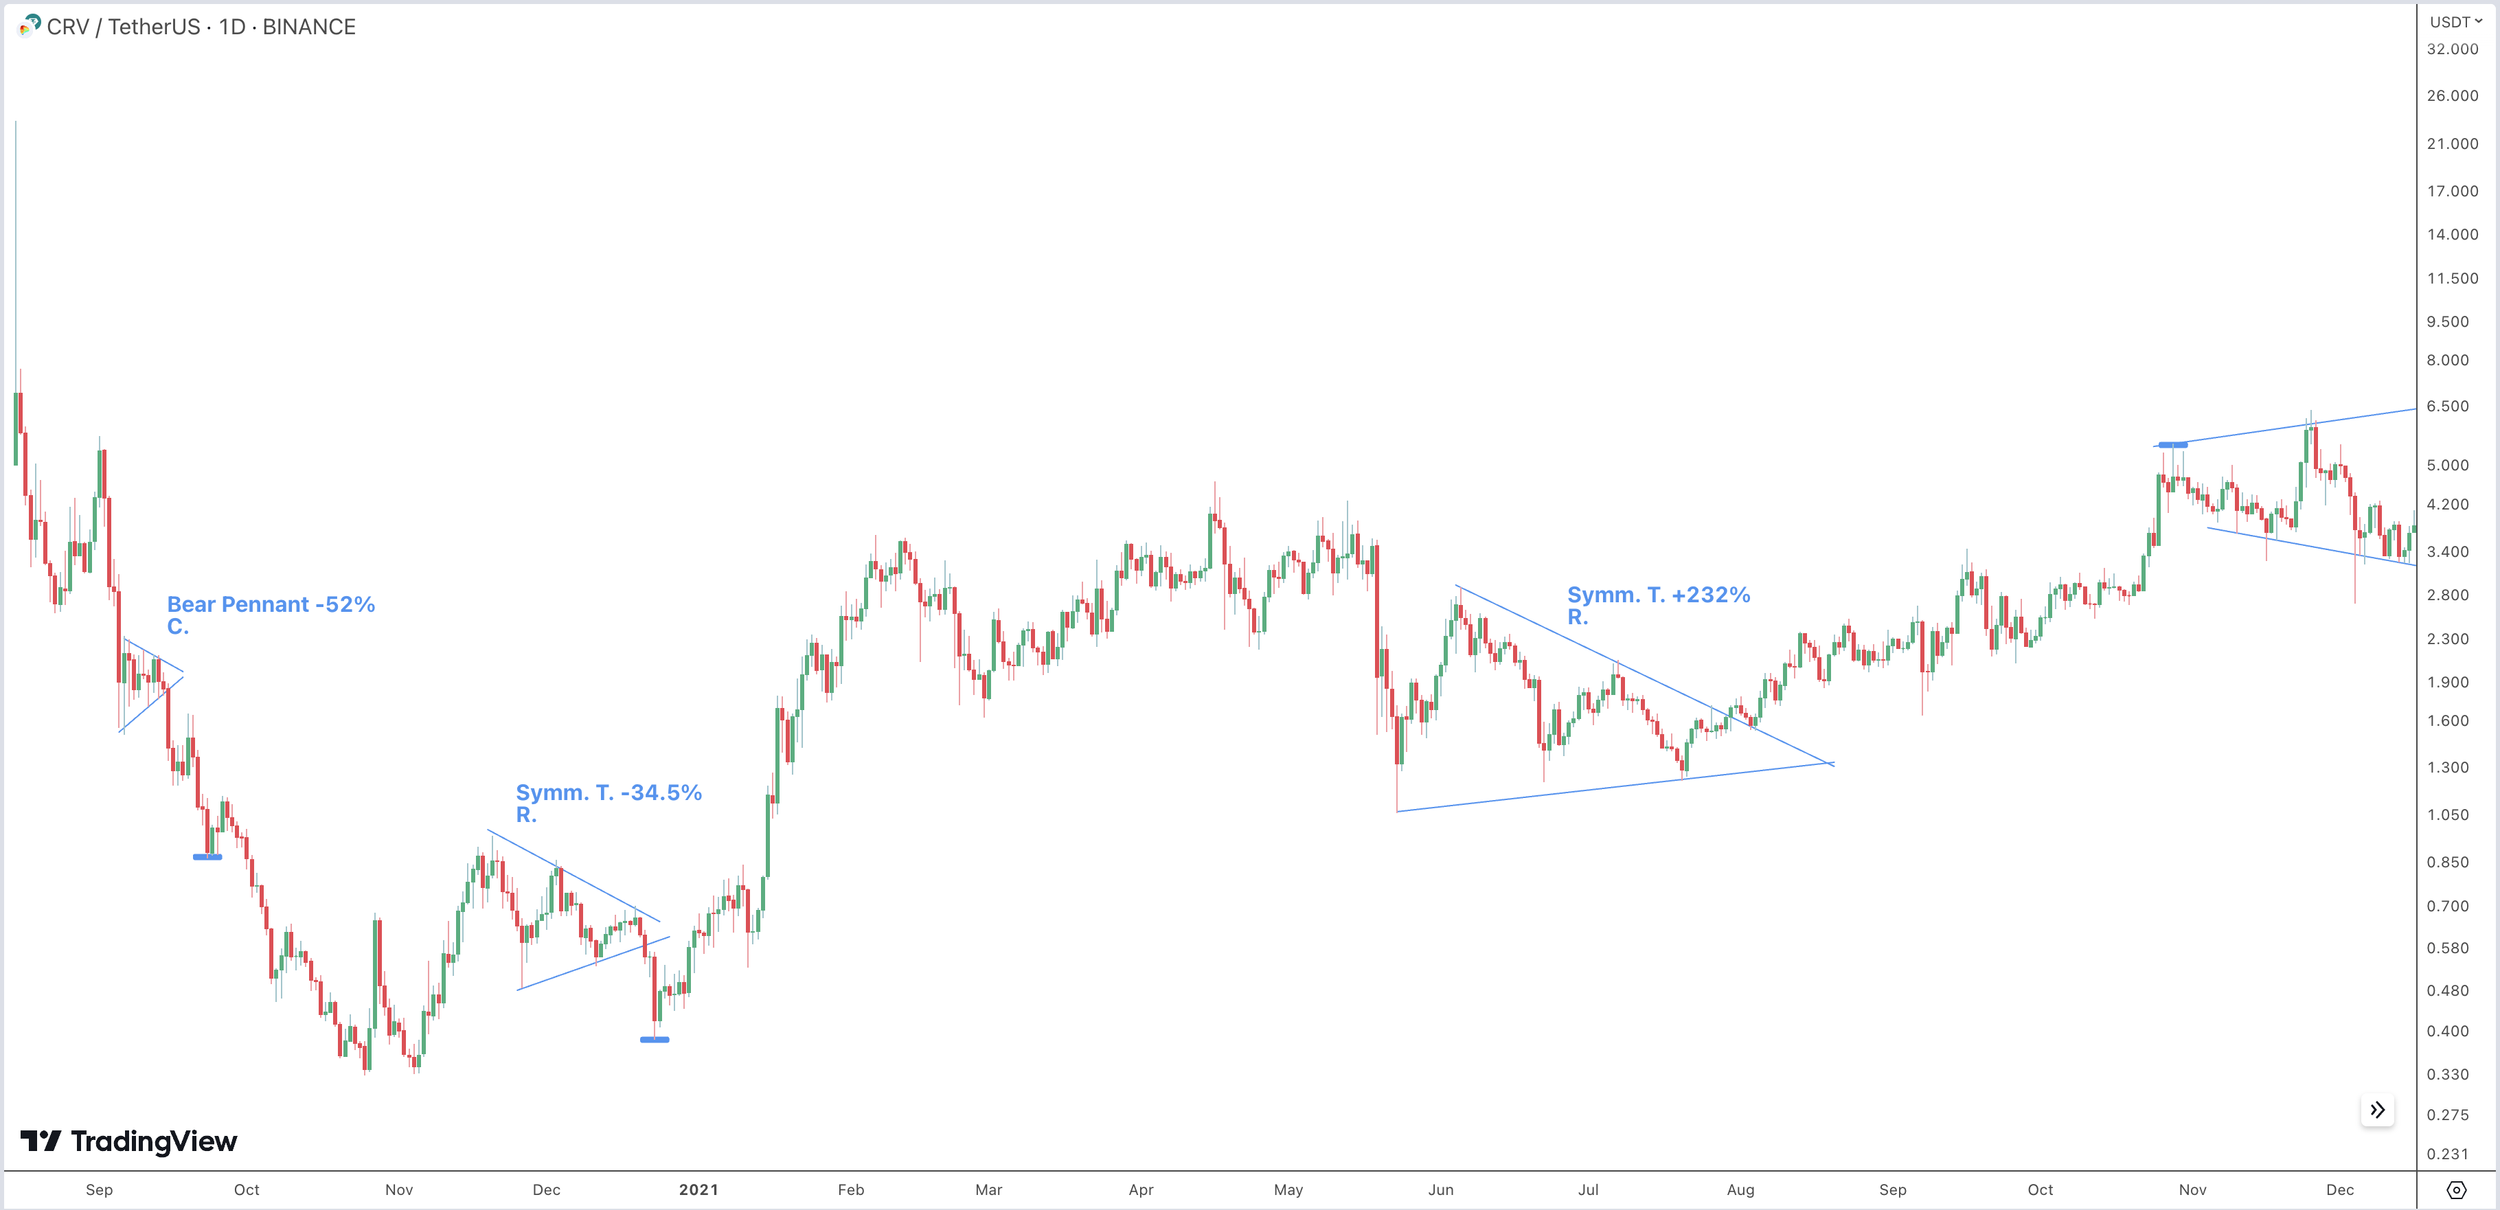
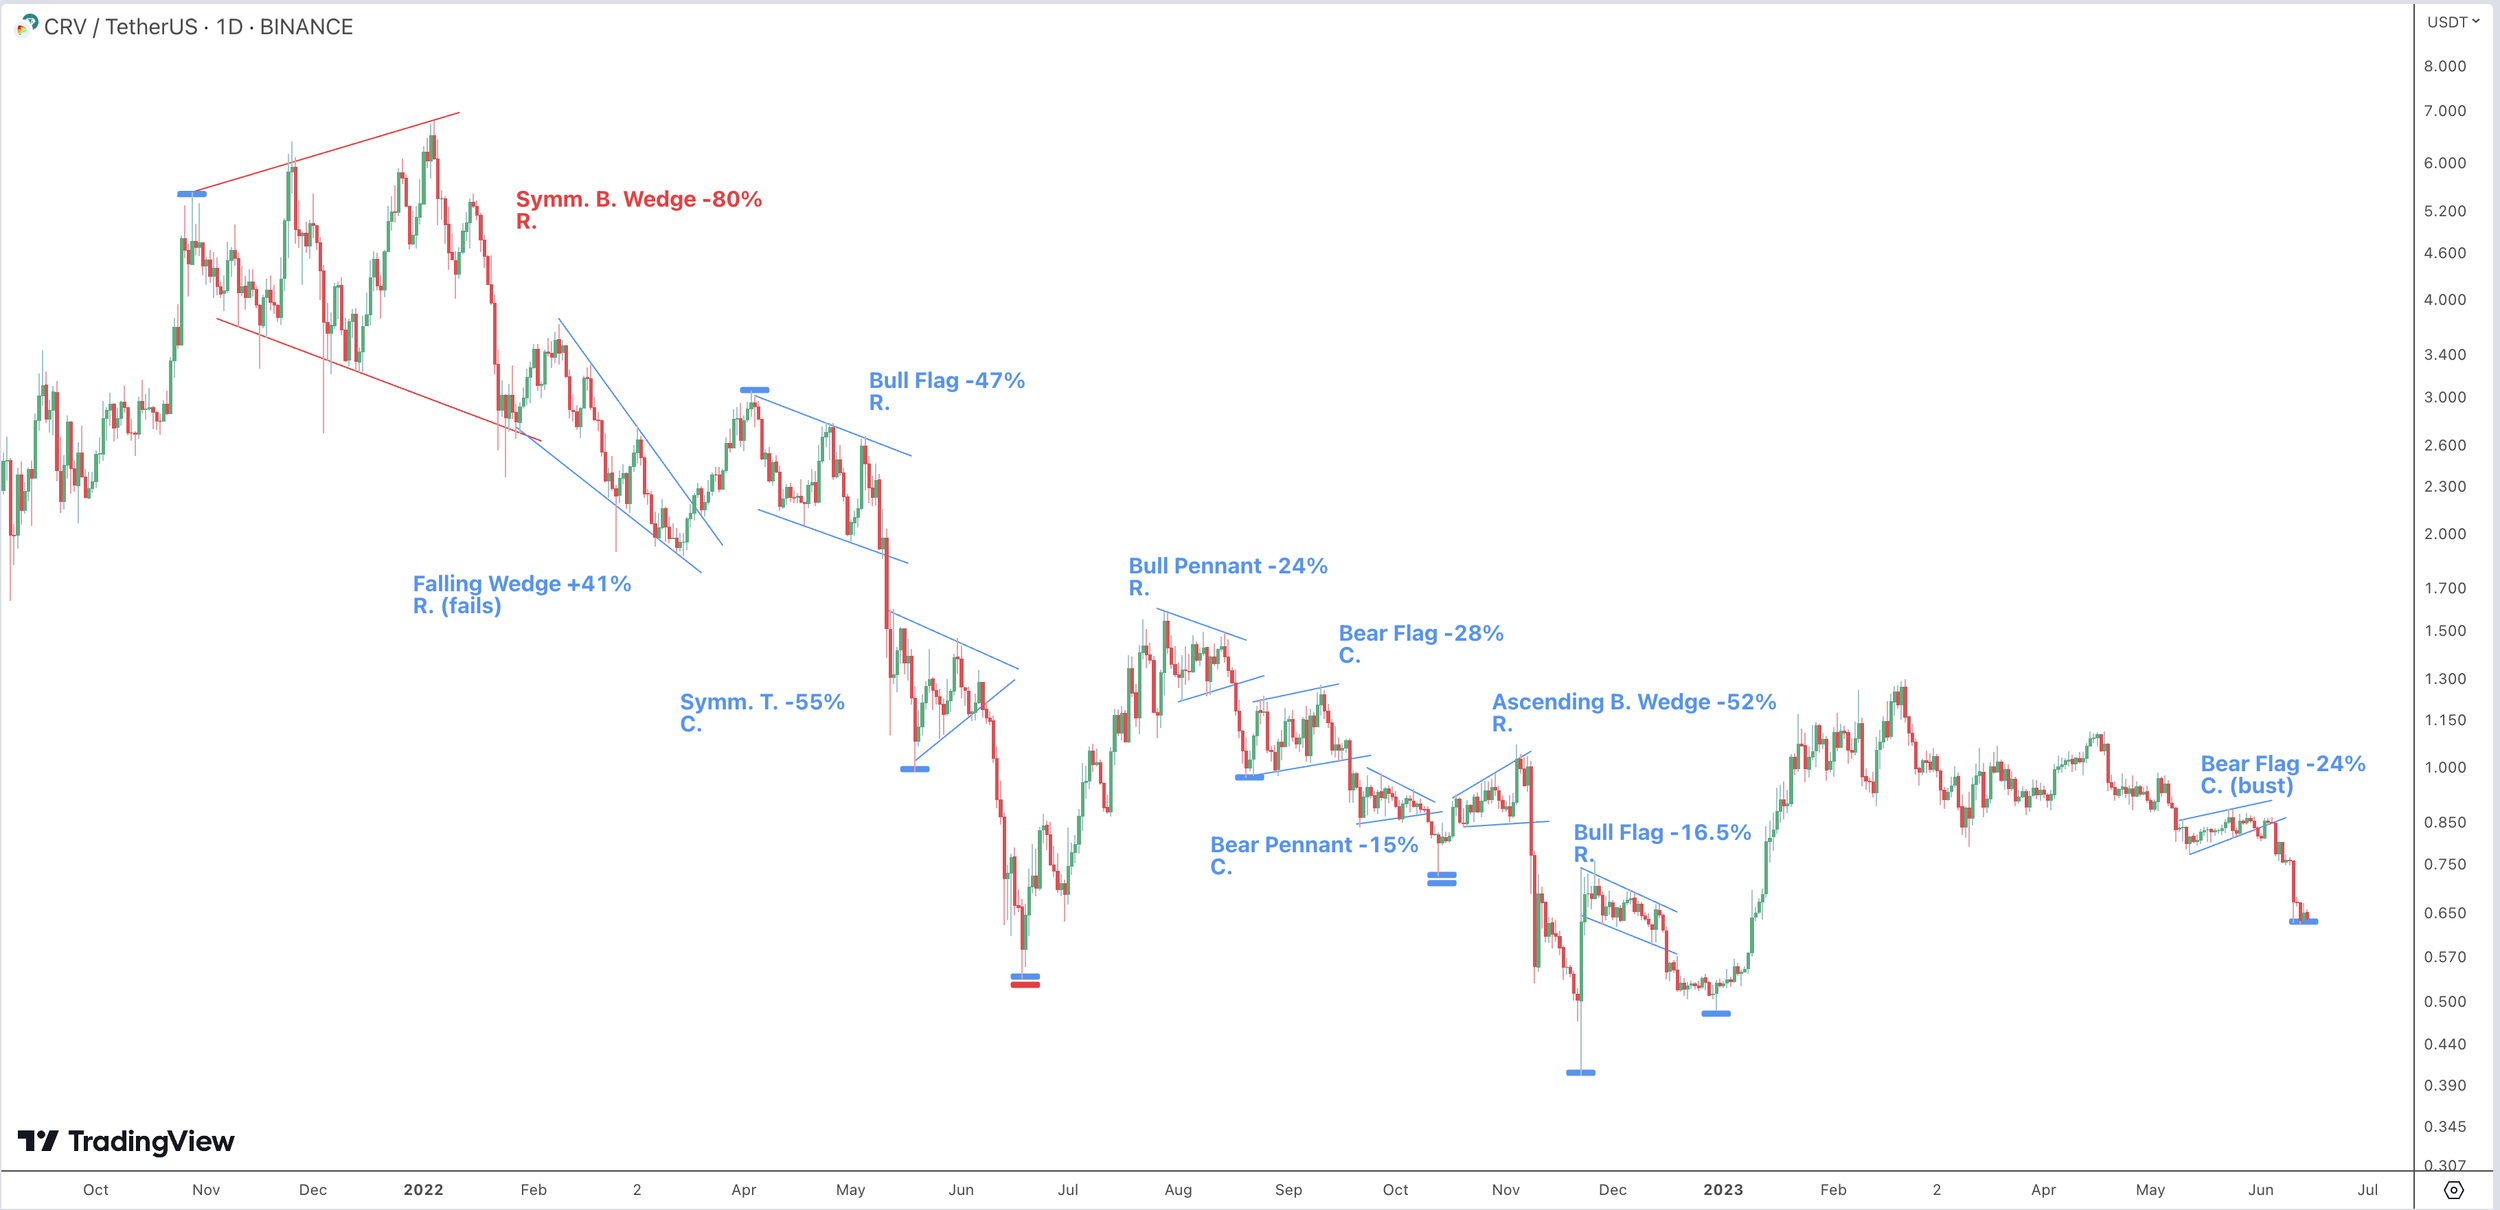
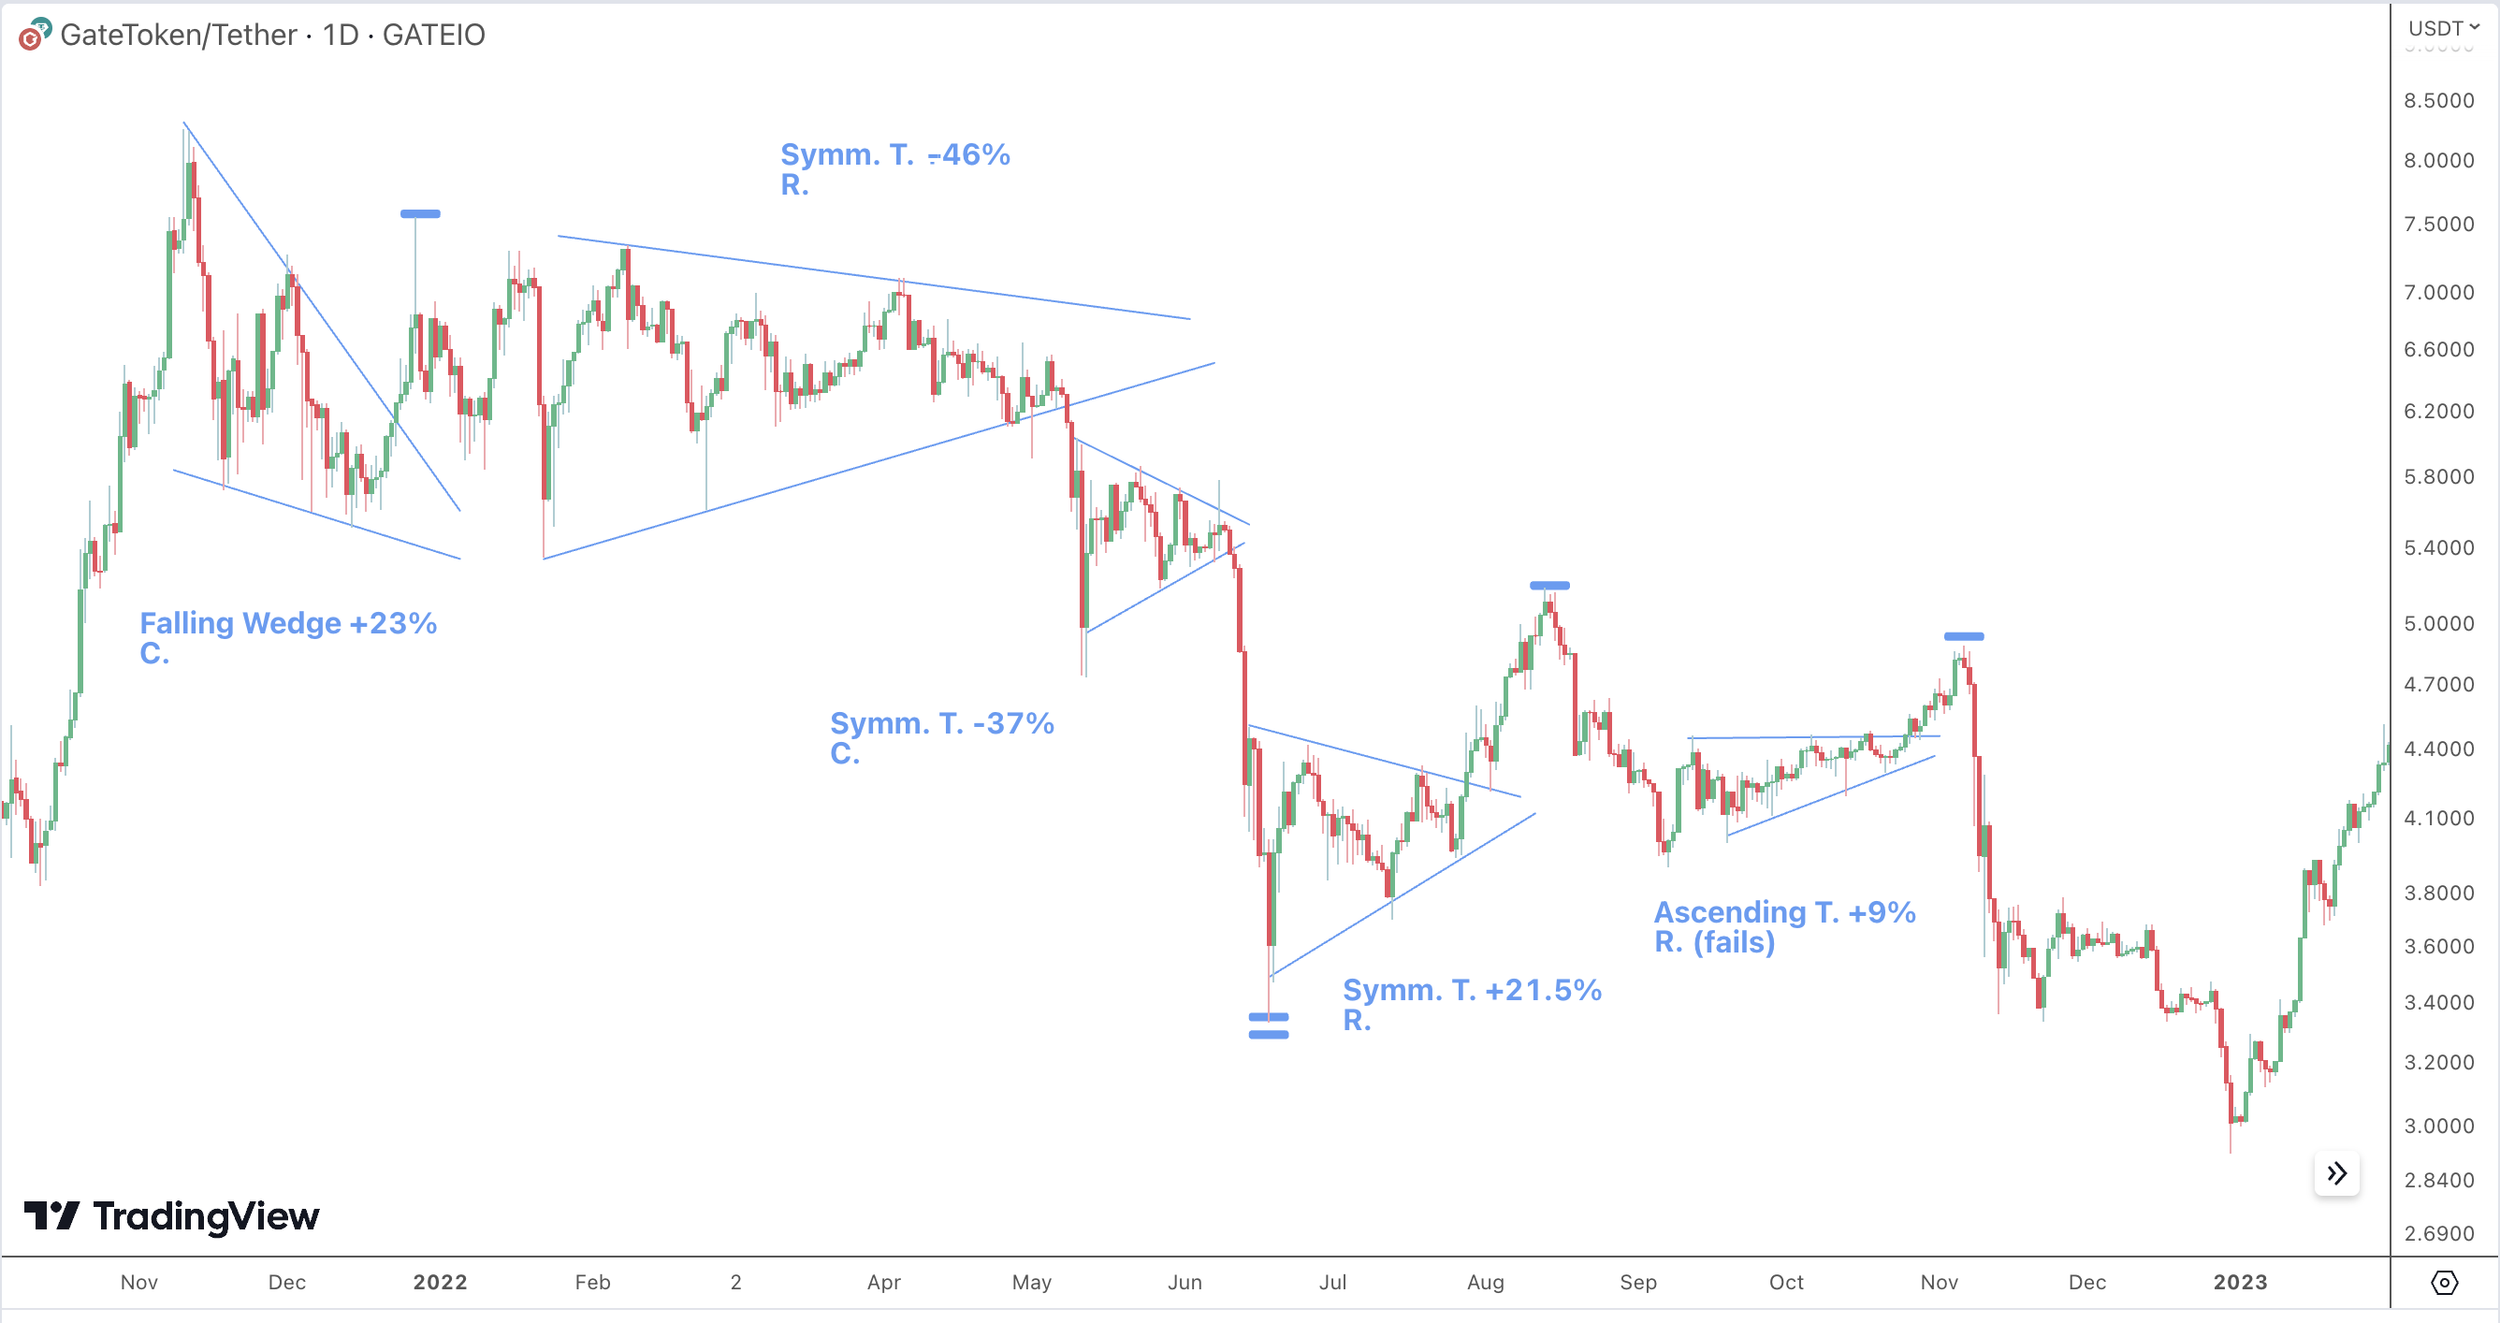
Unlike popular stock analysis findings*, Symmetrical Triangles are overwhelmingly bearish! Both in BTC and USD(T) pairs.
Overall (BTC and USD(T) combined), symmetrical triangles broke downward 67% of the time. This statistic is drawn from 411 examined symmetrical triangles. More details in the Handbook.
*According to Thomas Bulkowski’s study, symmetrical triangles broke upward 60% of the time (see The Pattern Site)!
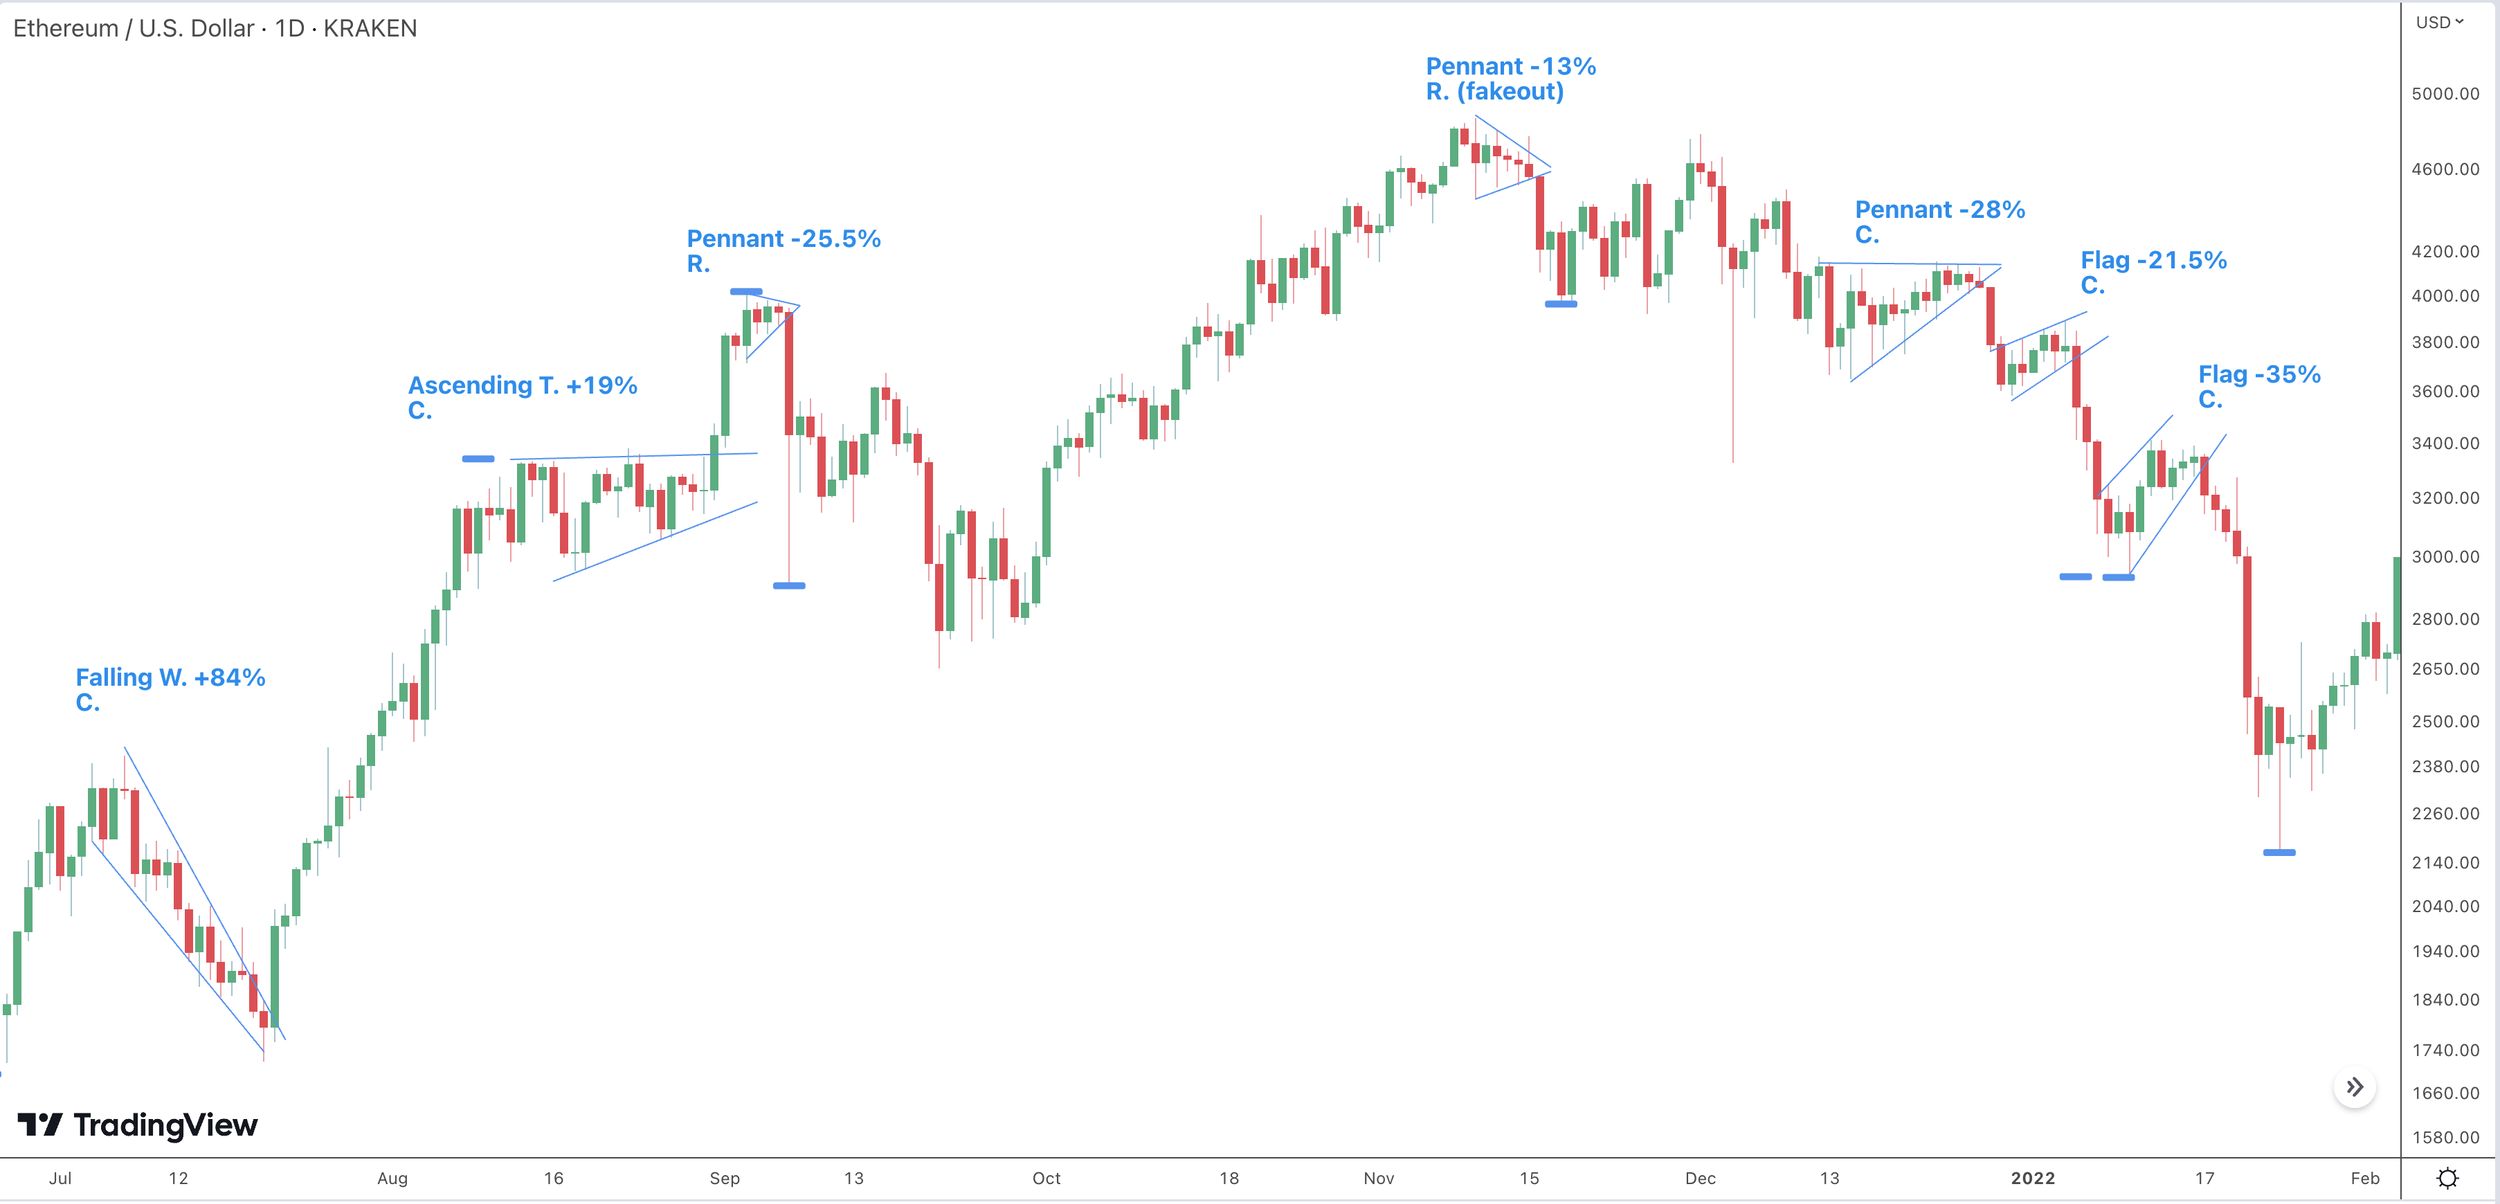
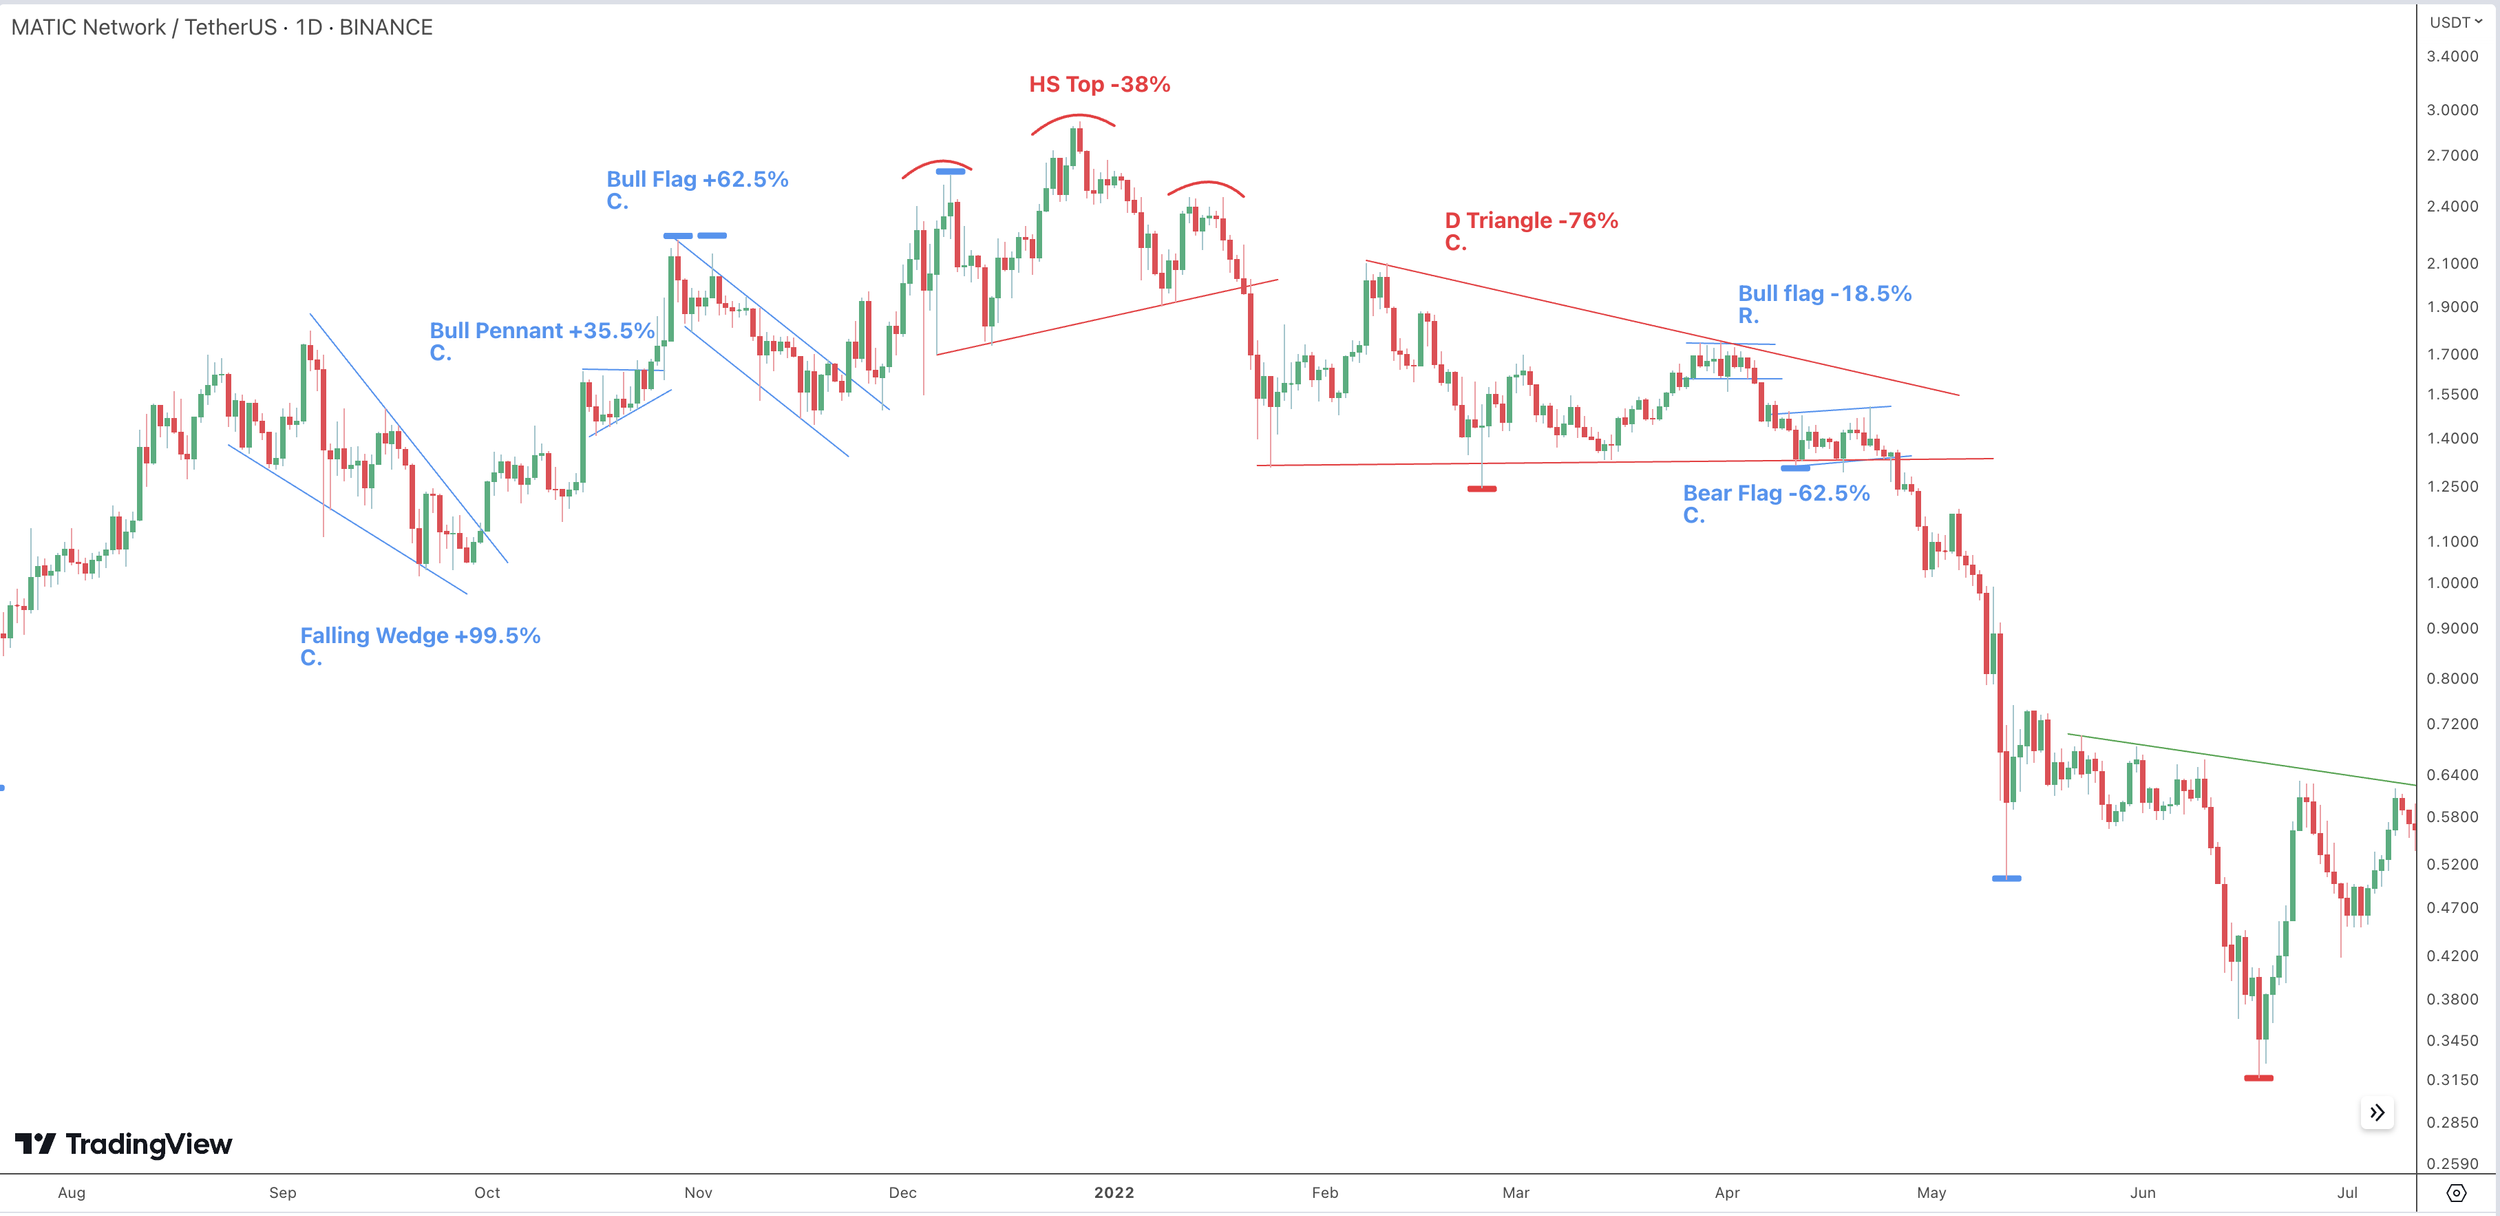
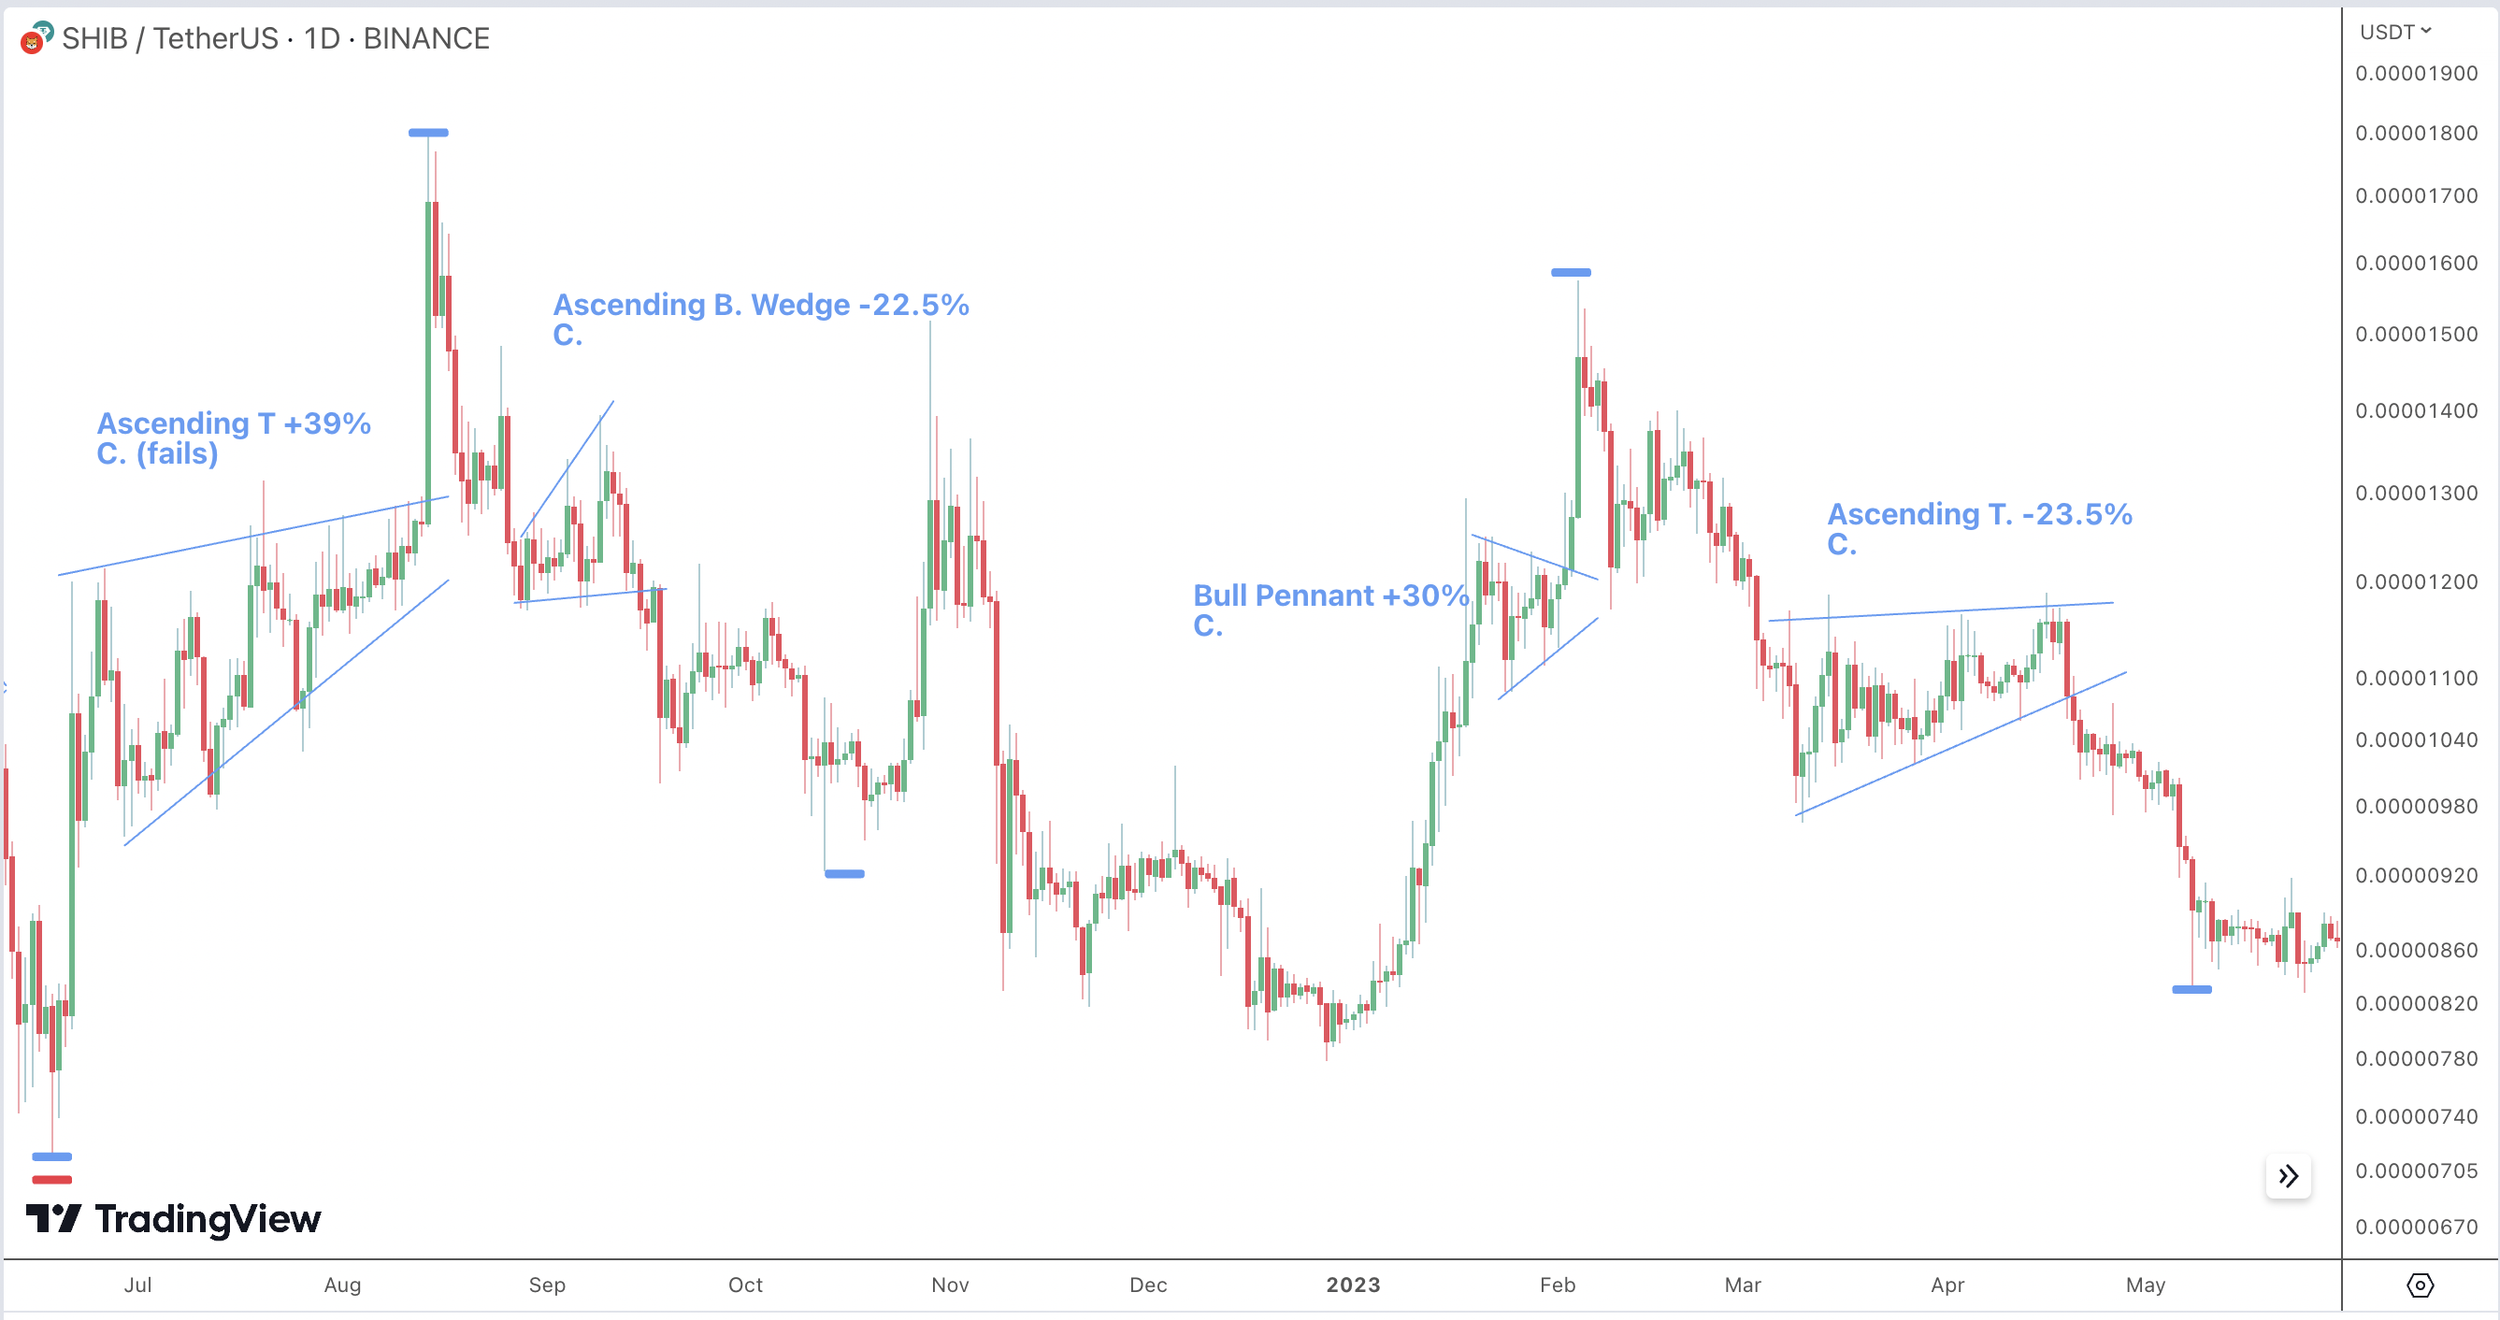
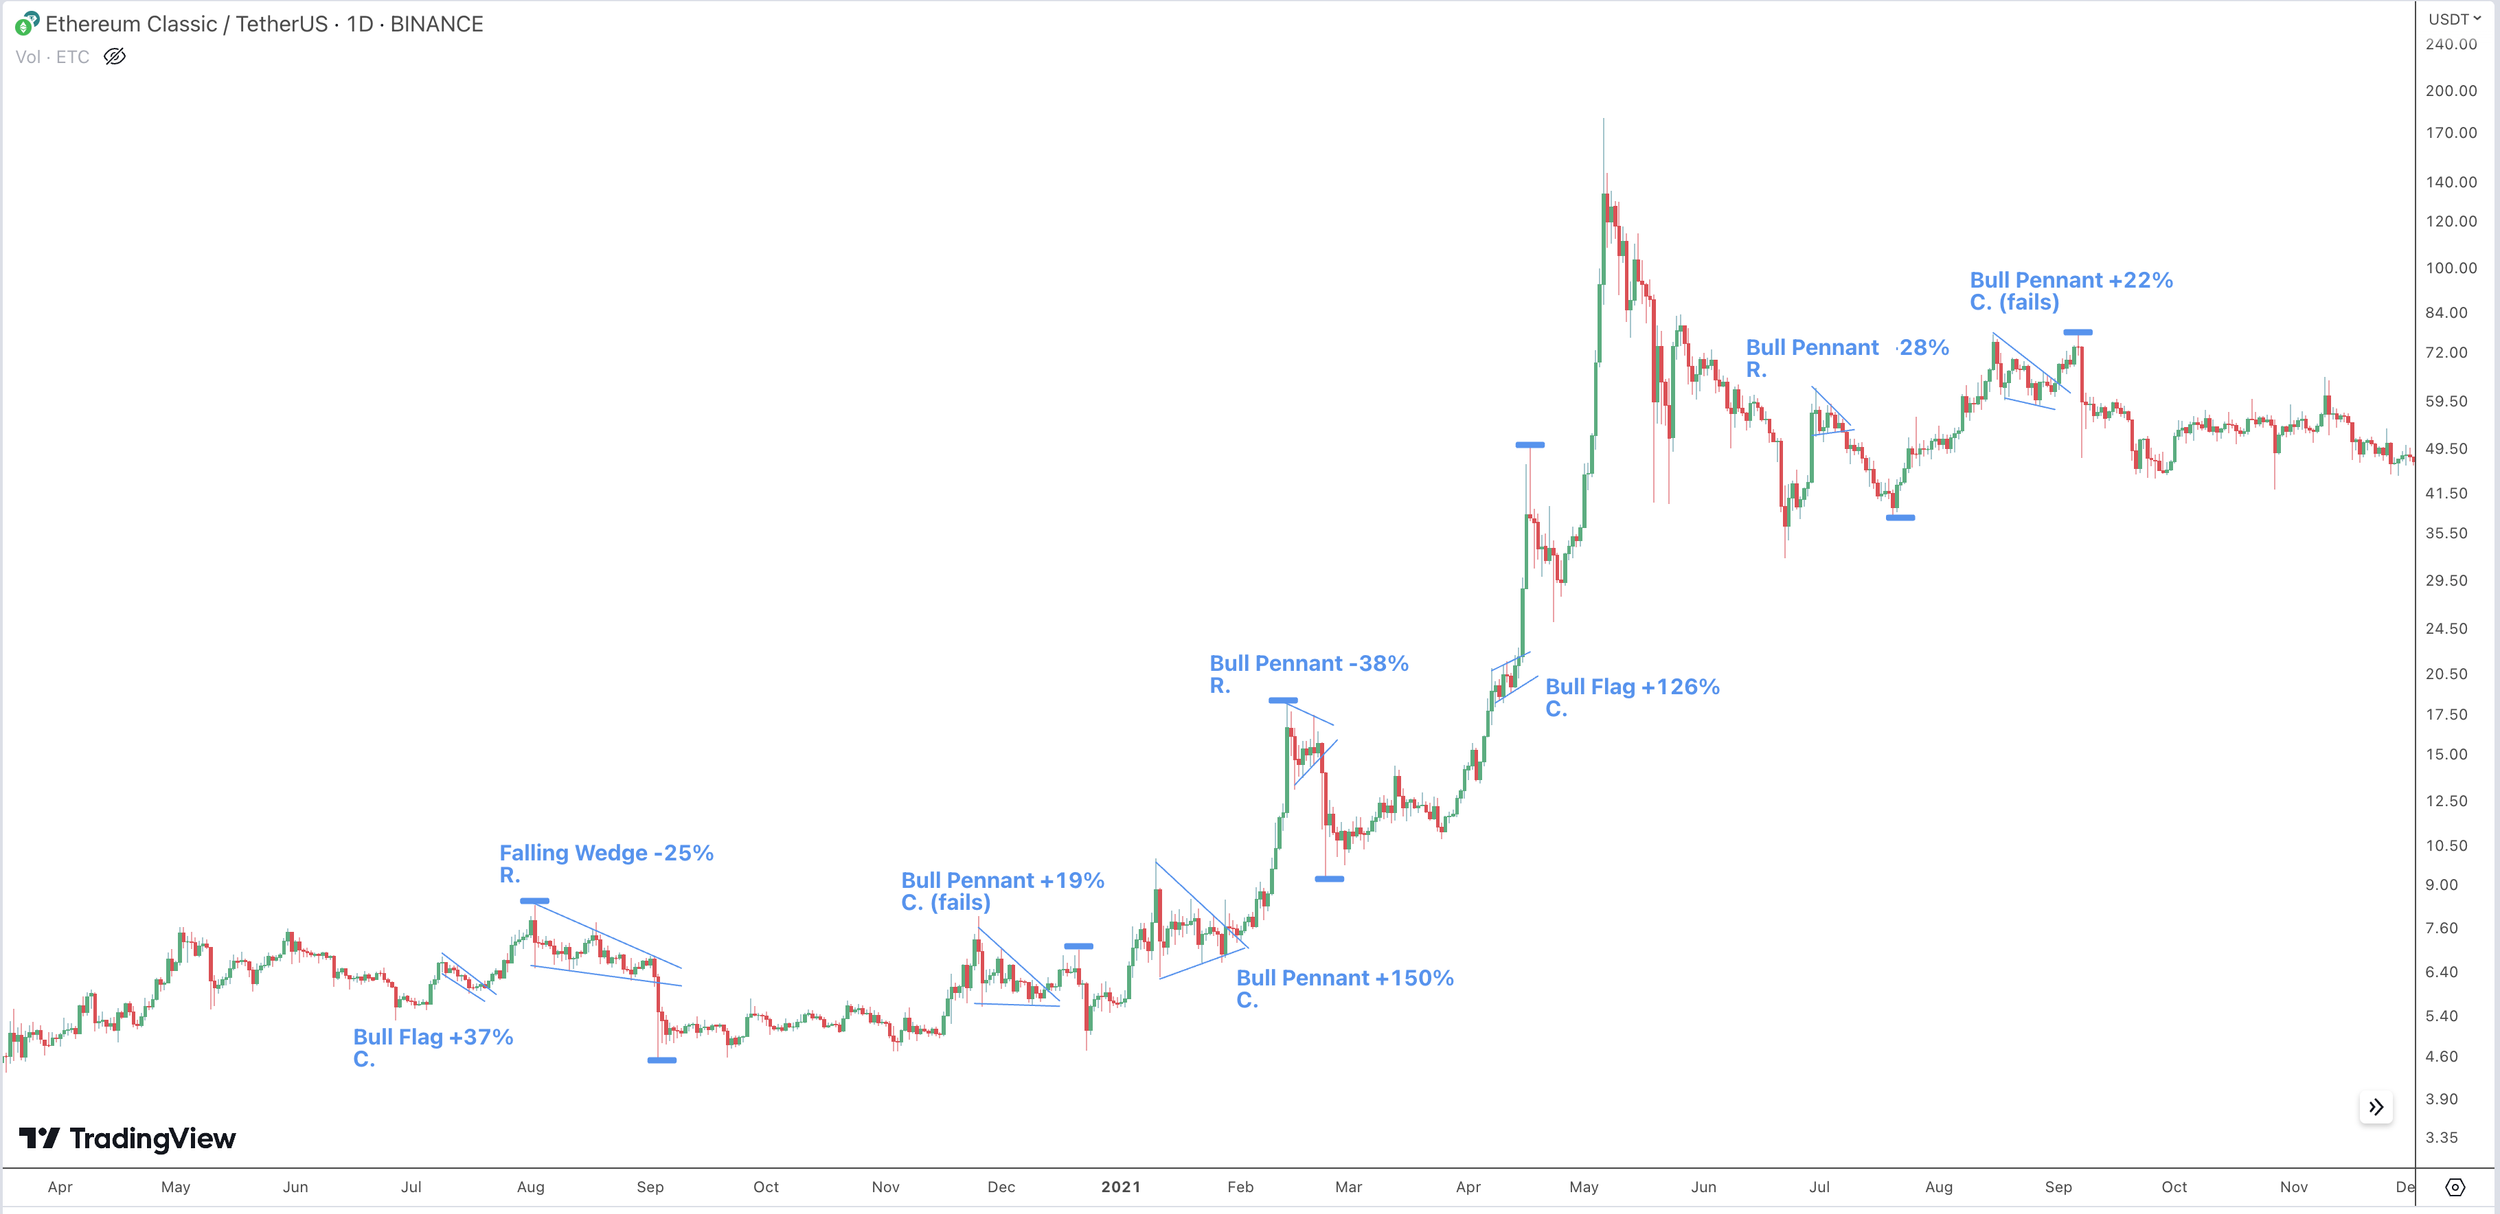
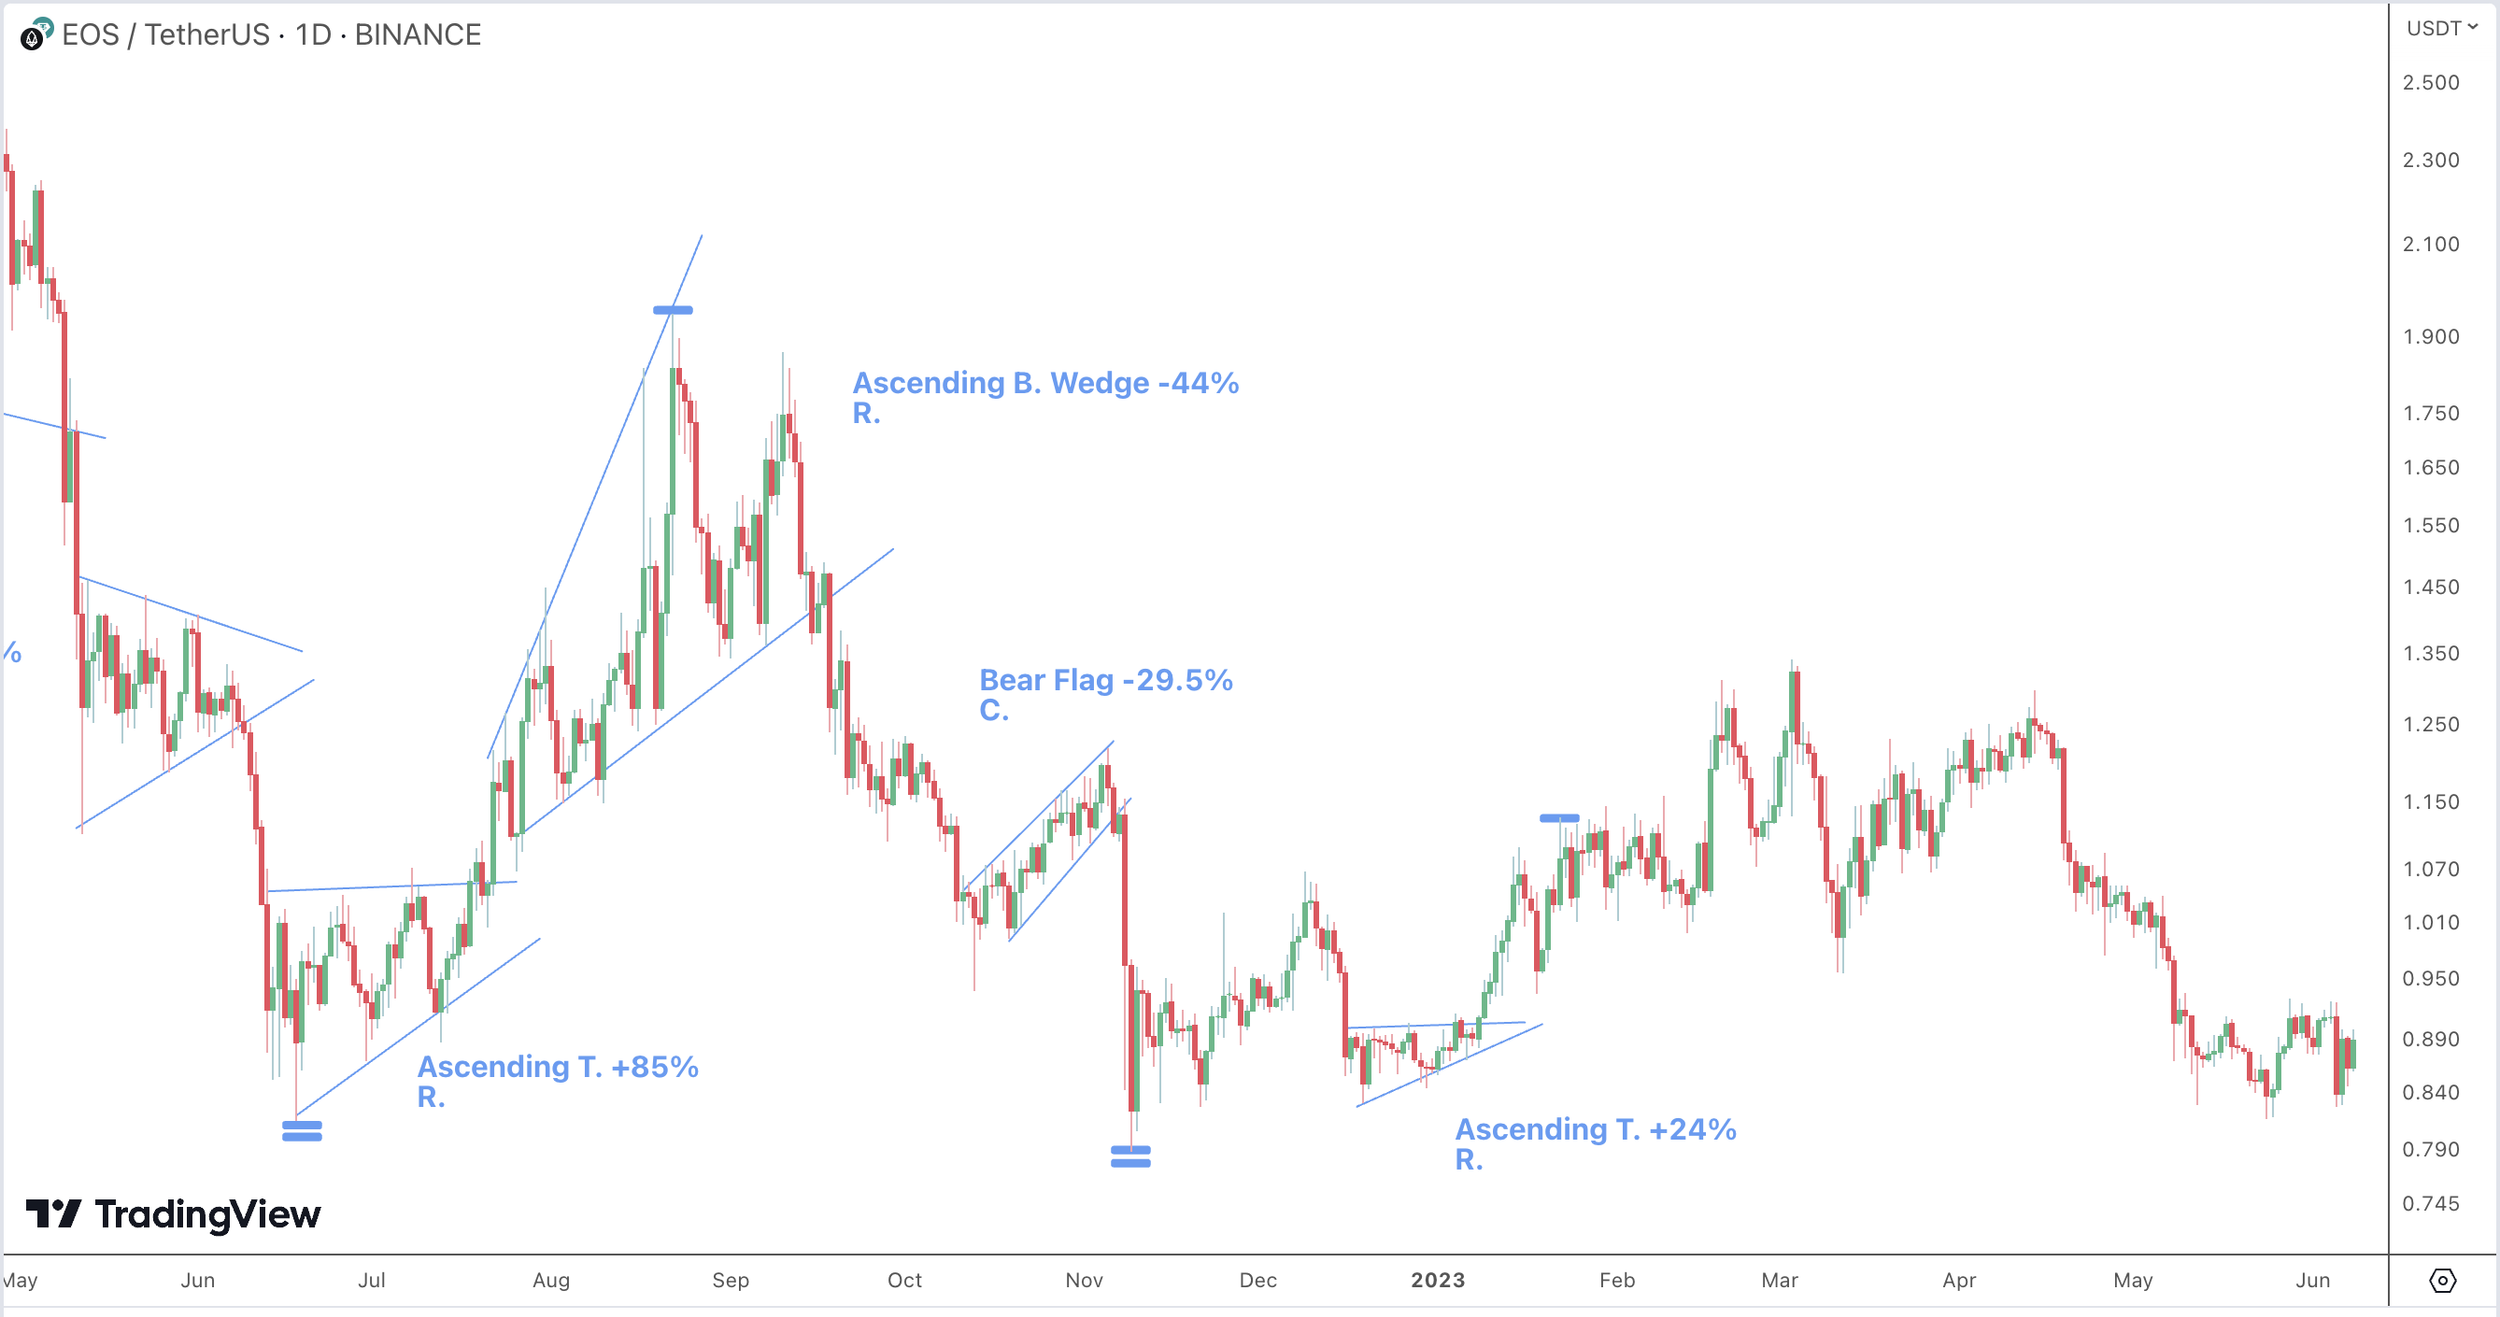
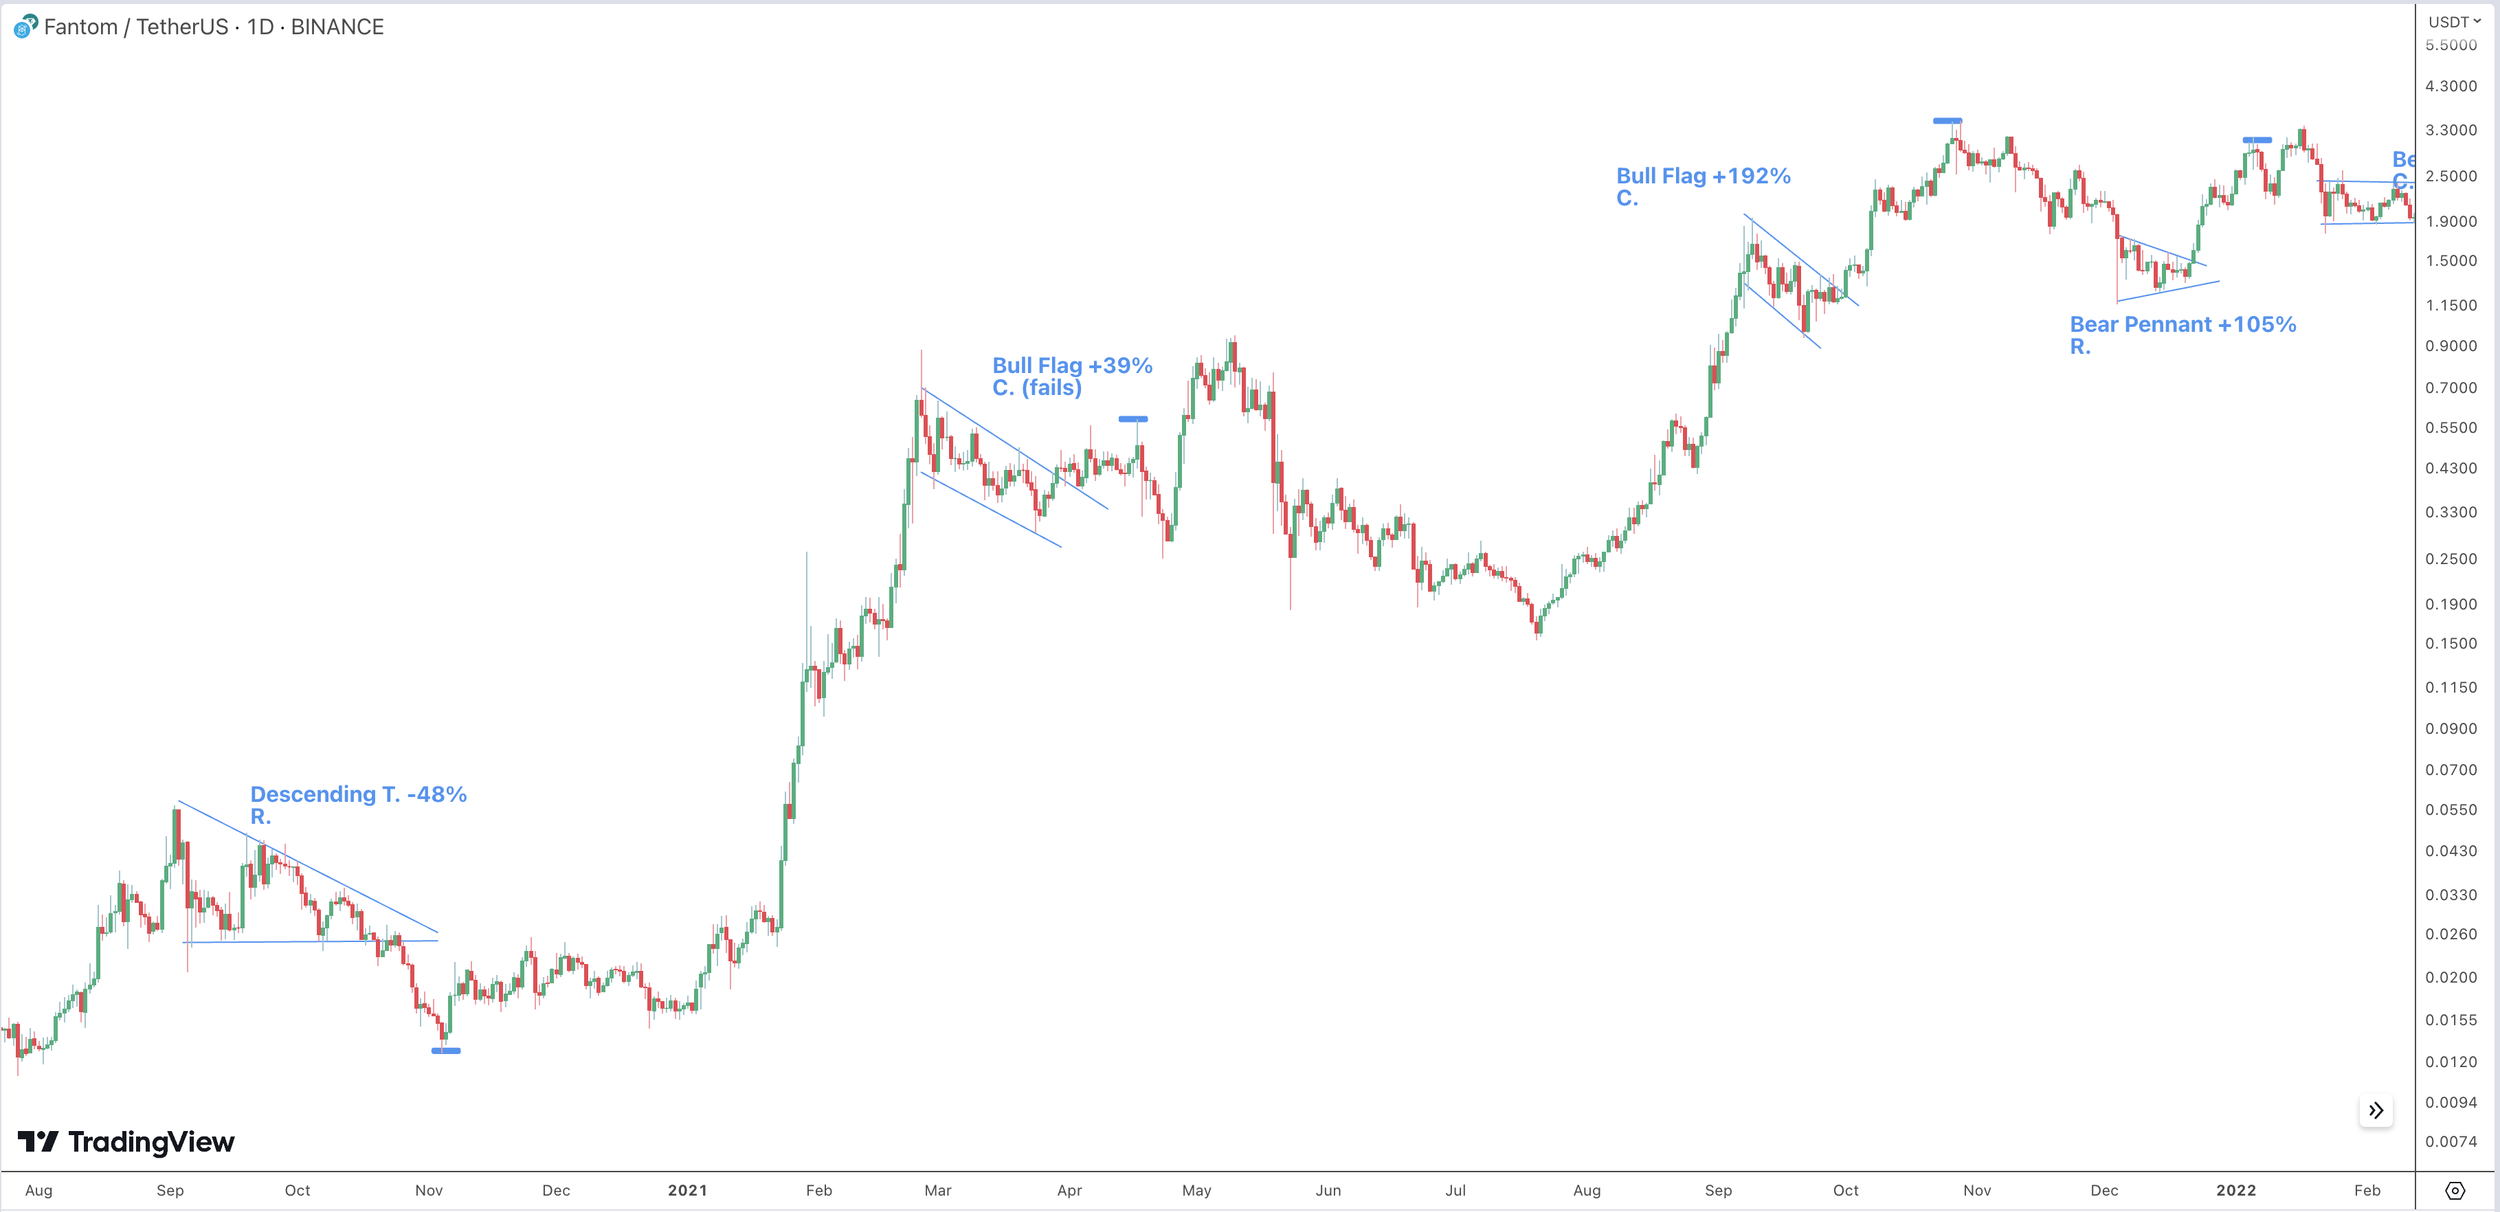
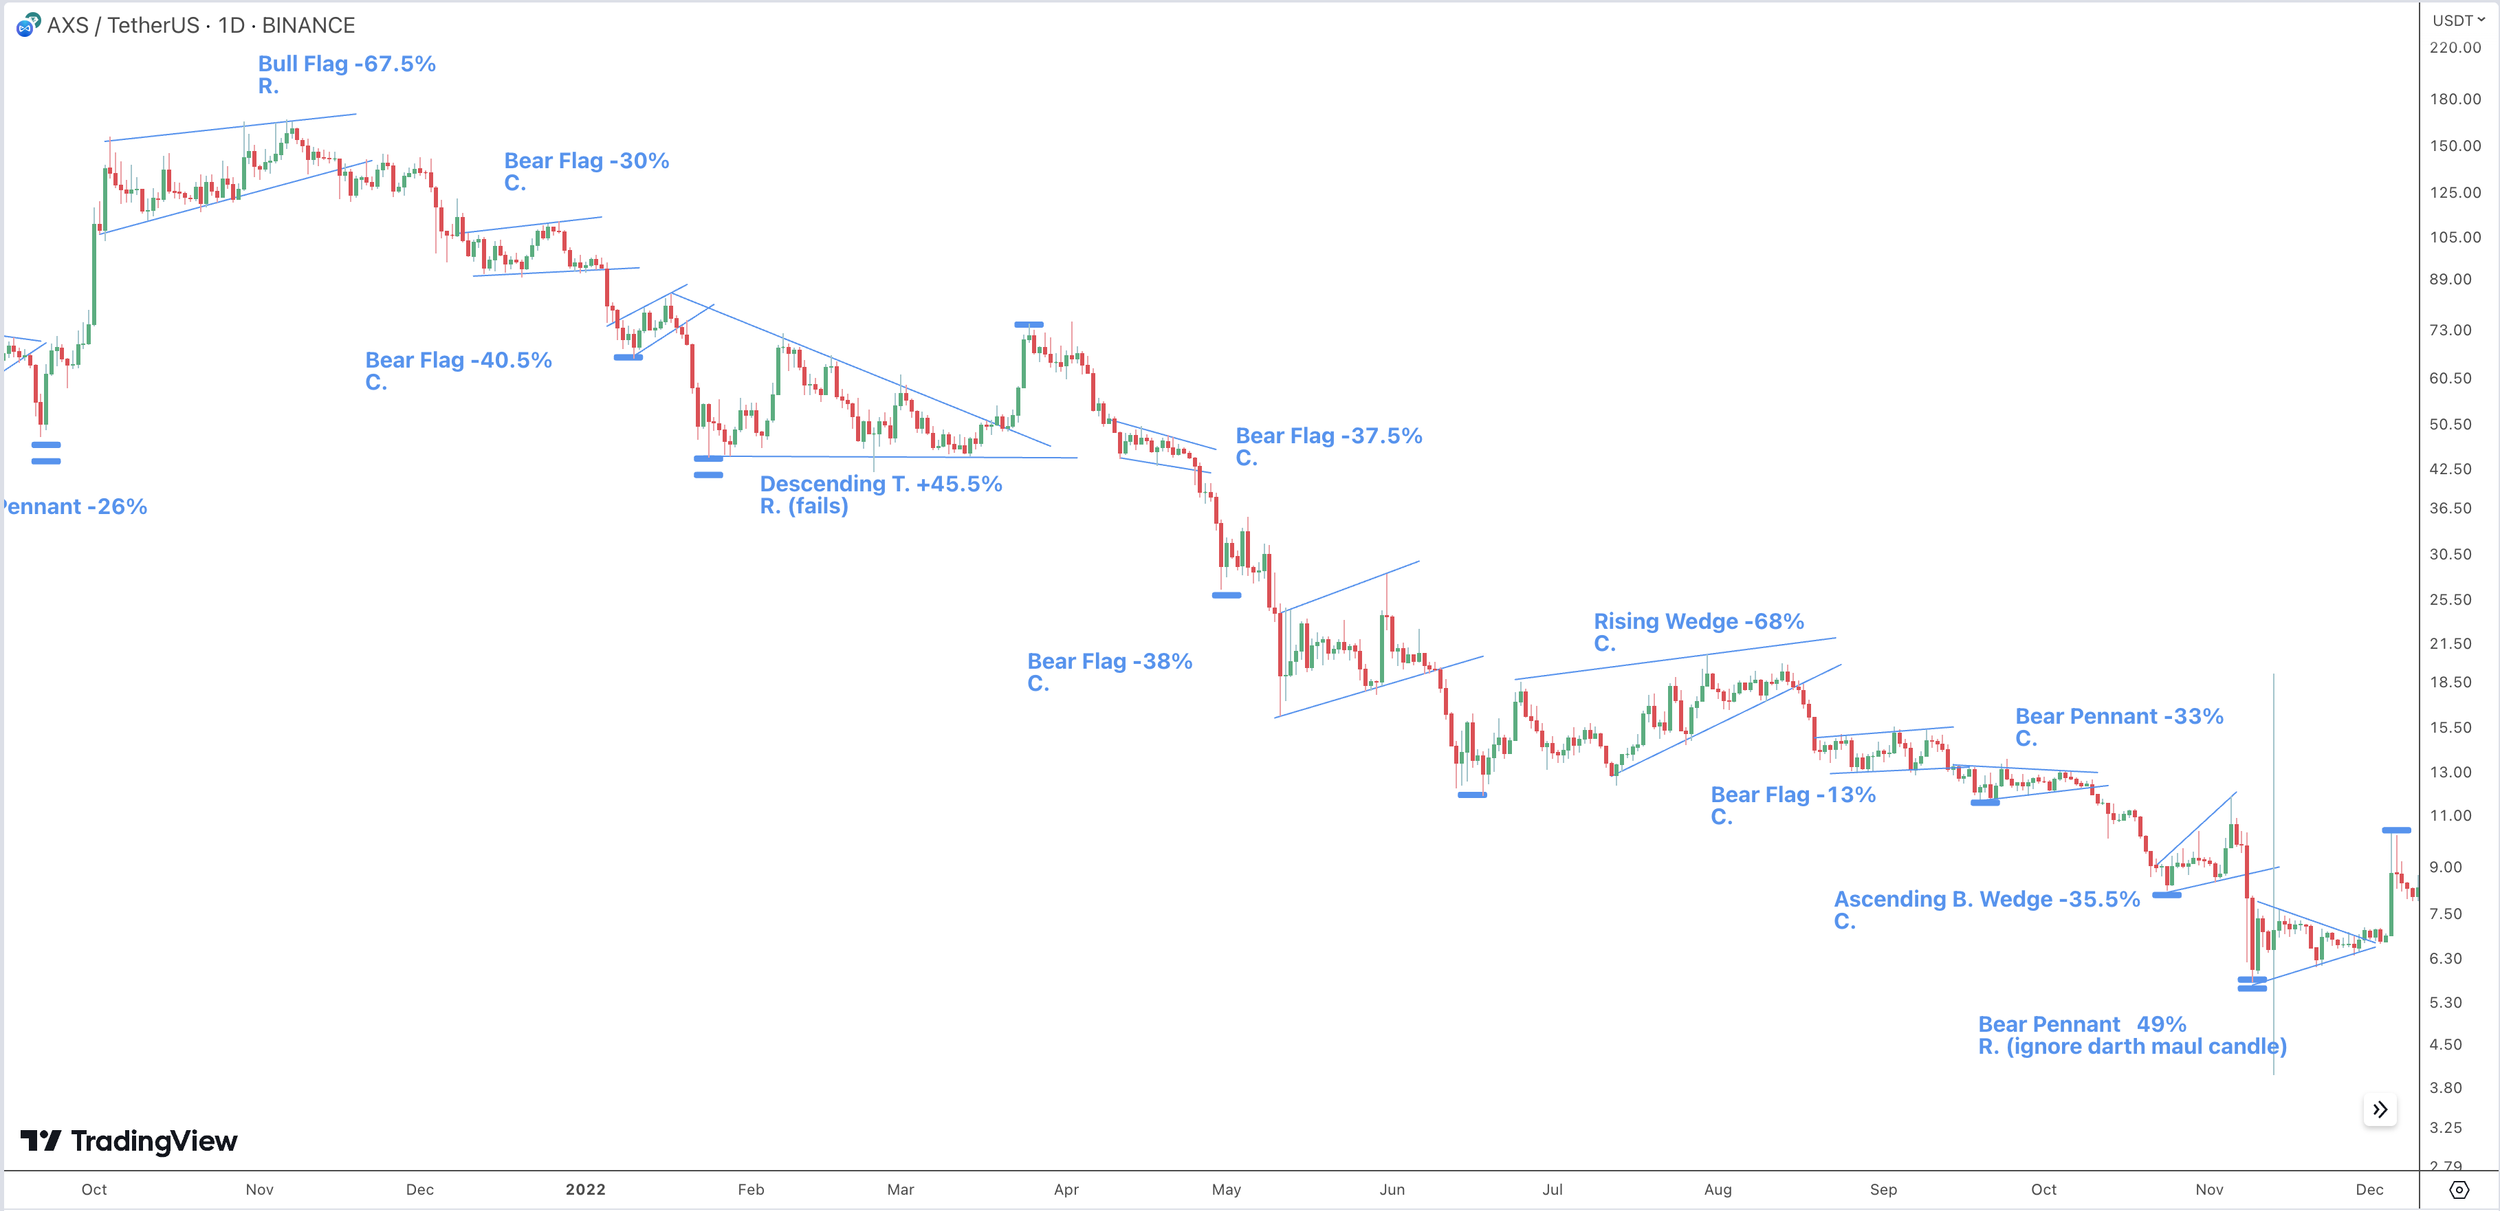
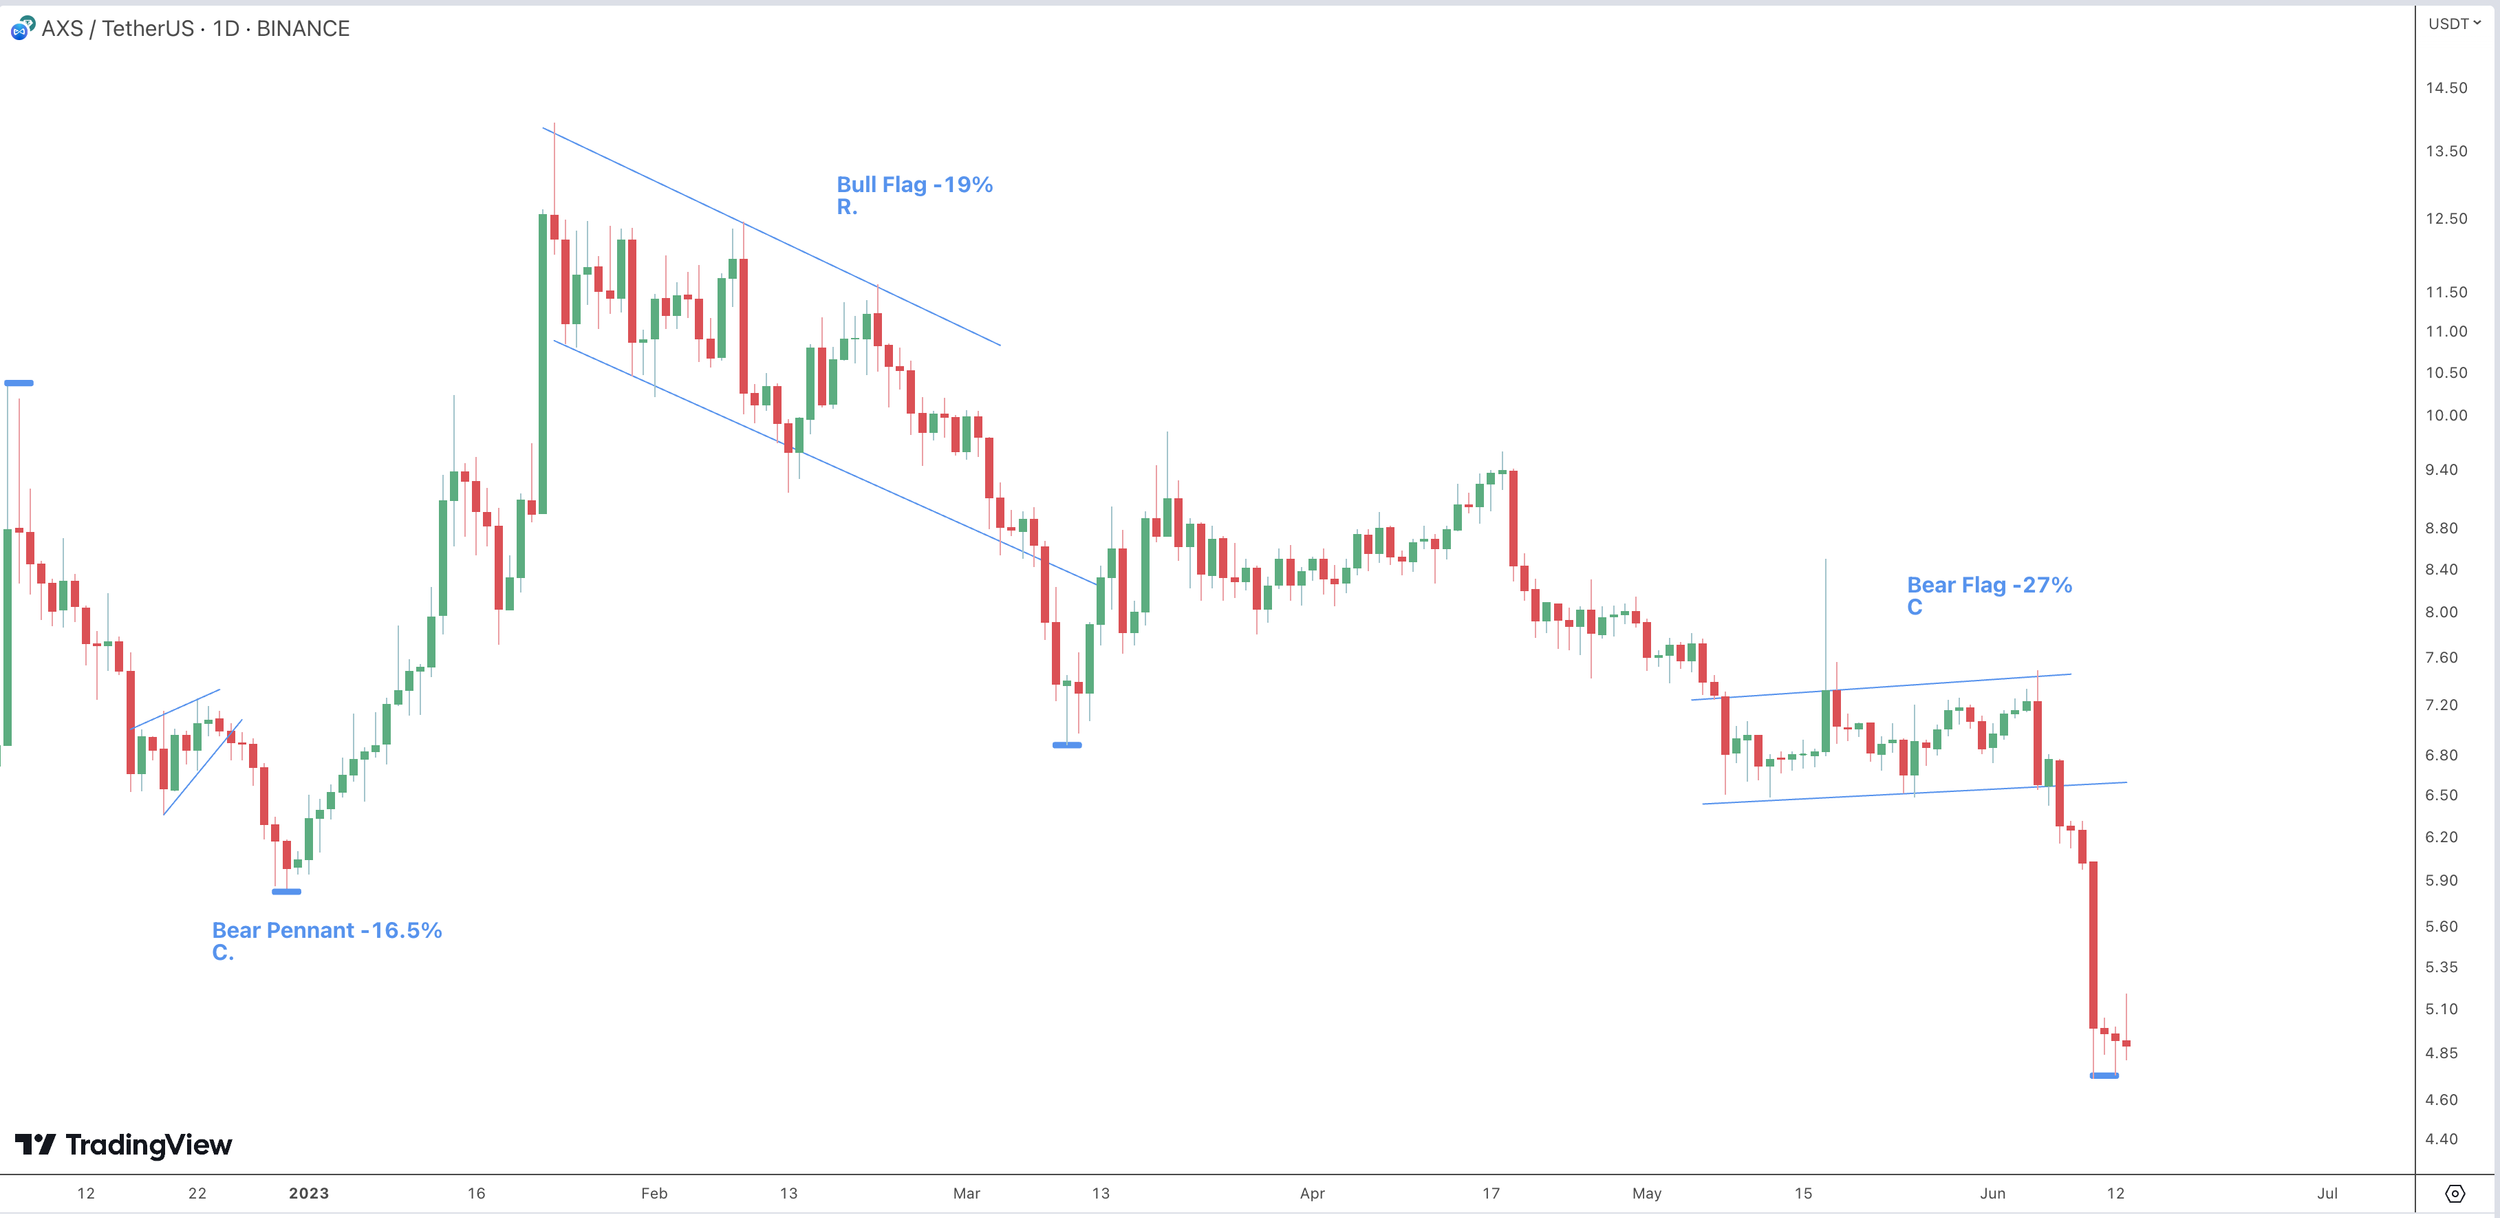
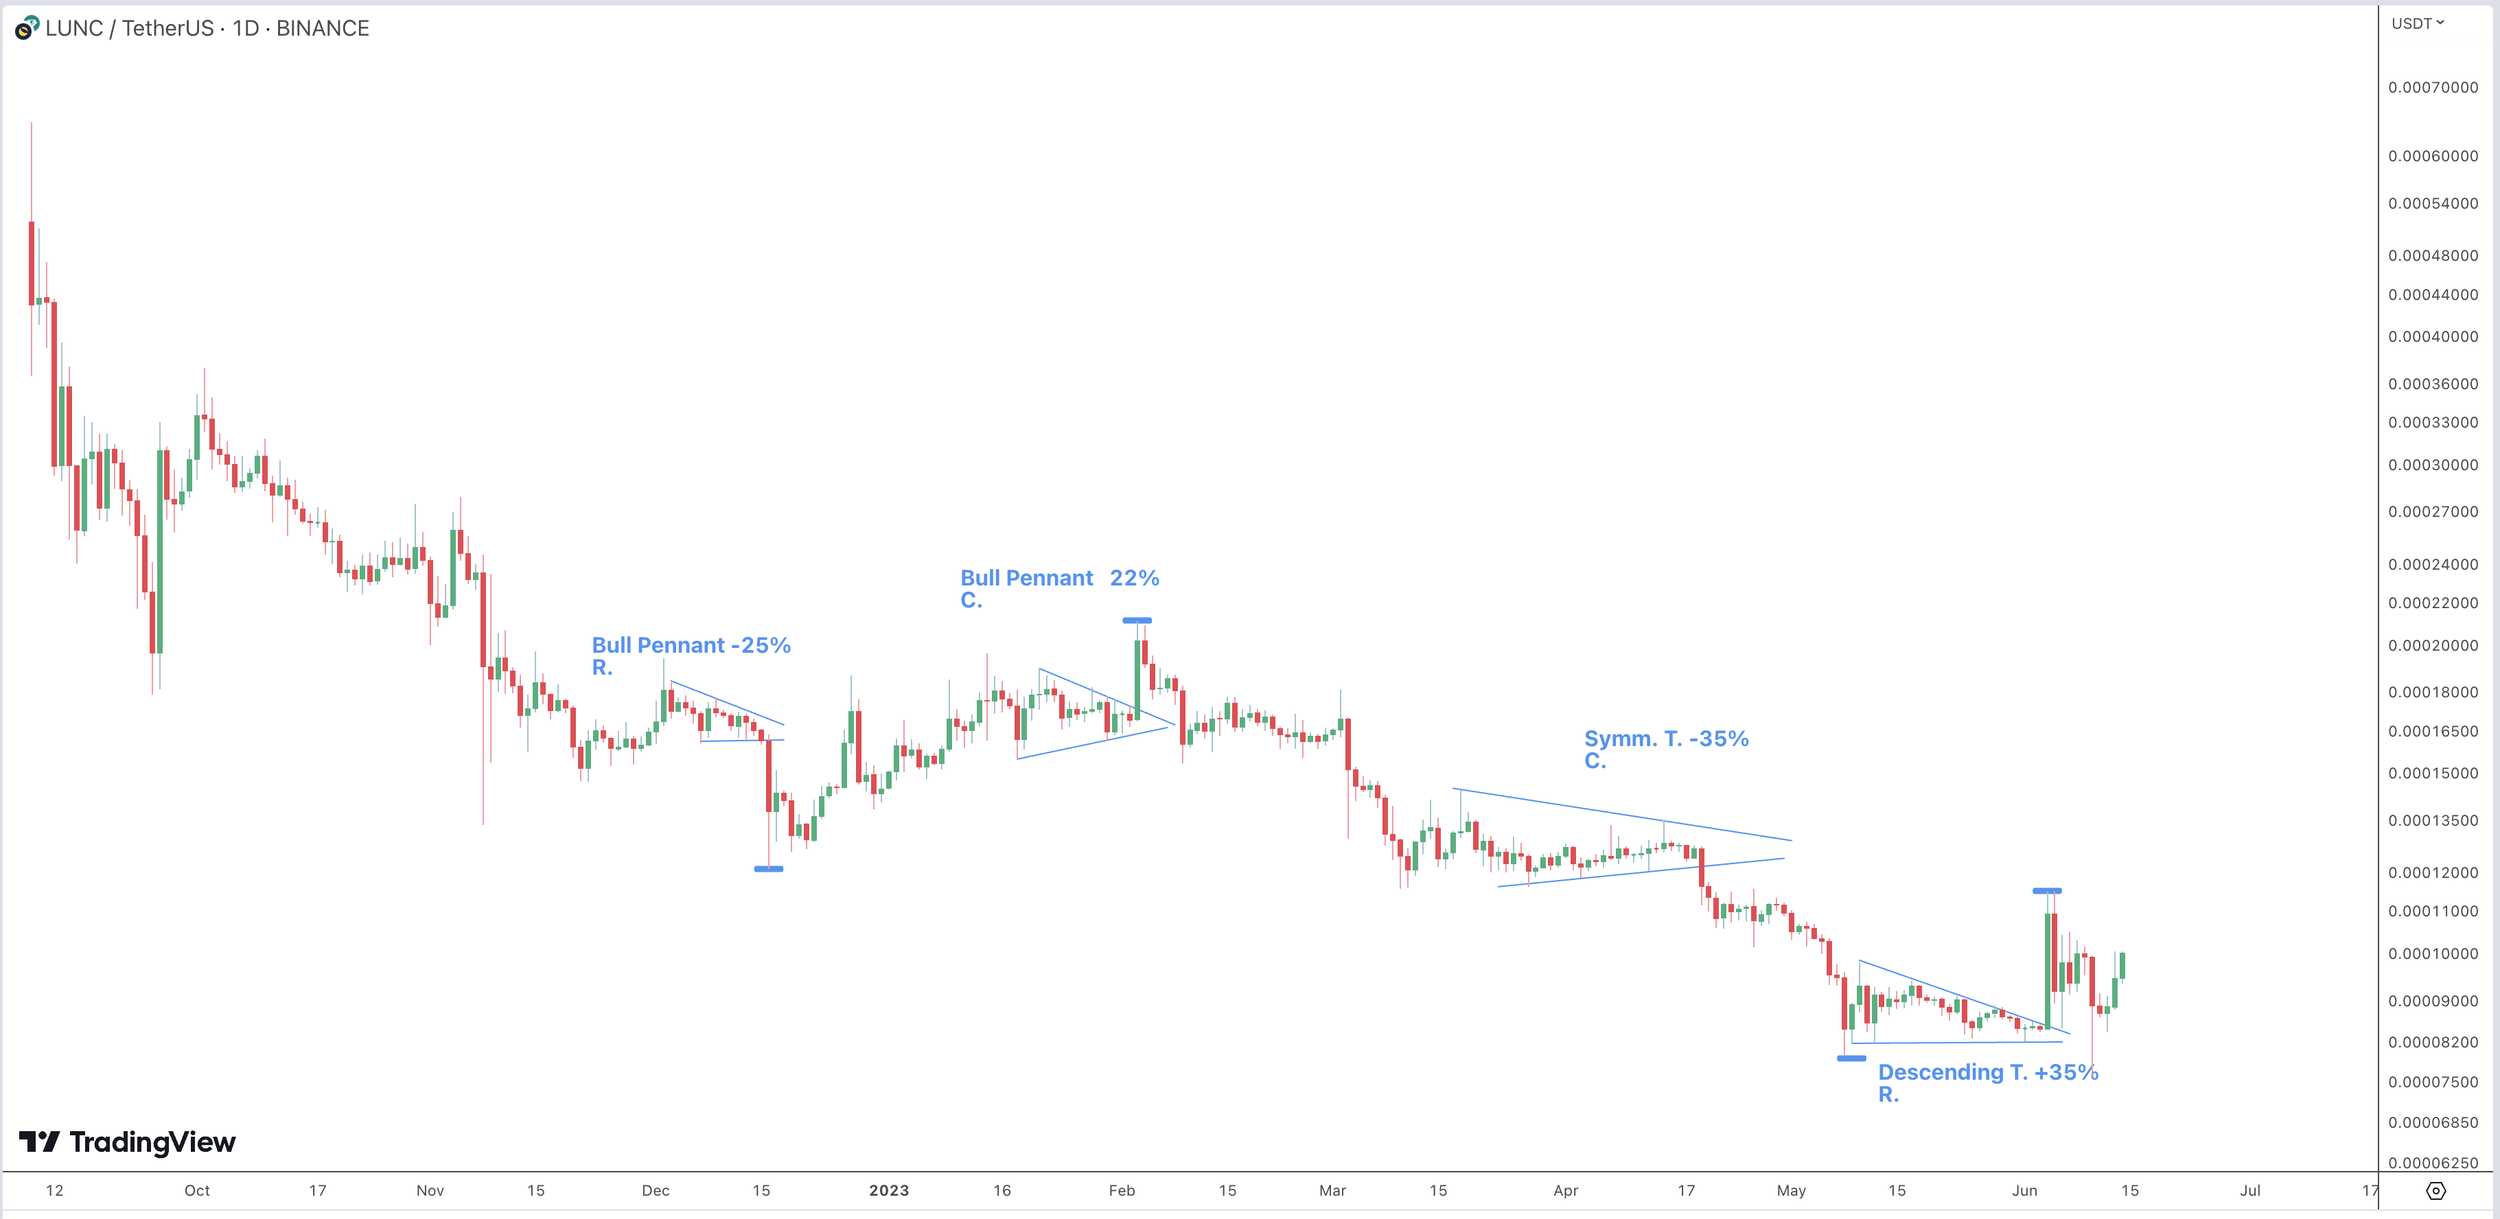
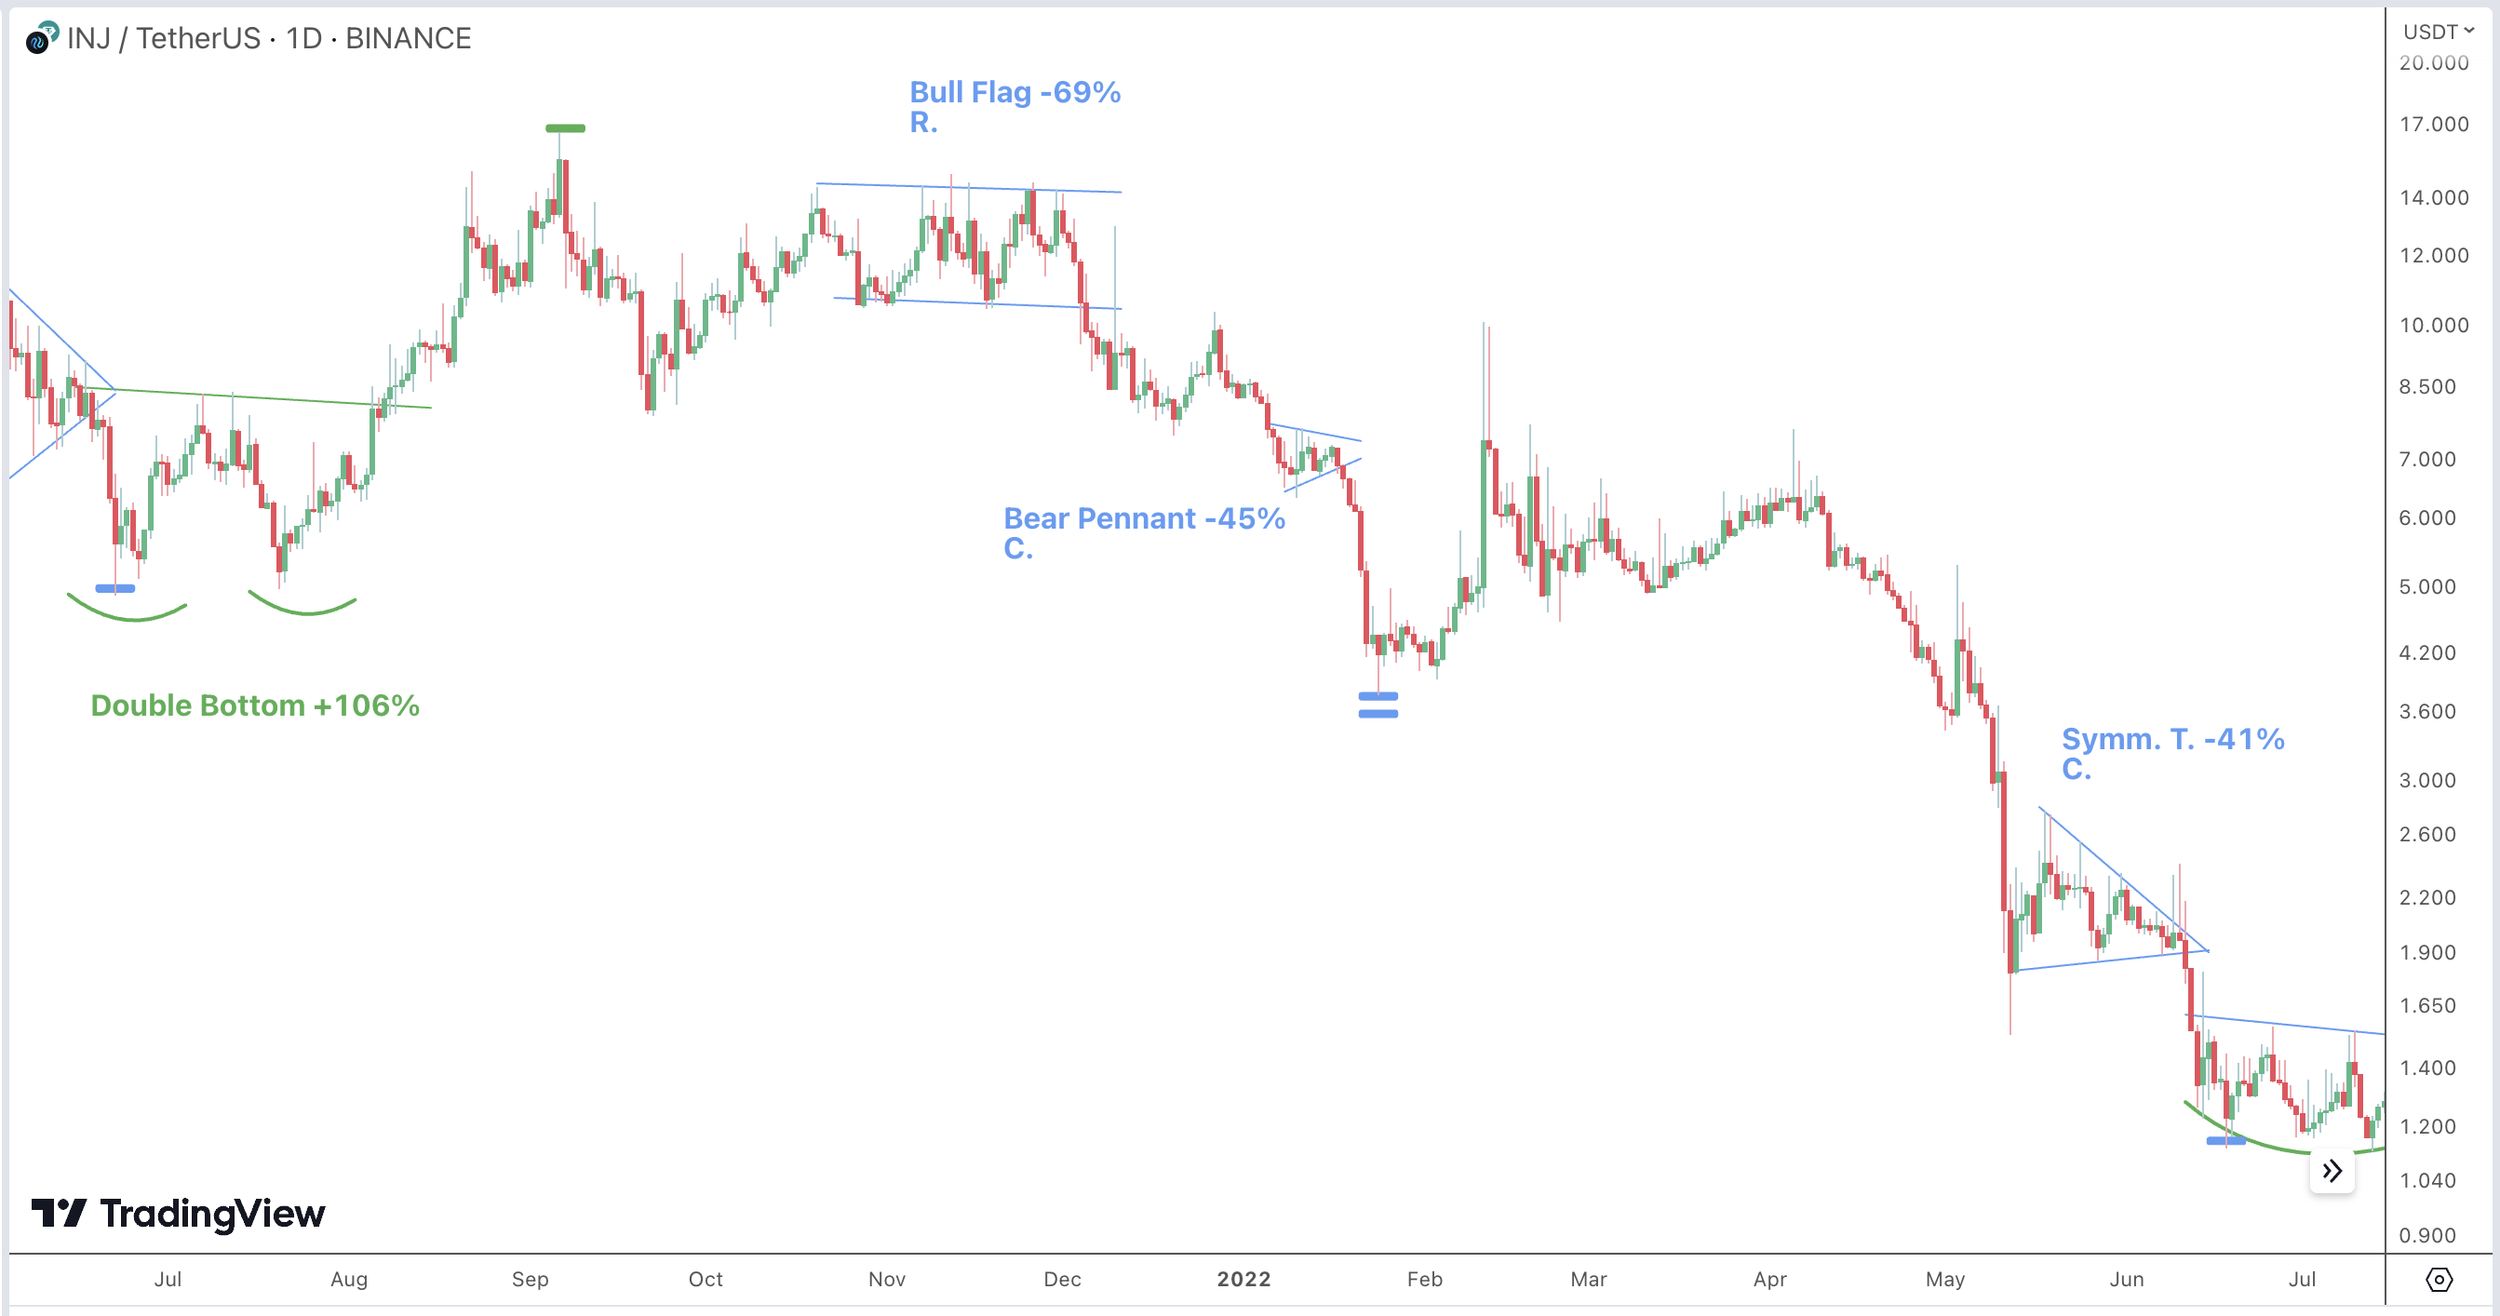
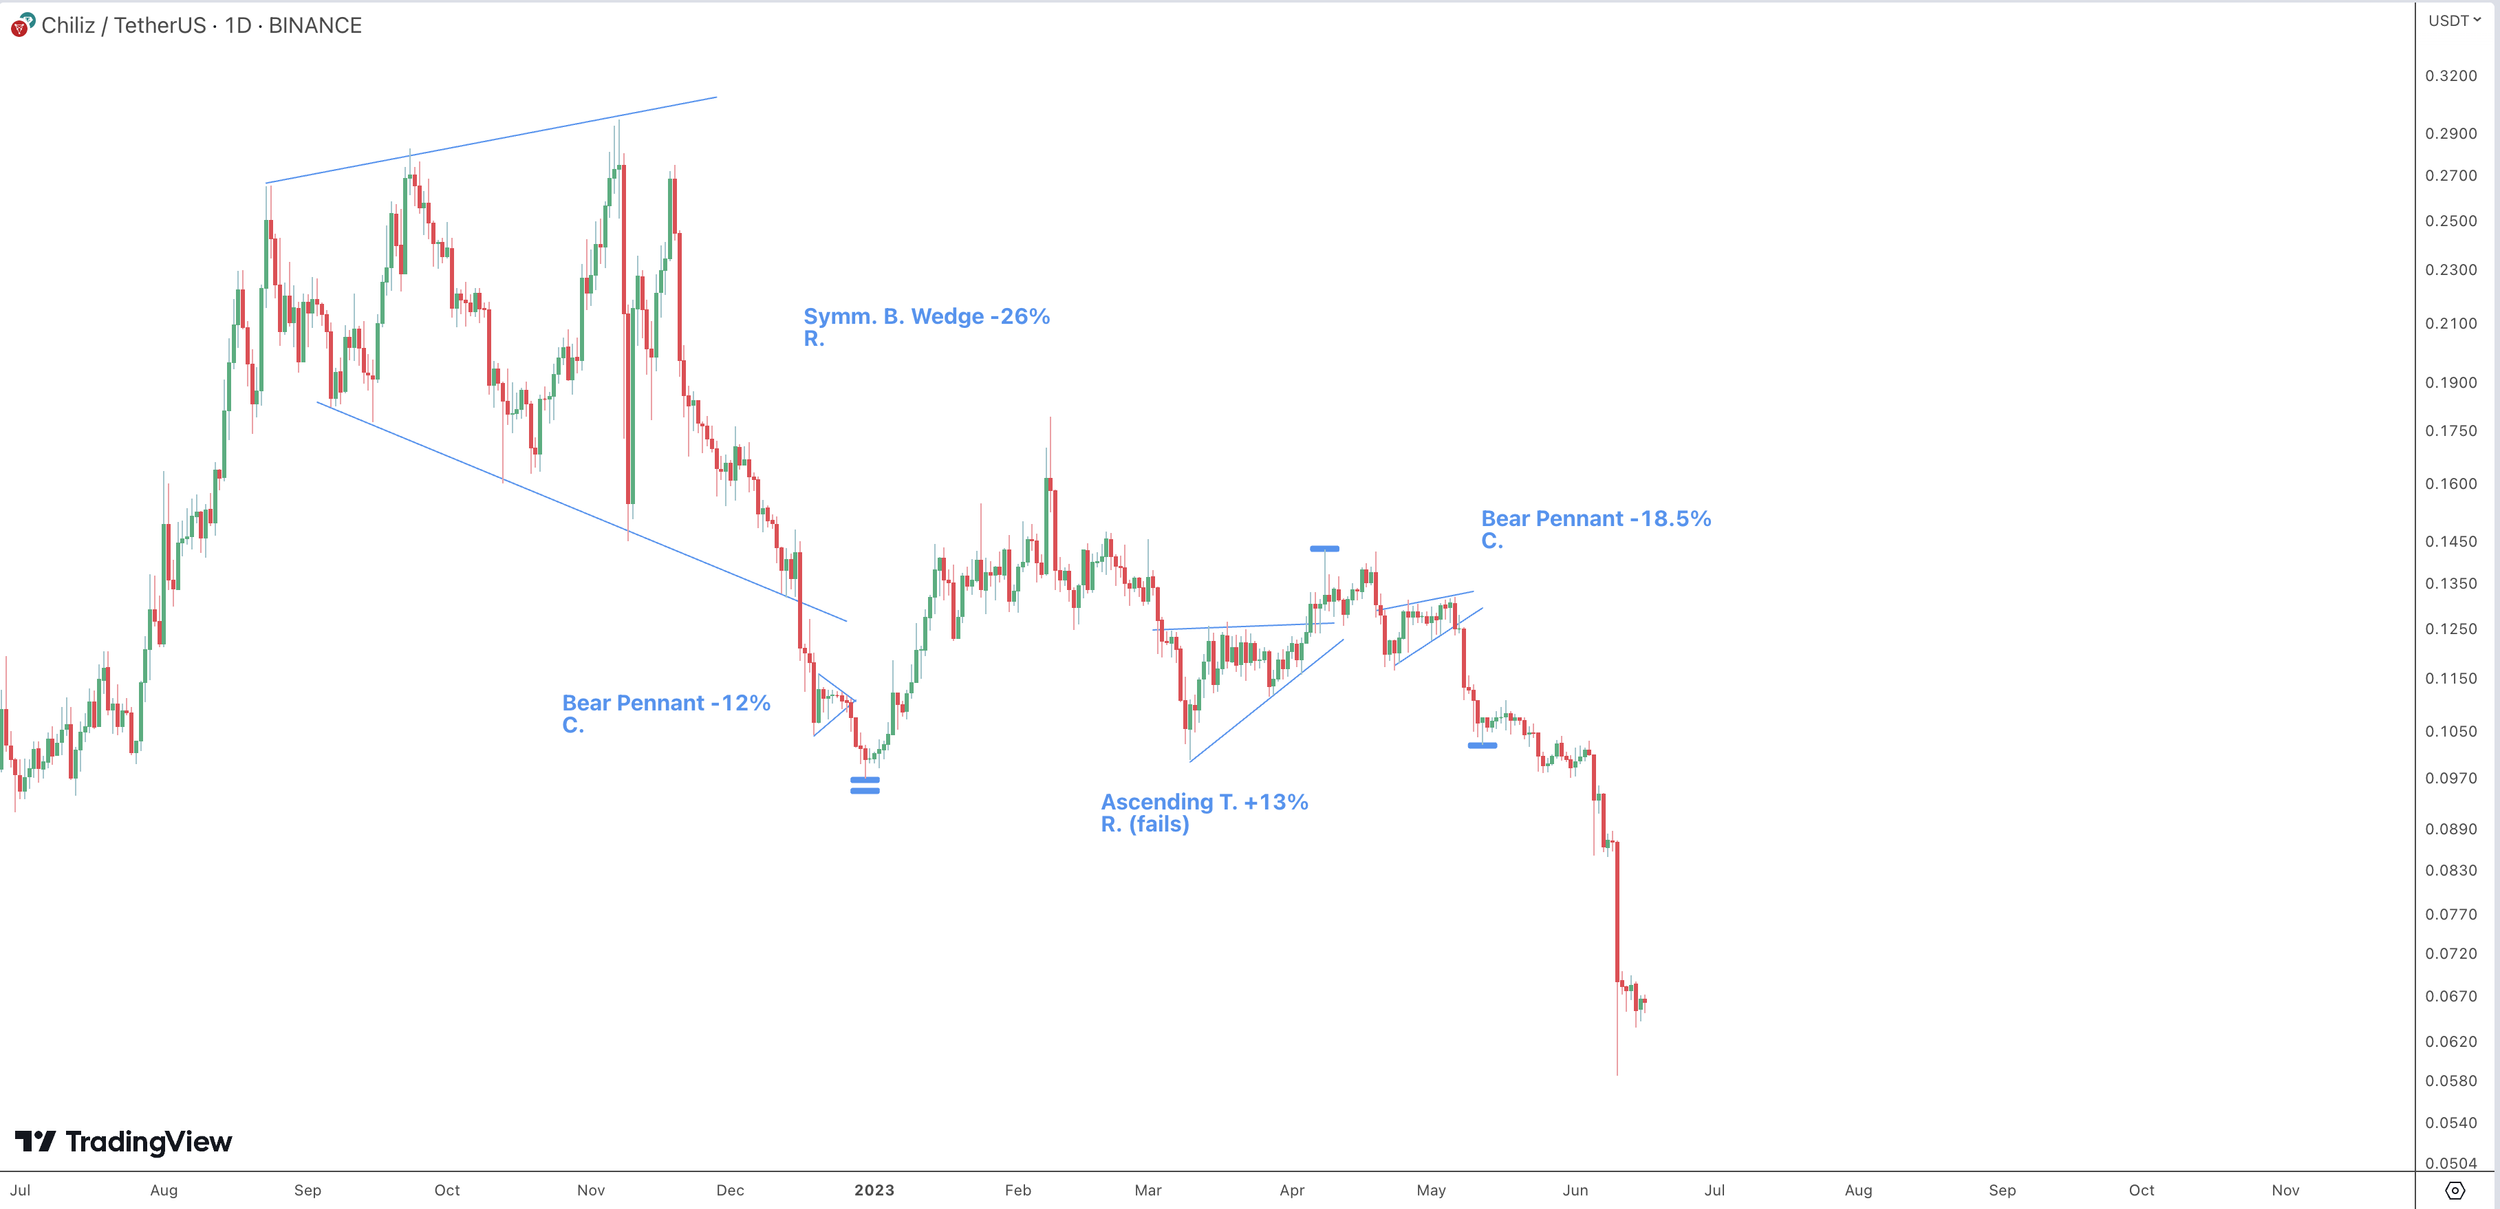
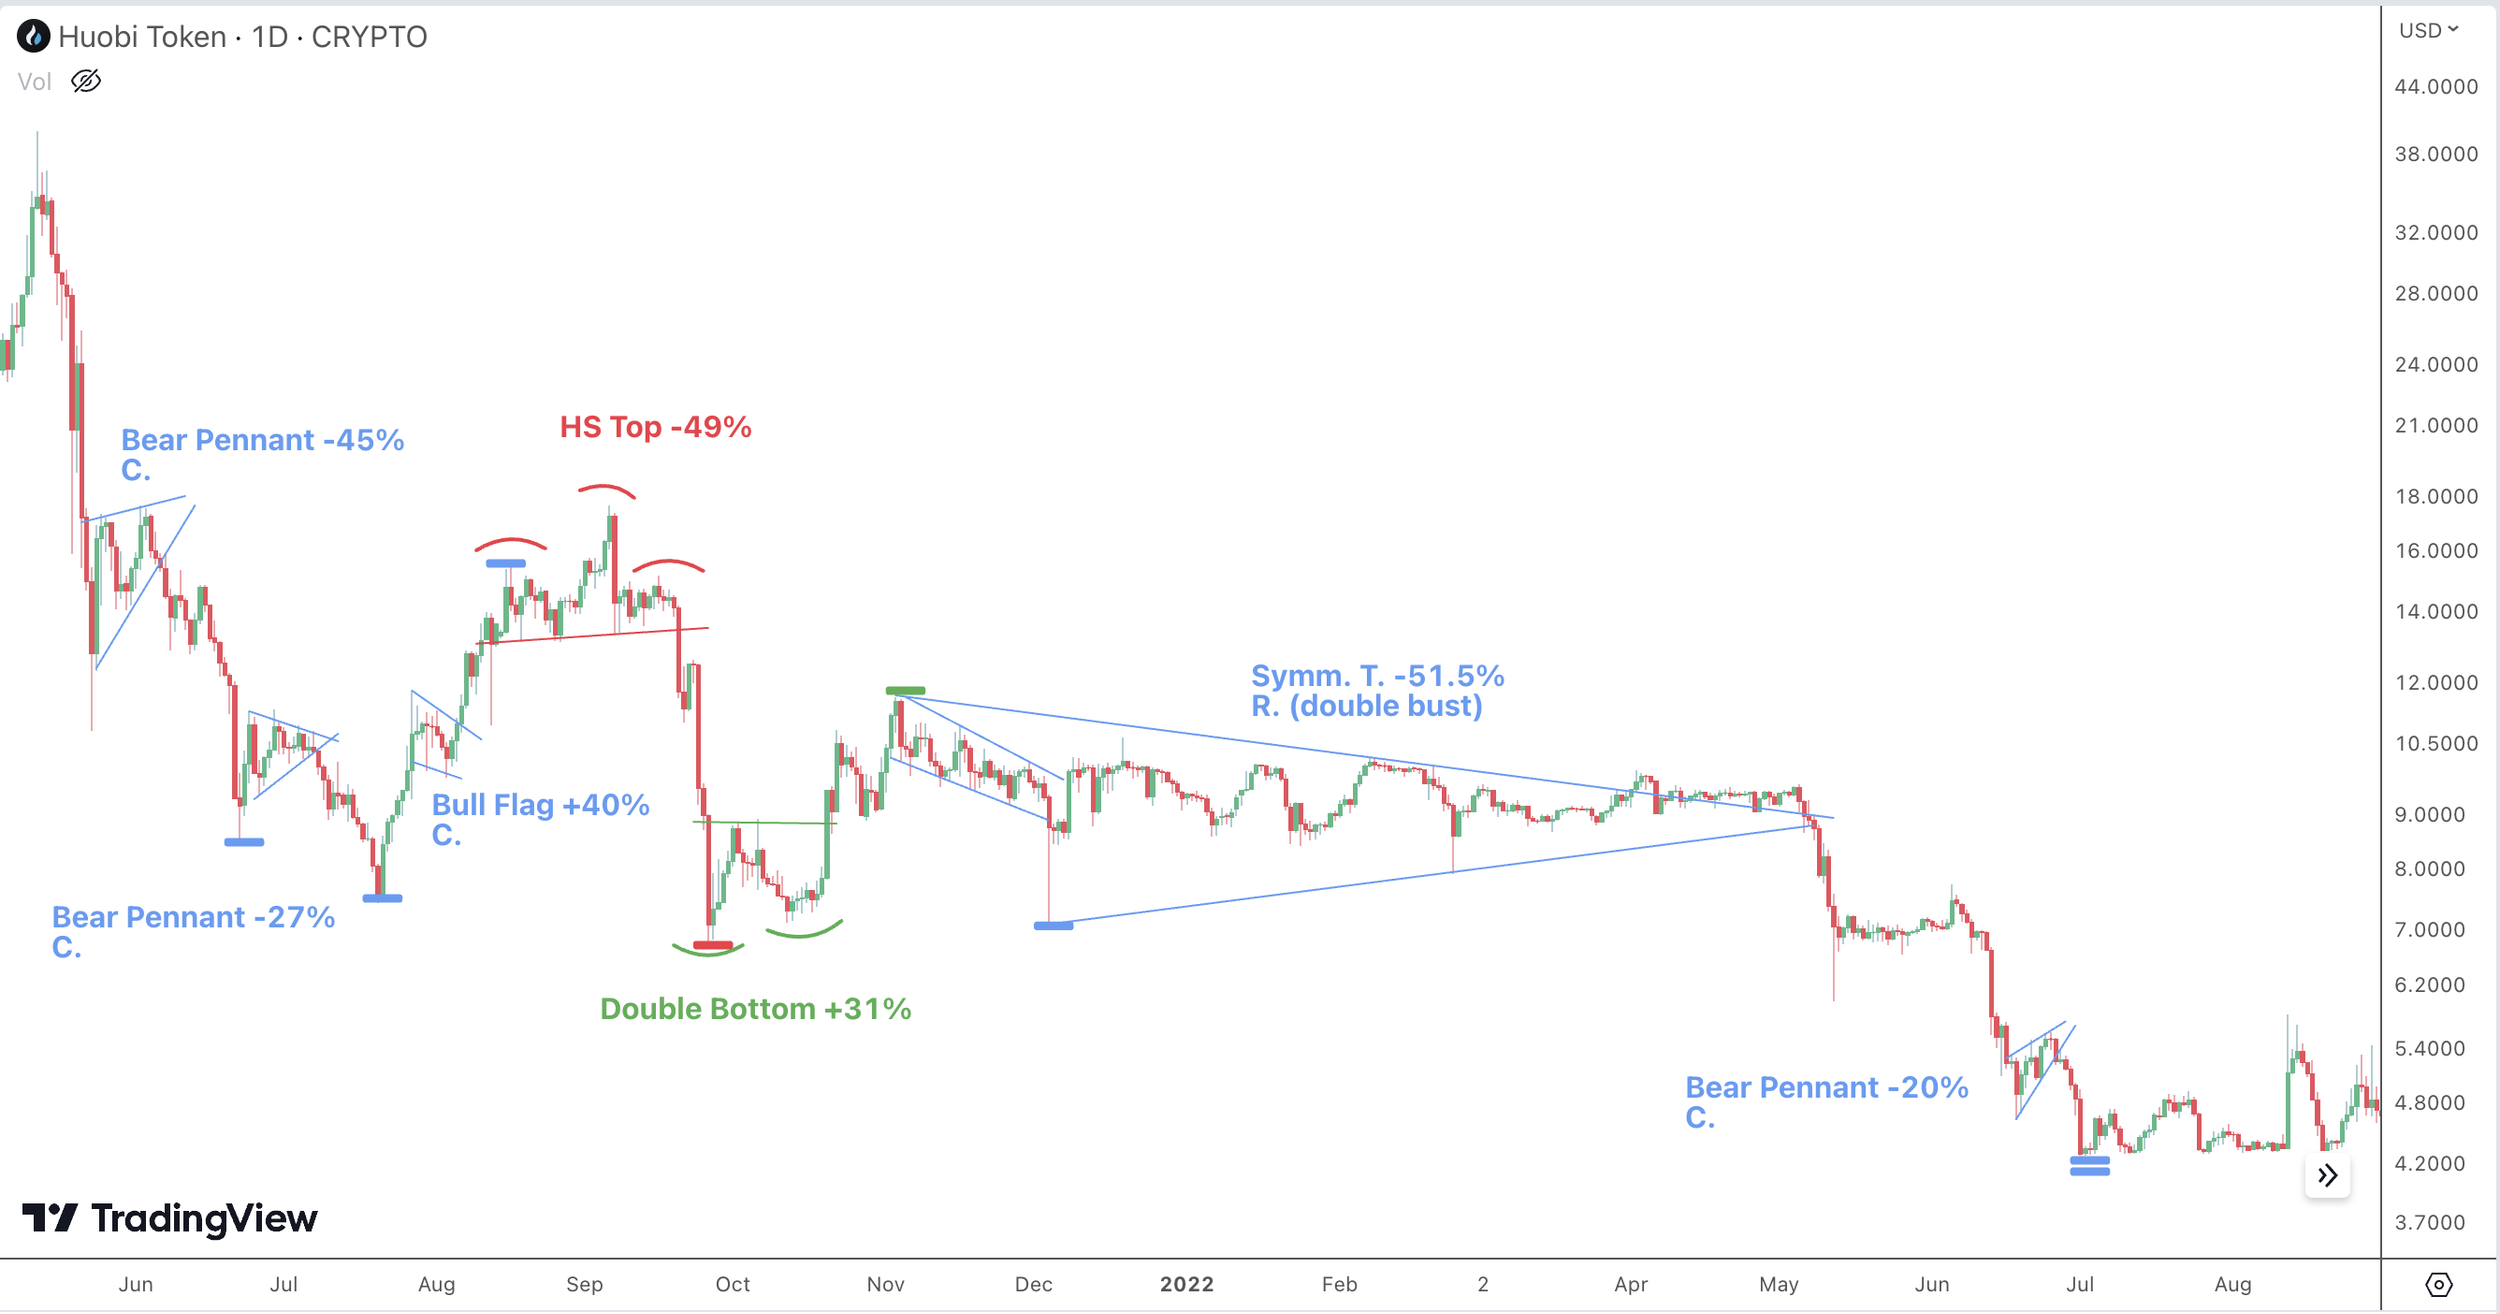
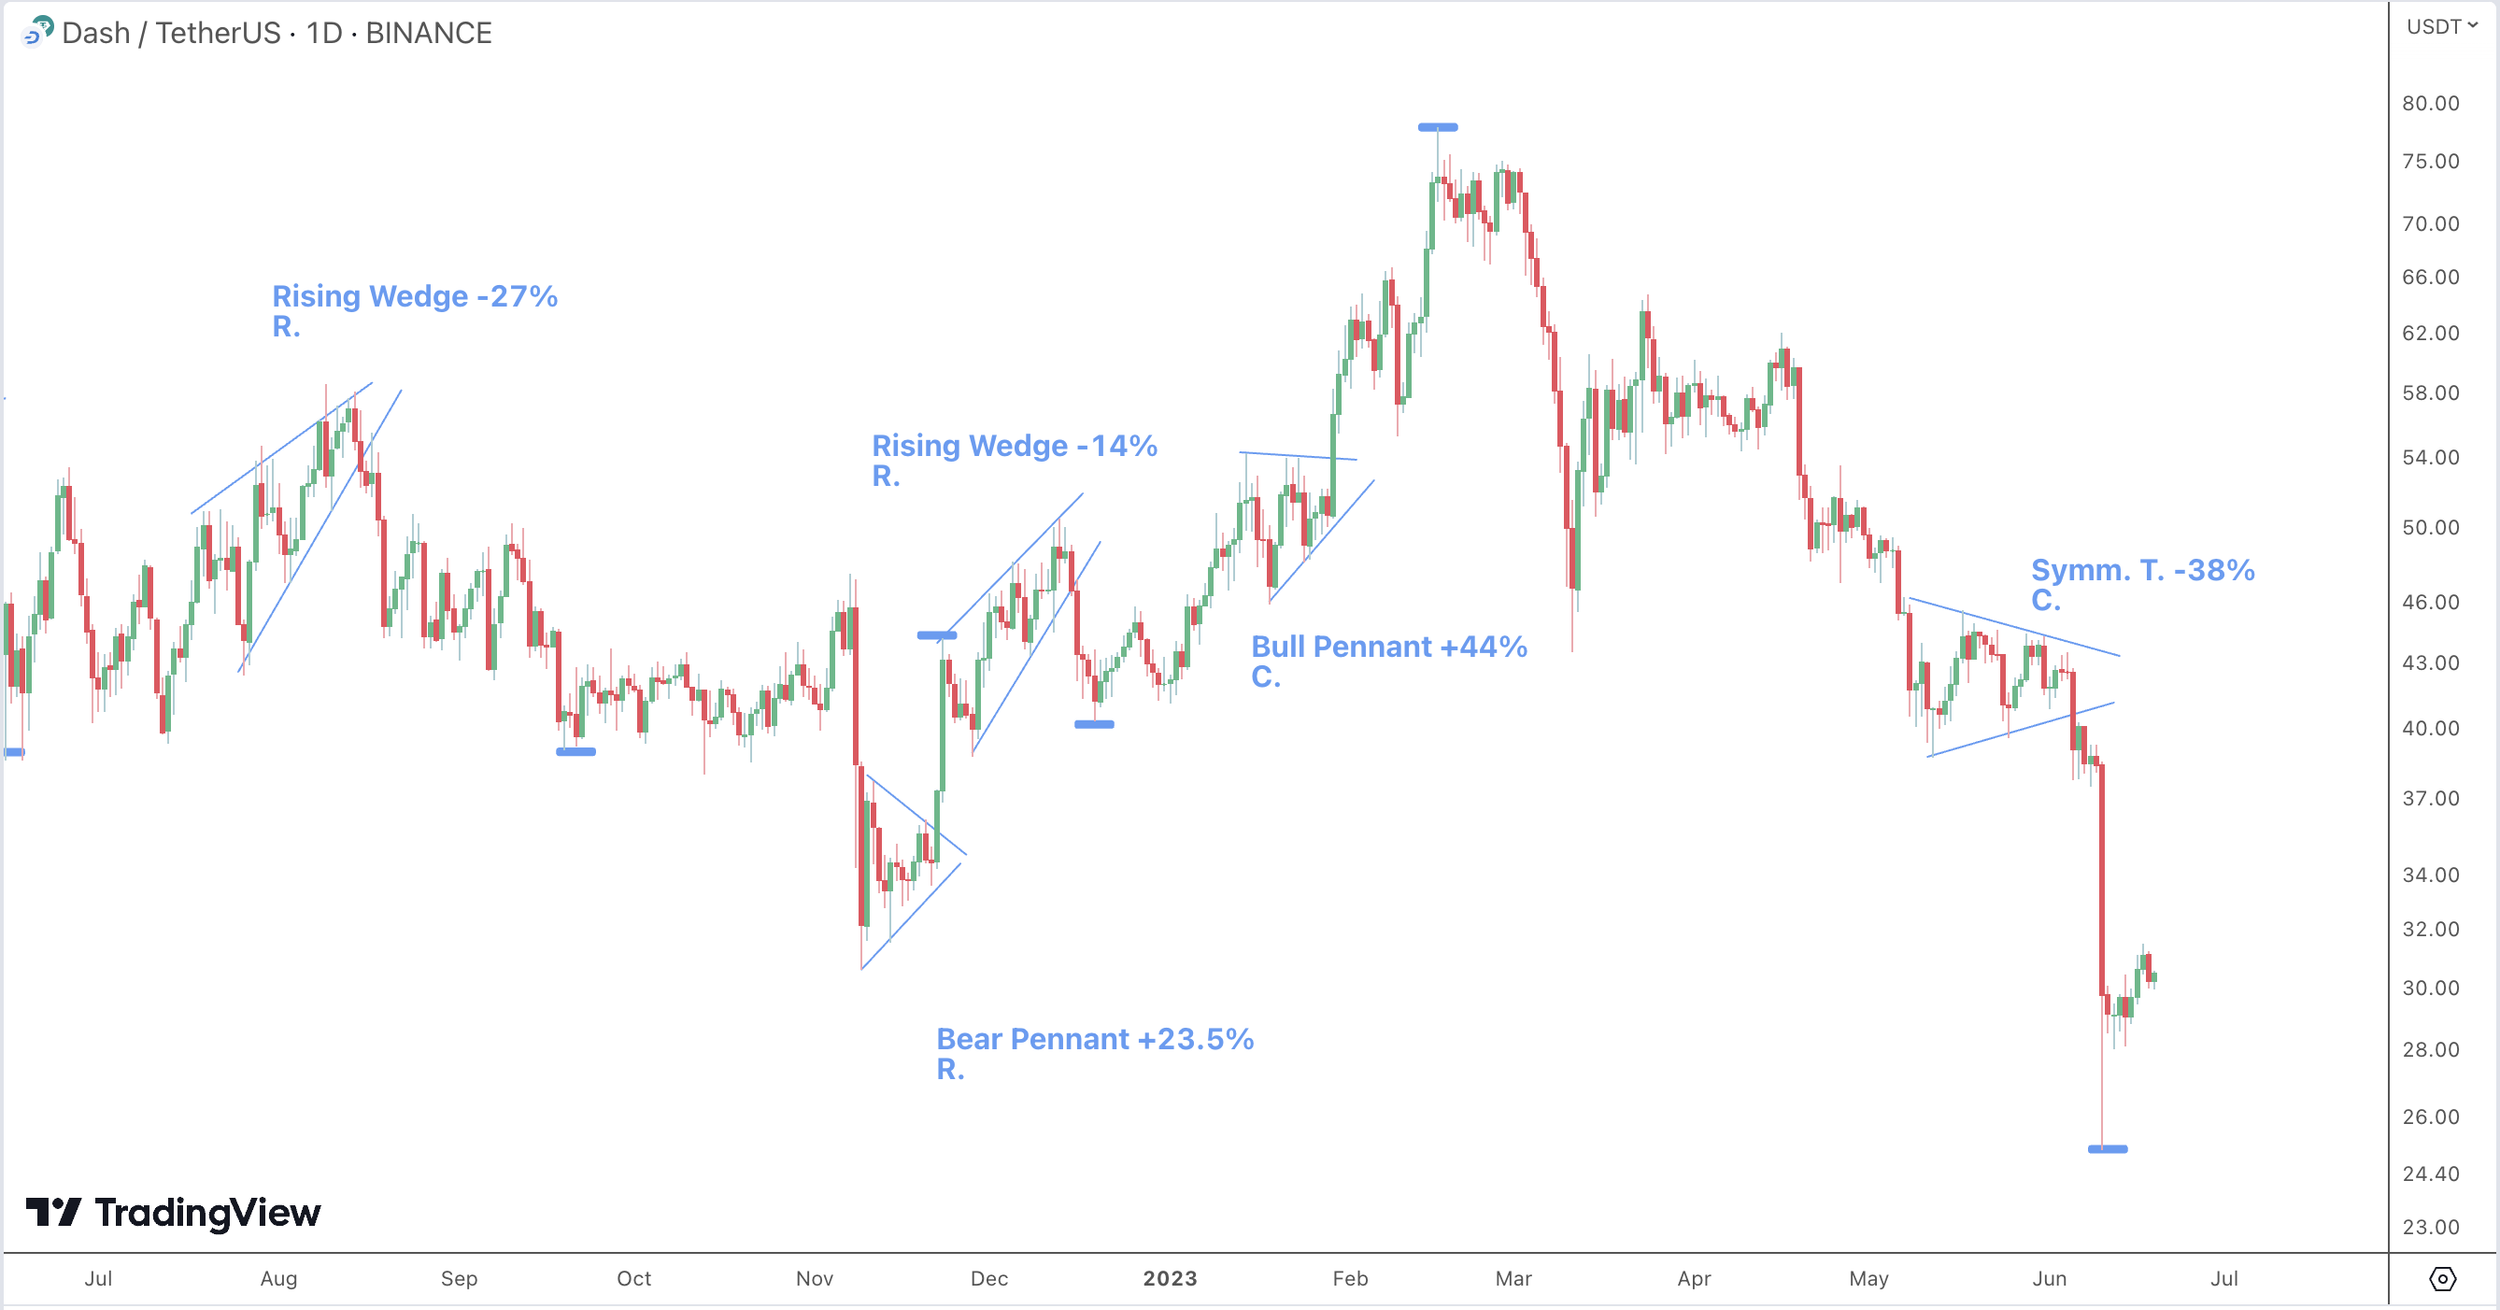
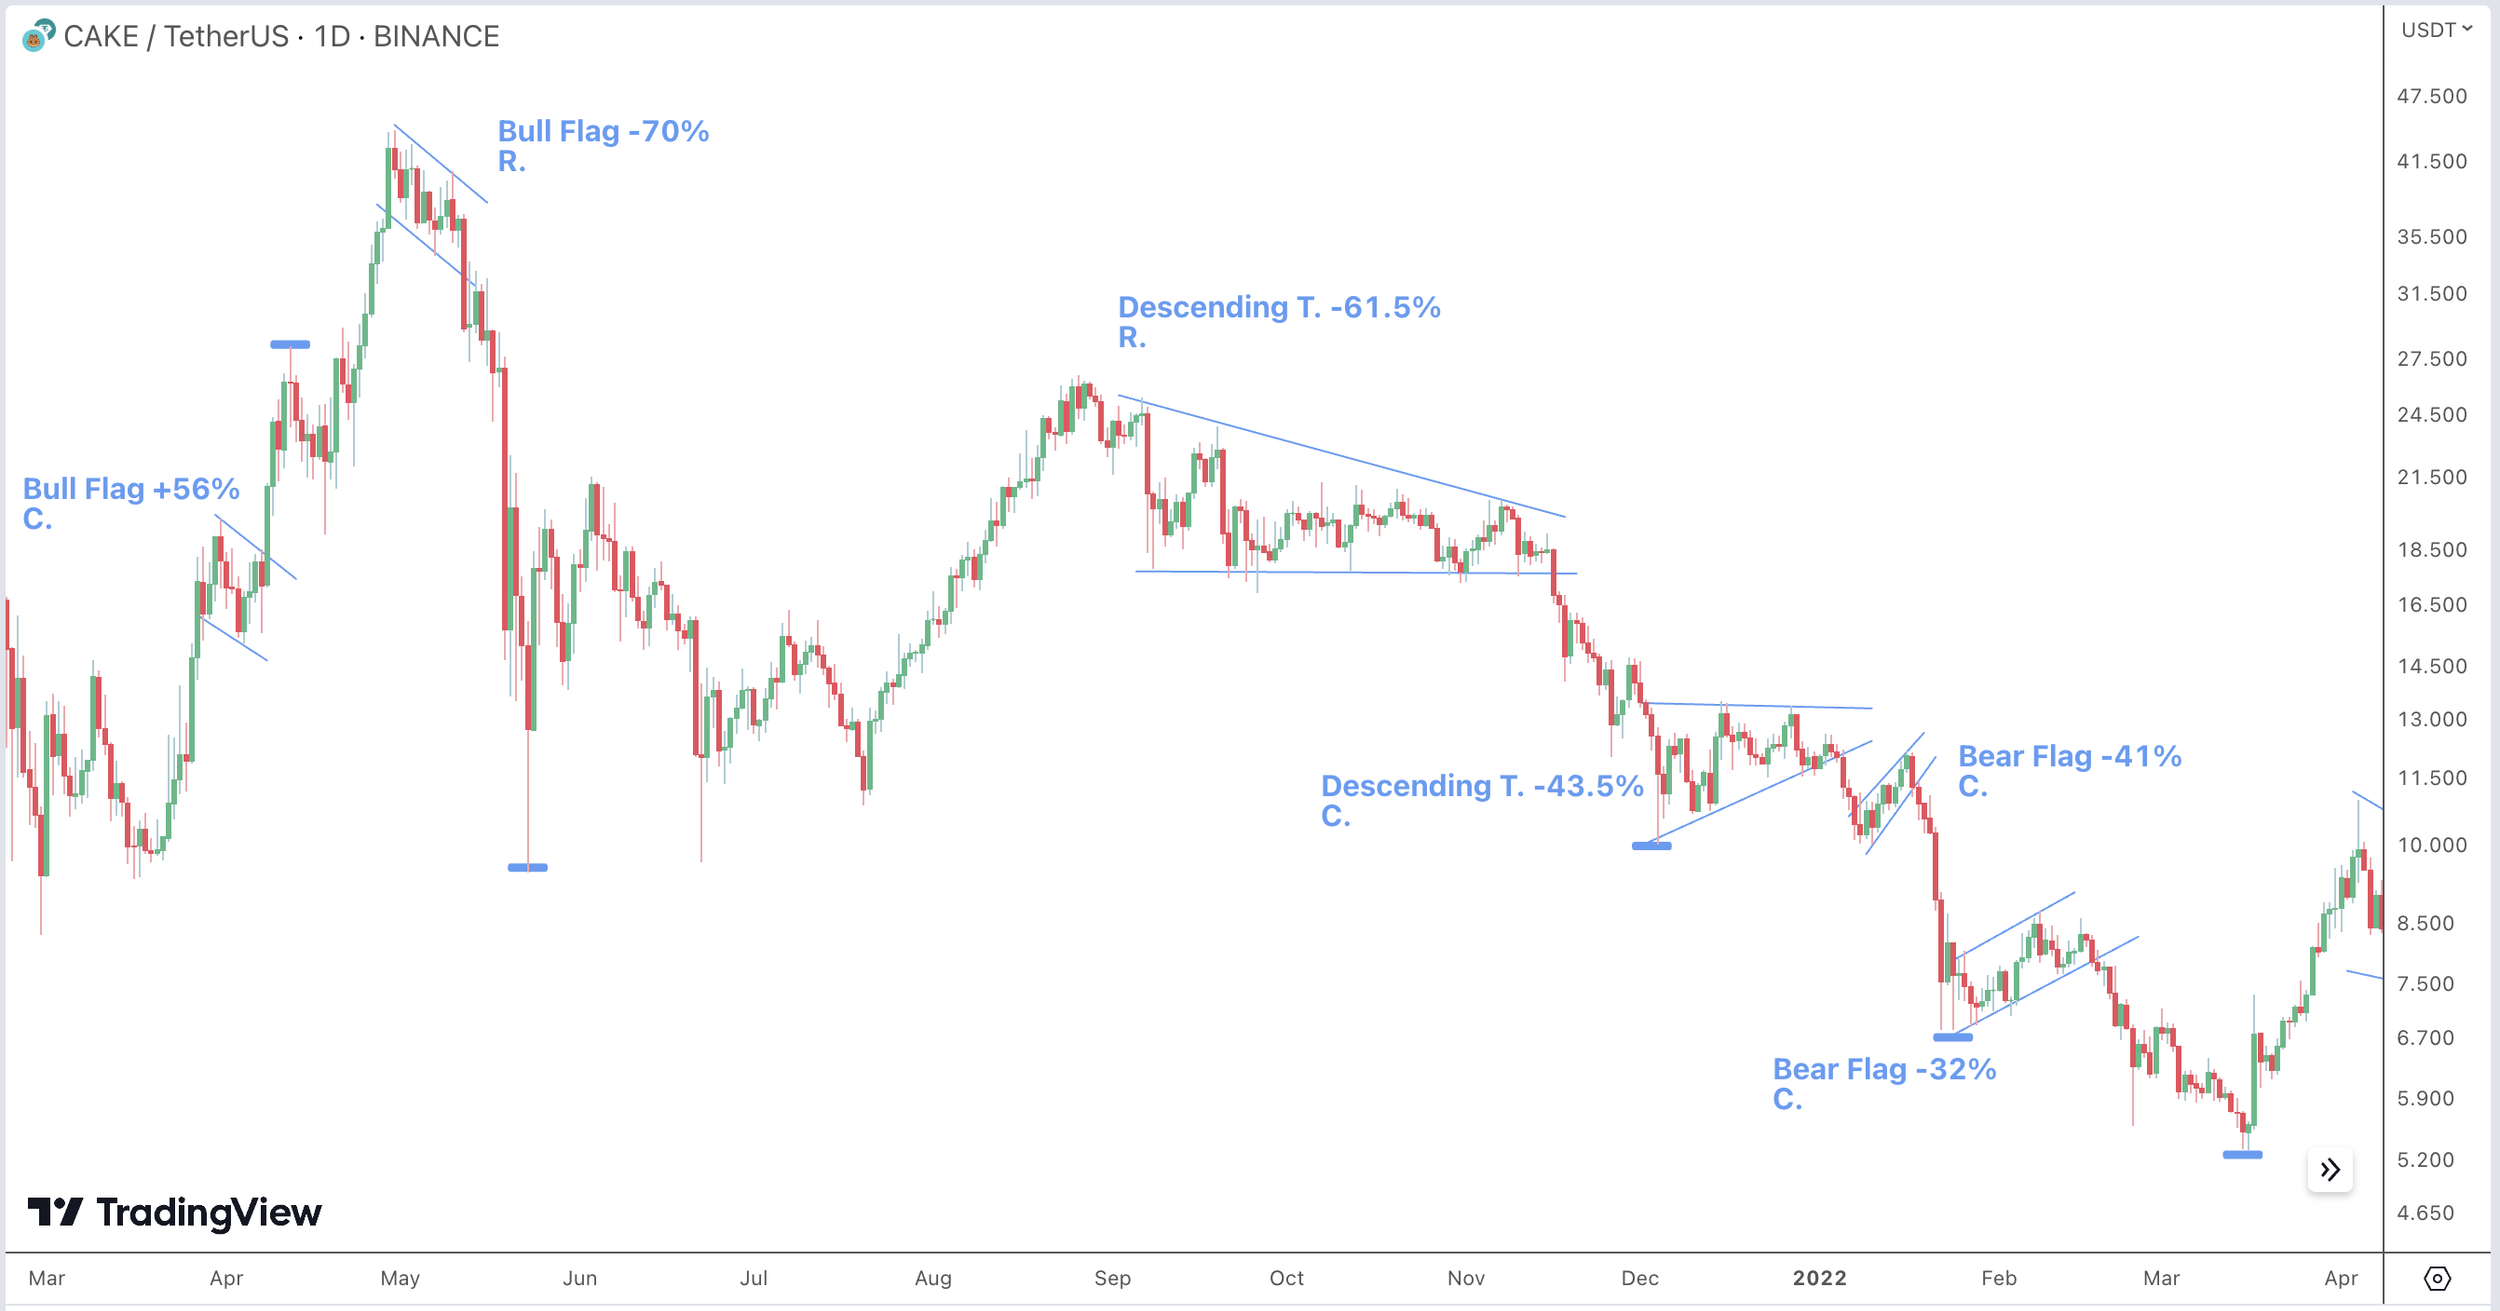
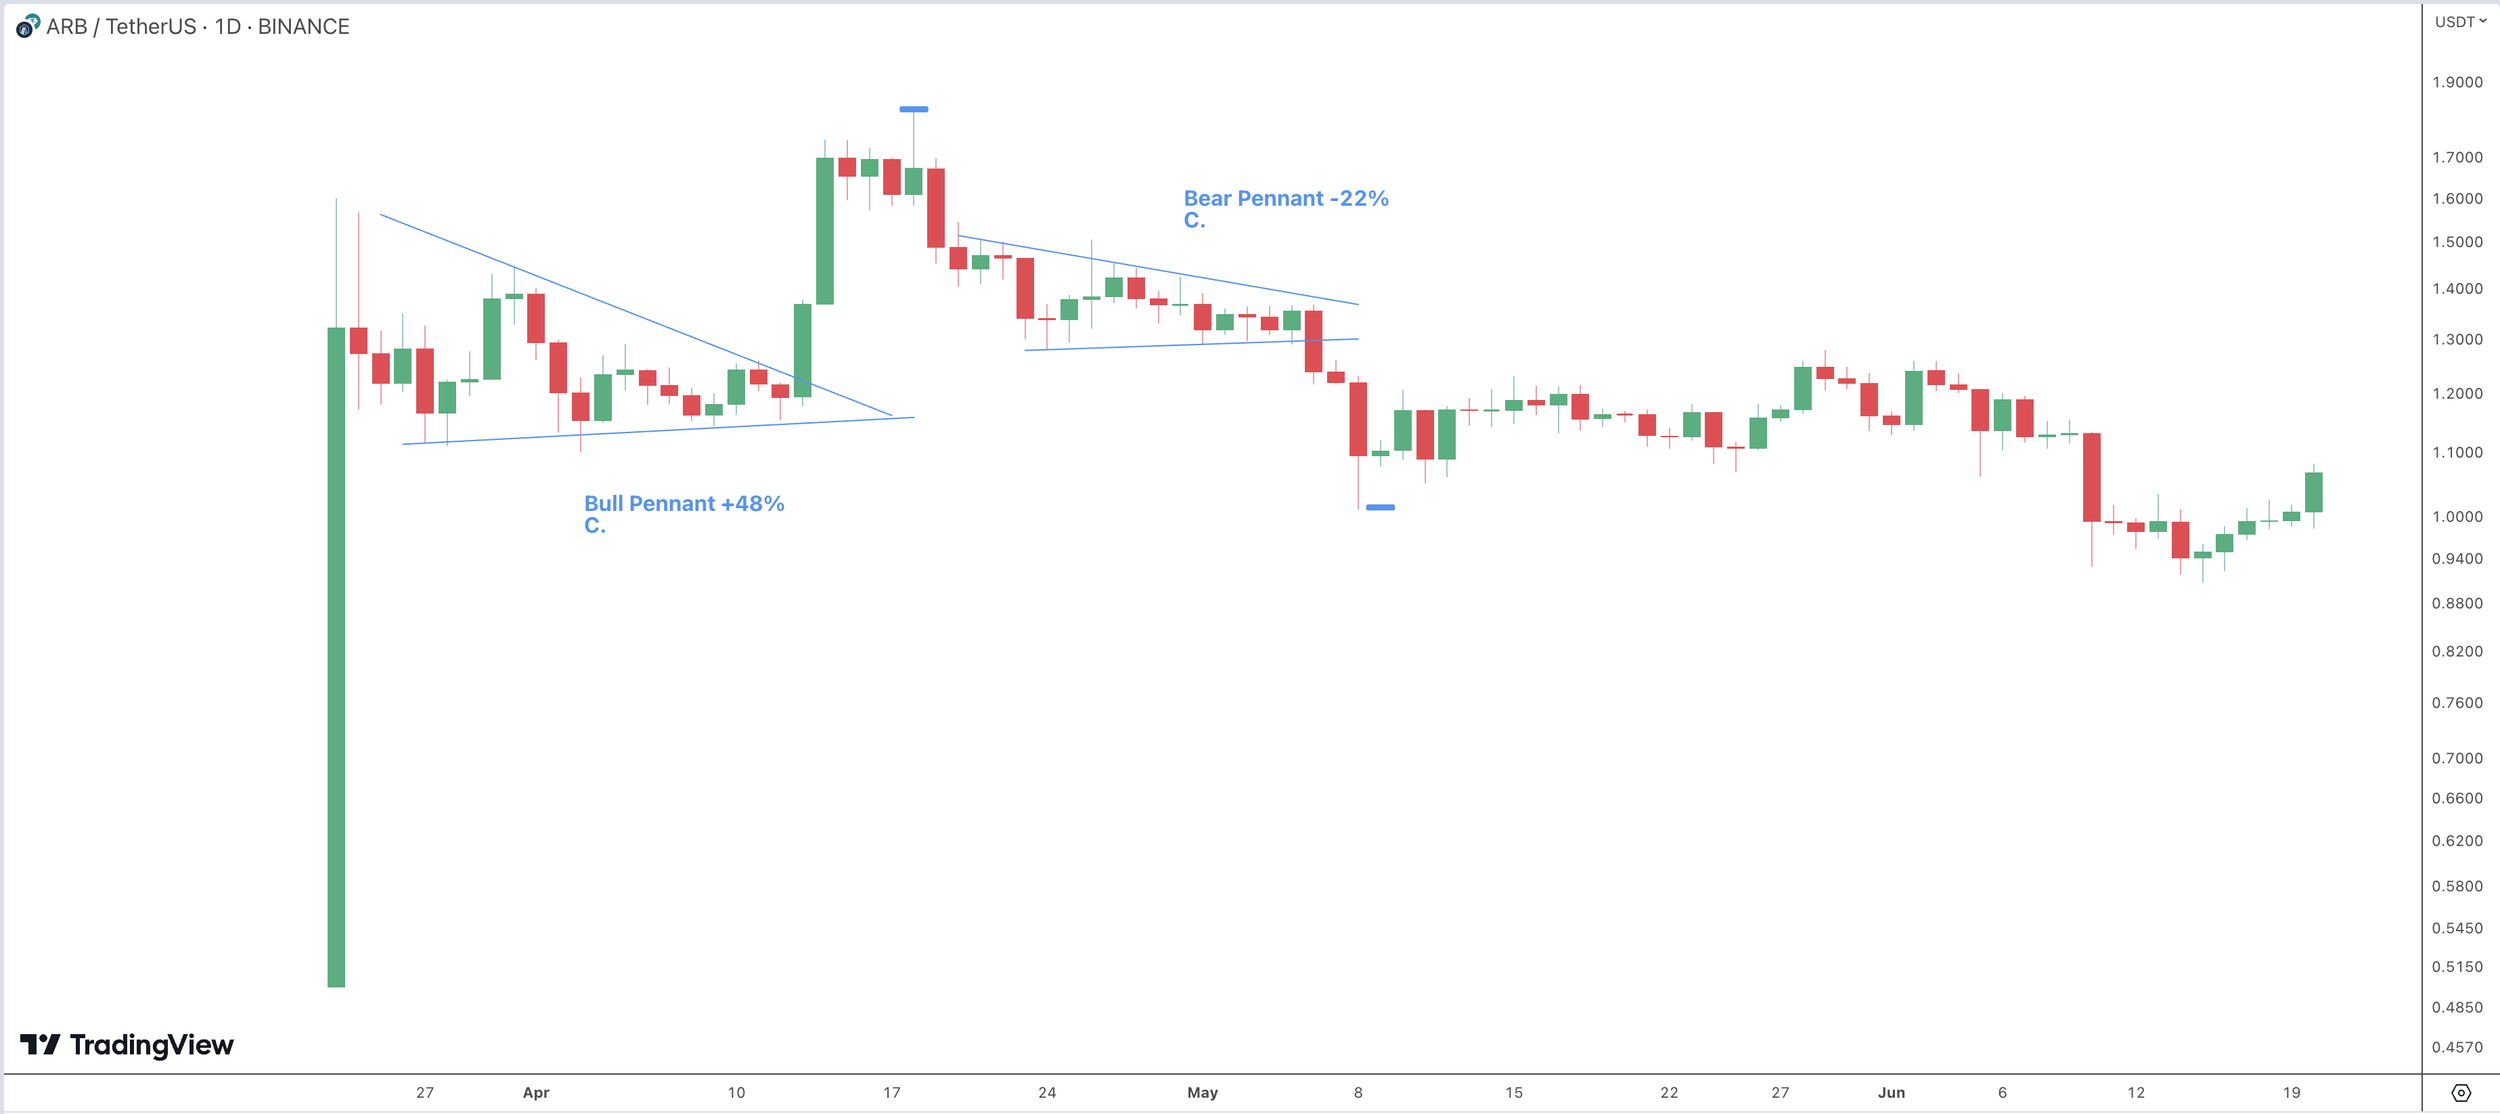
The Pennant continuation bias is undeniable!
Don’t believe me? Bull pennants acted as a continuation 68.5% of the time, while bear pennants continued the trend 82.5% of the time! 962 pennants were examined in this study!
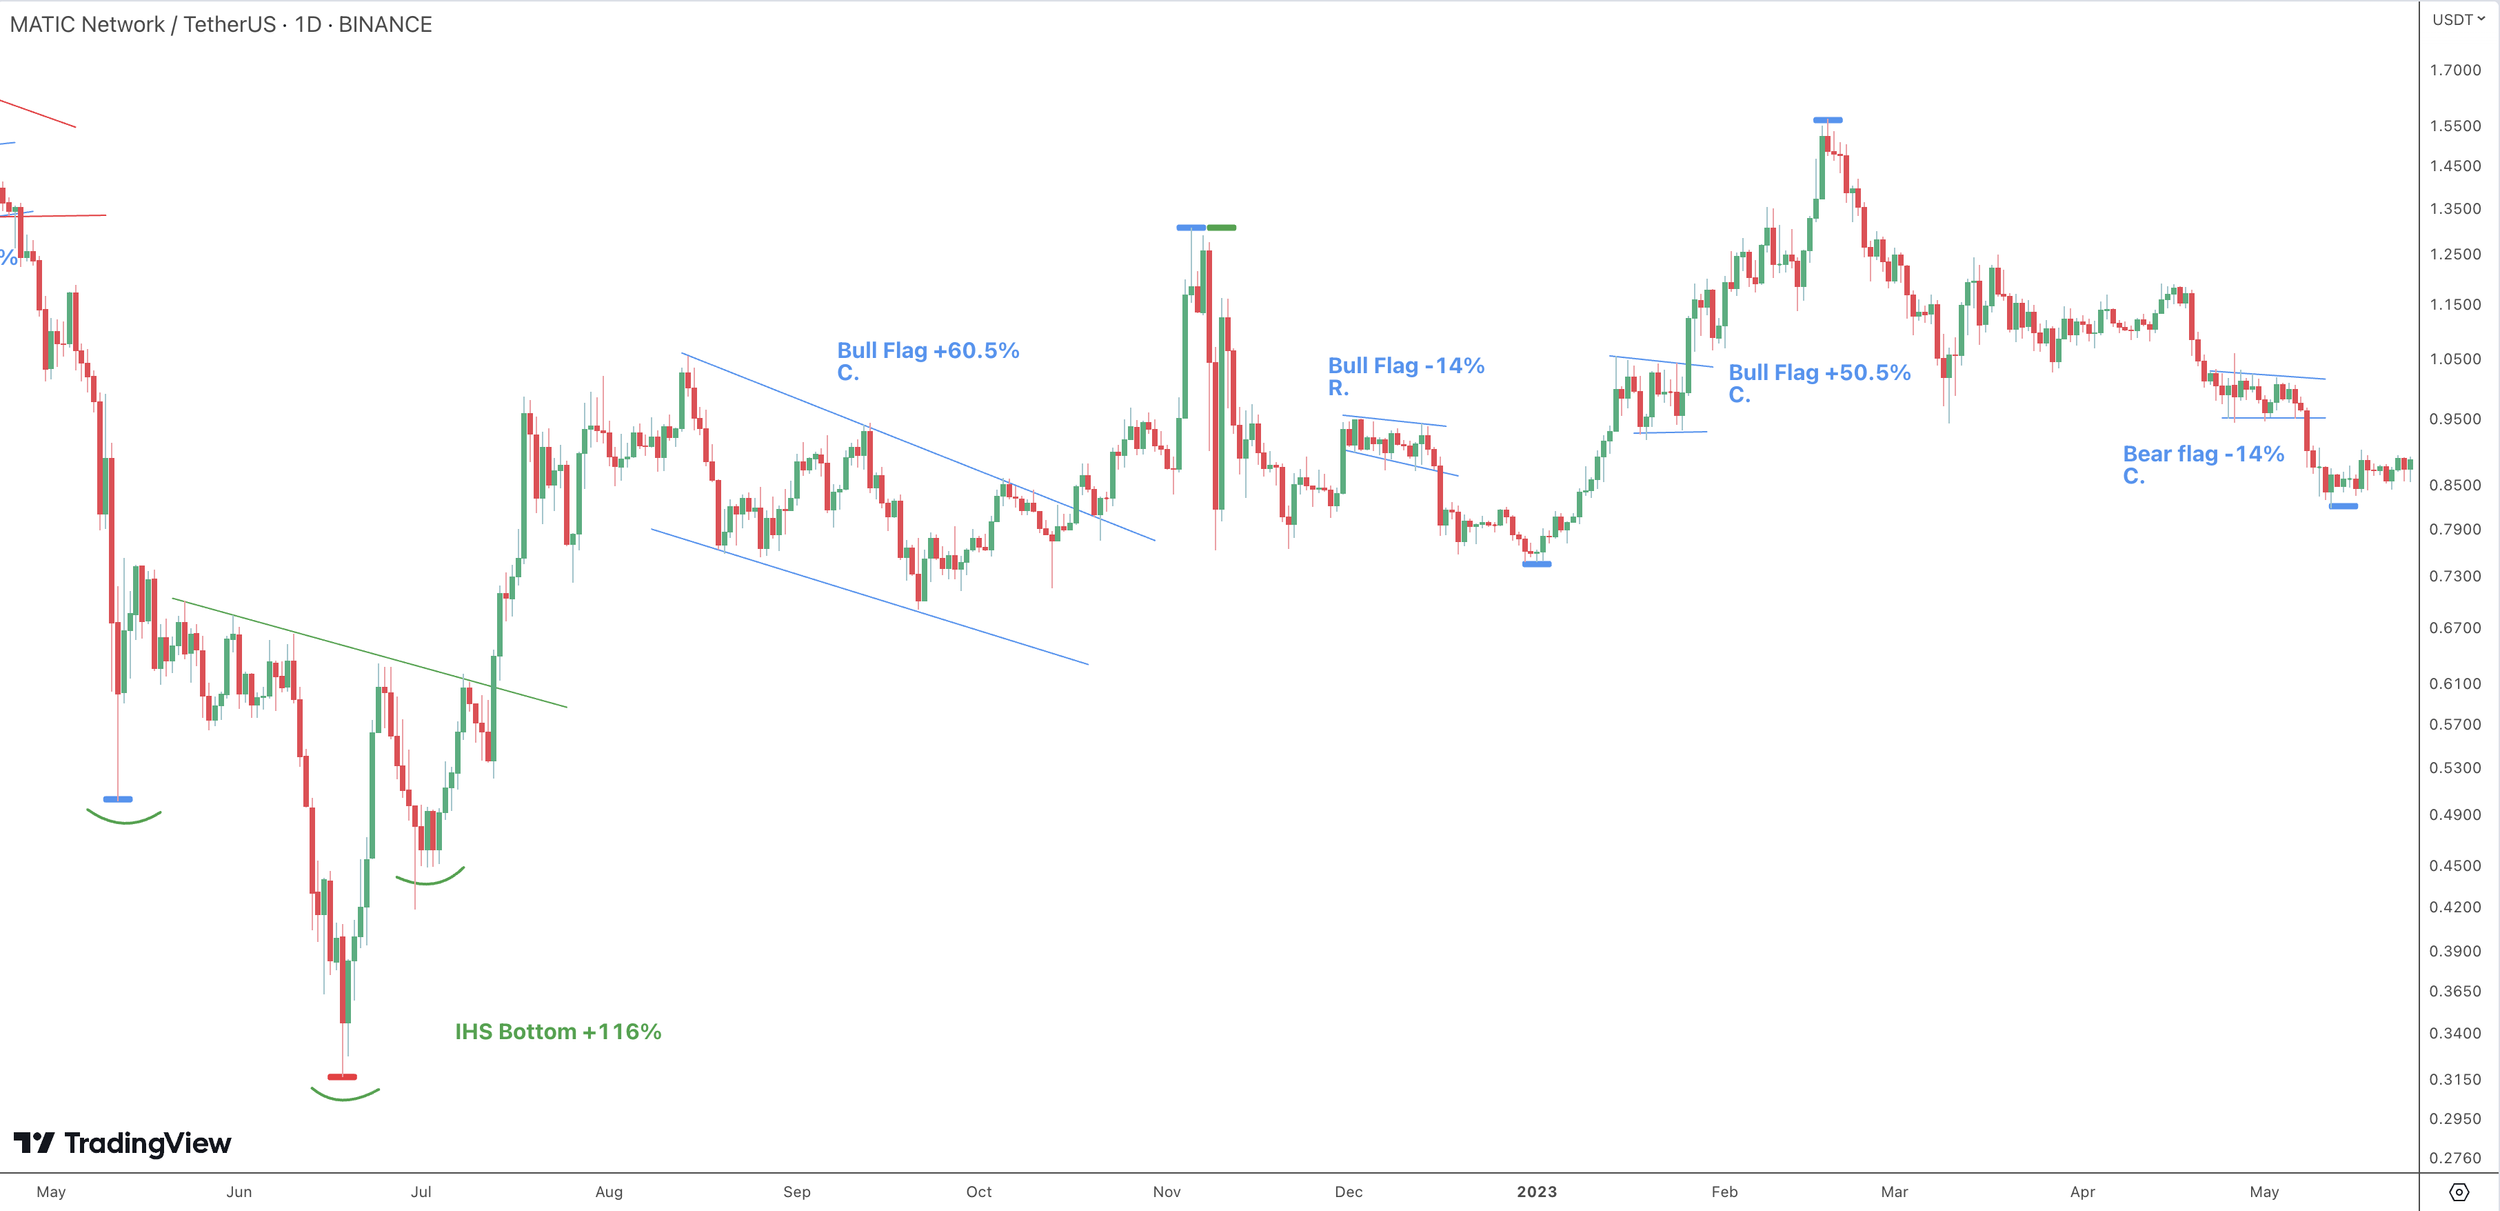
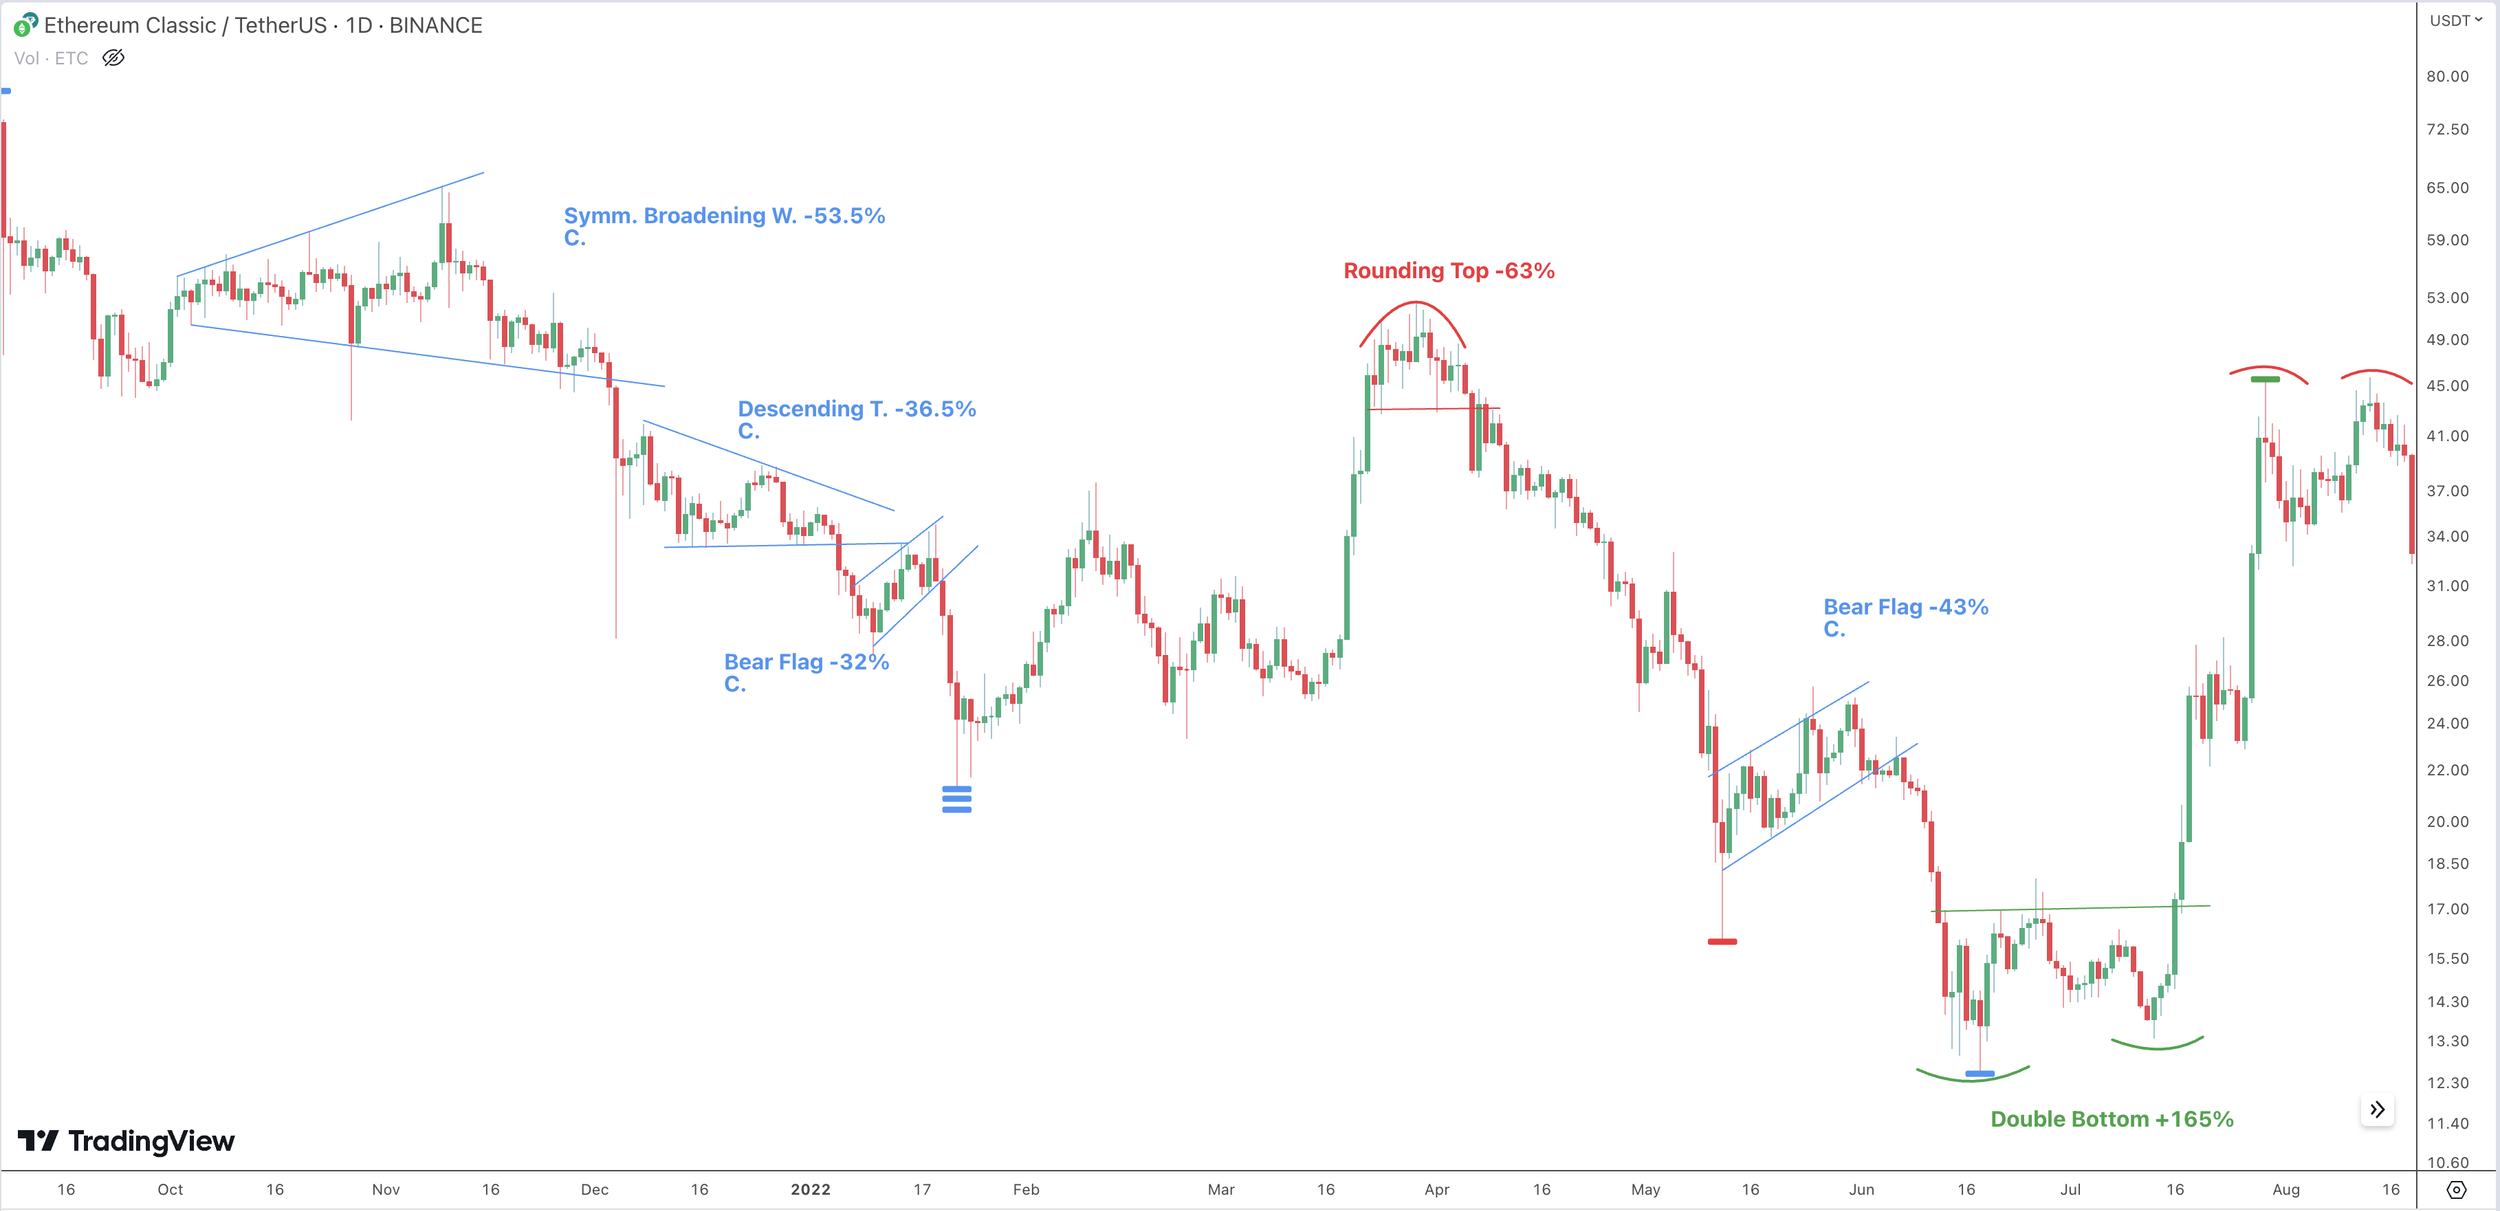
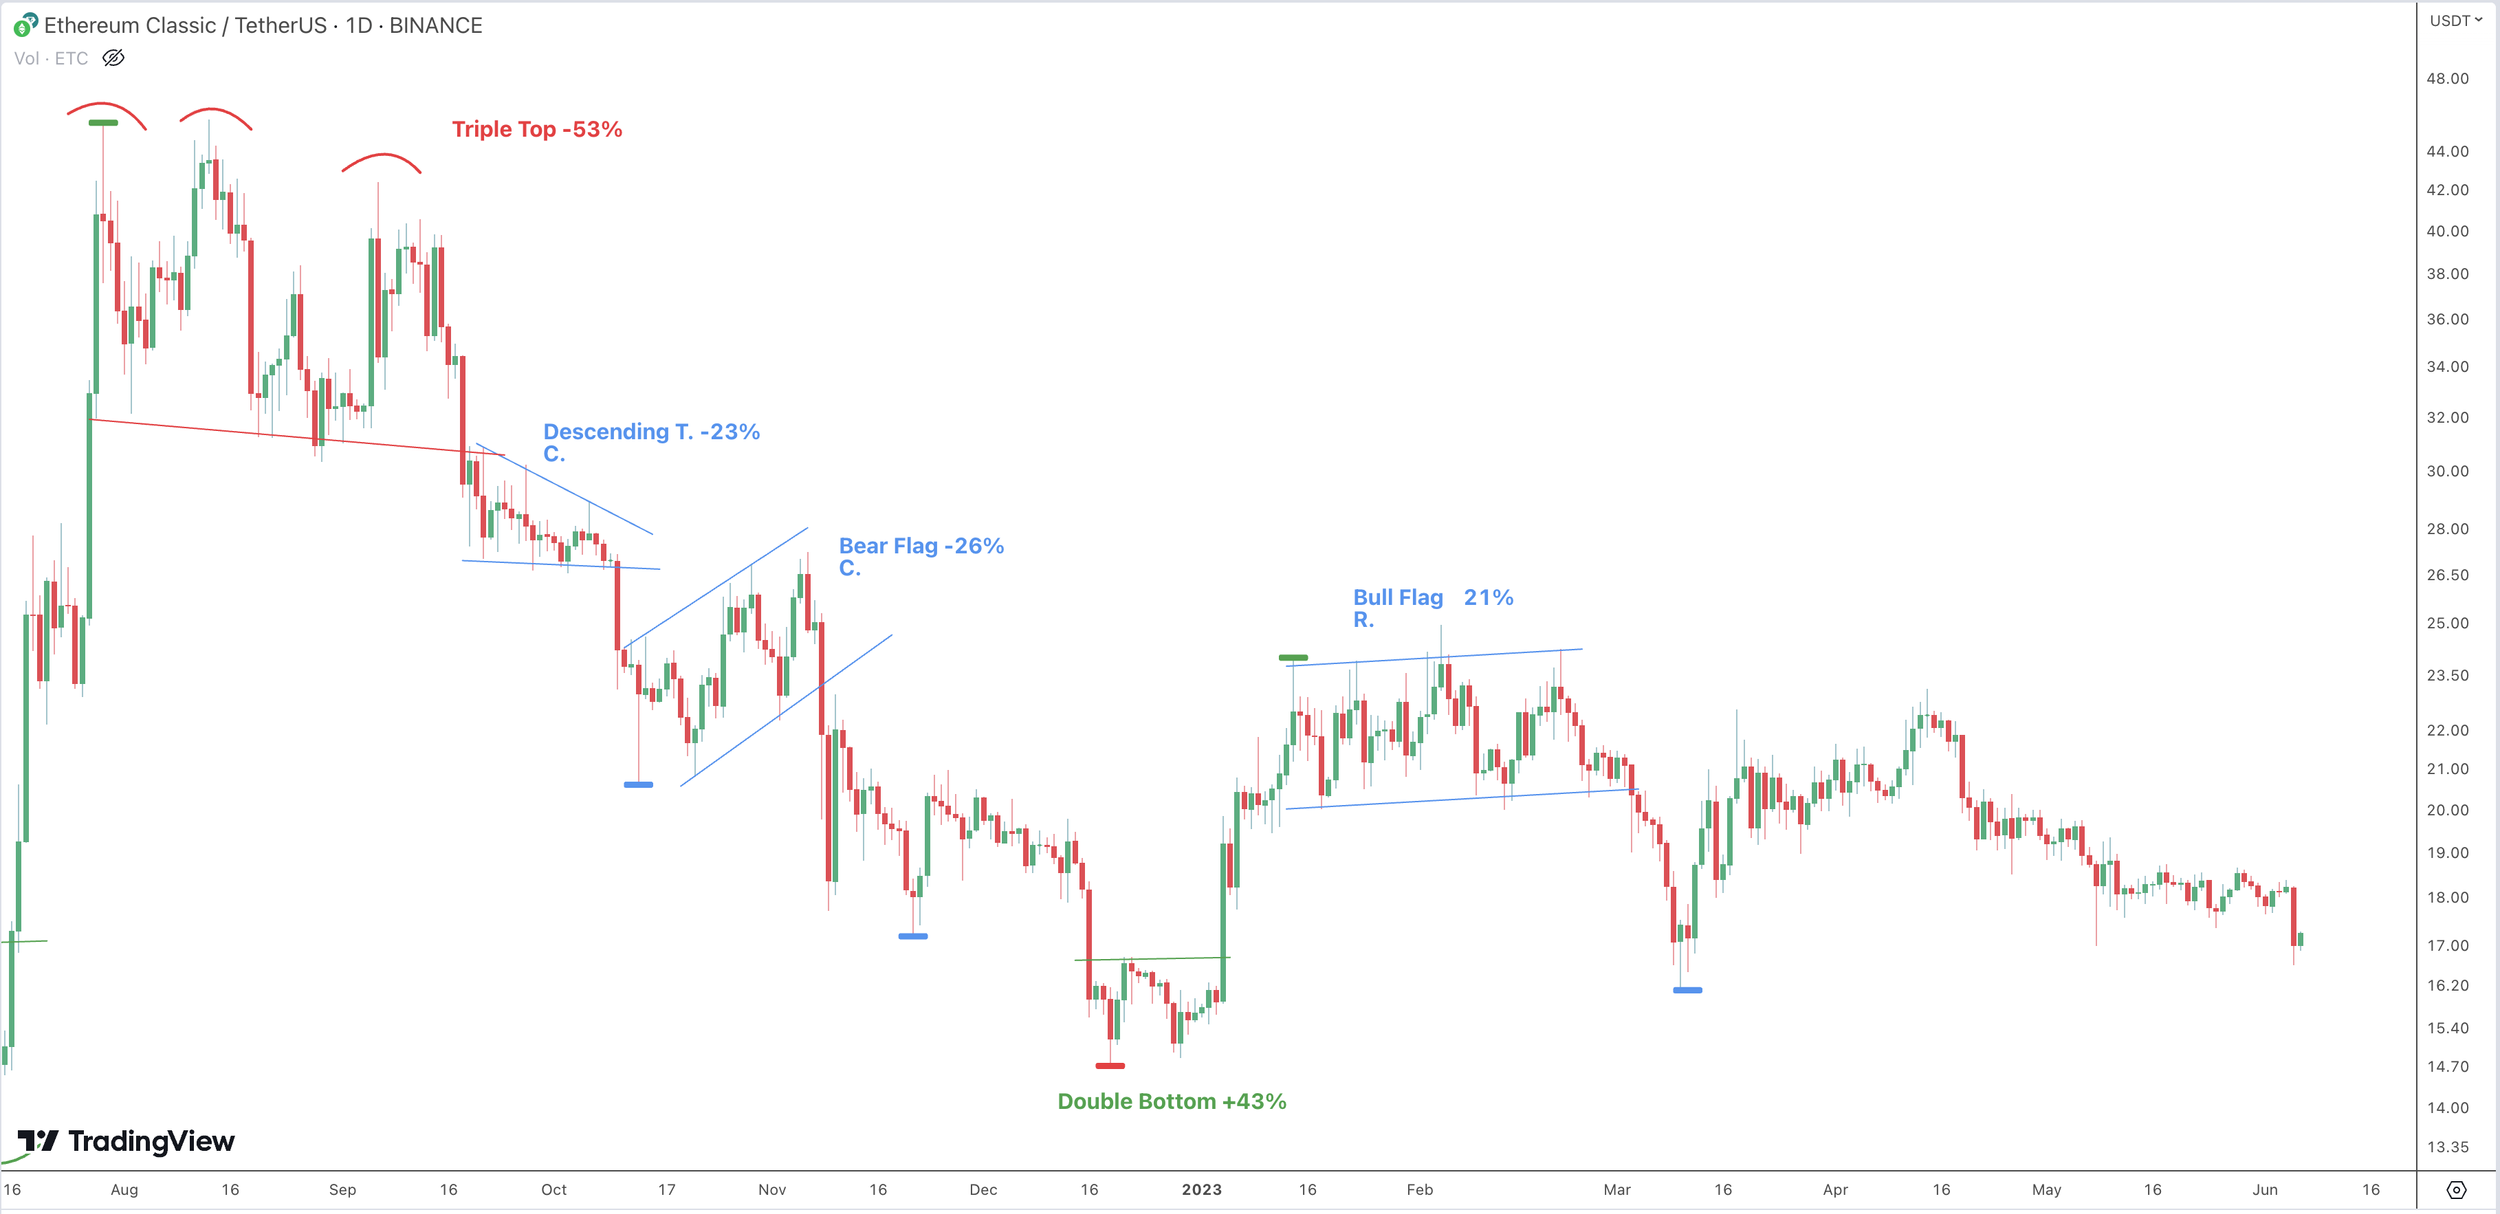
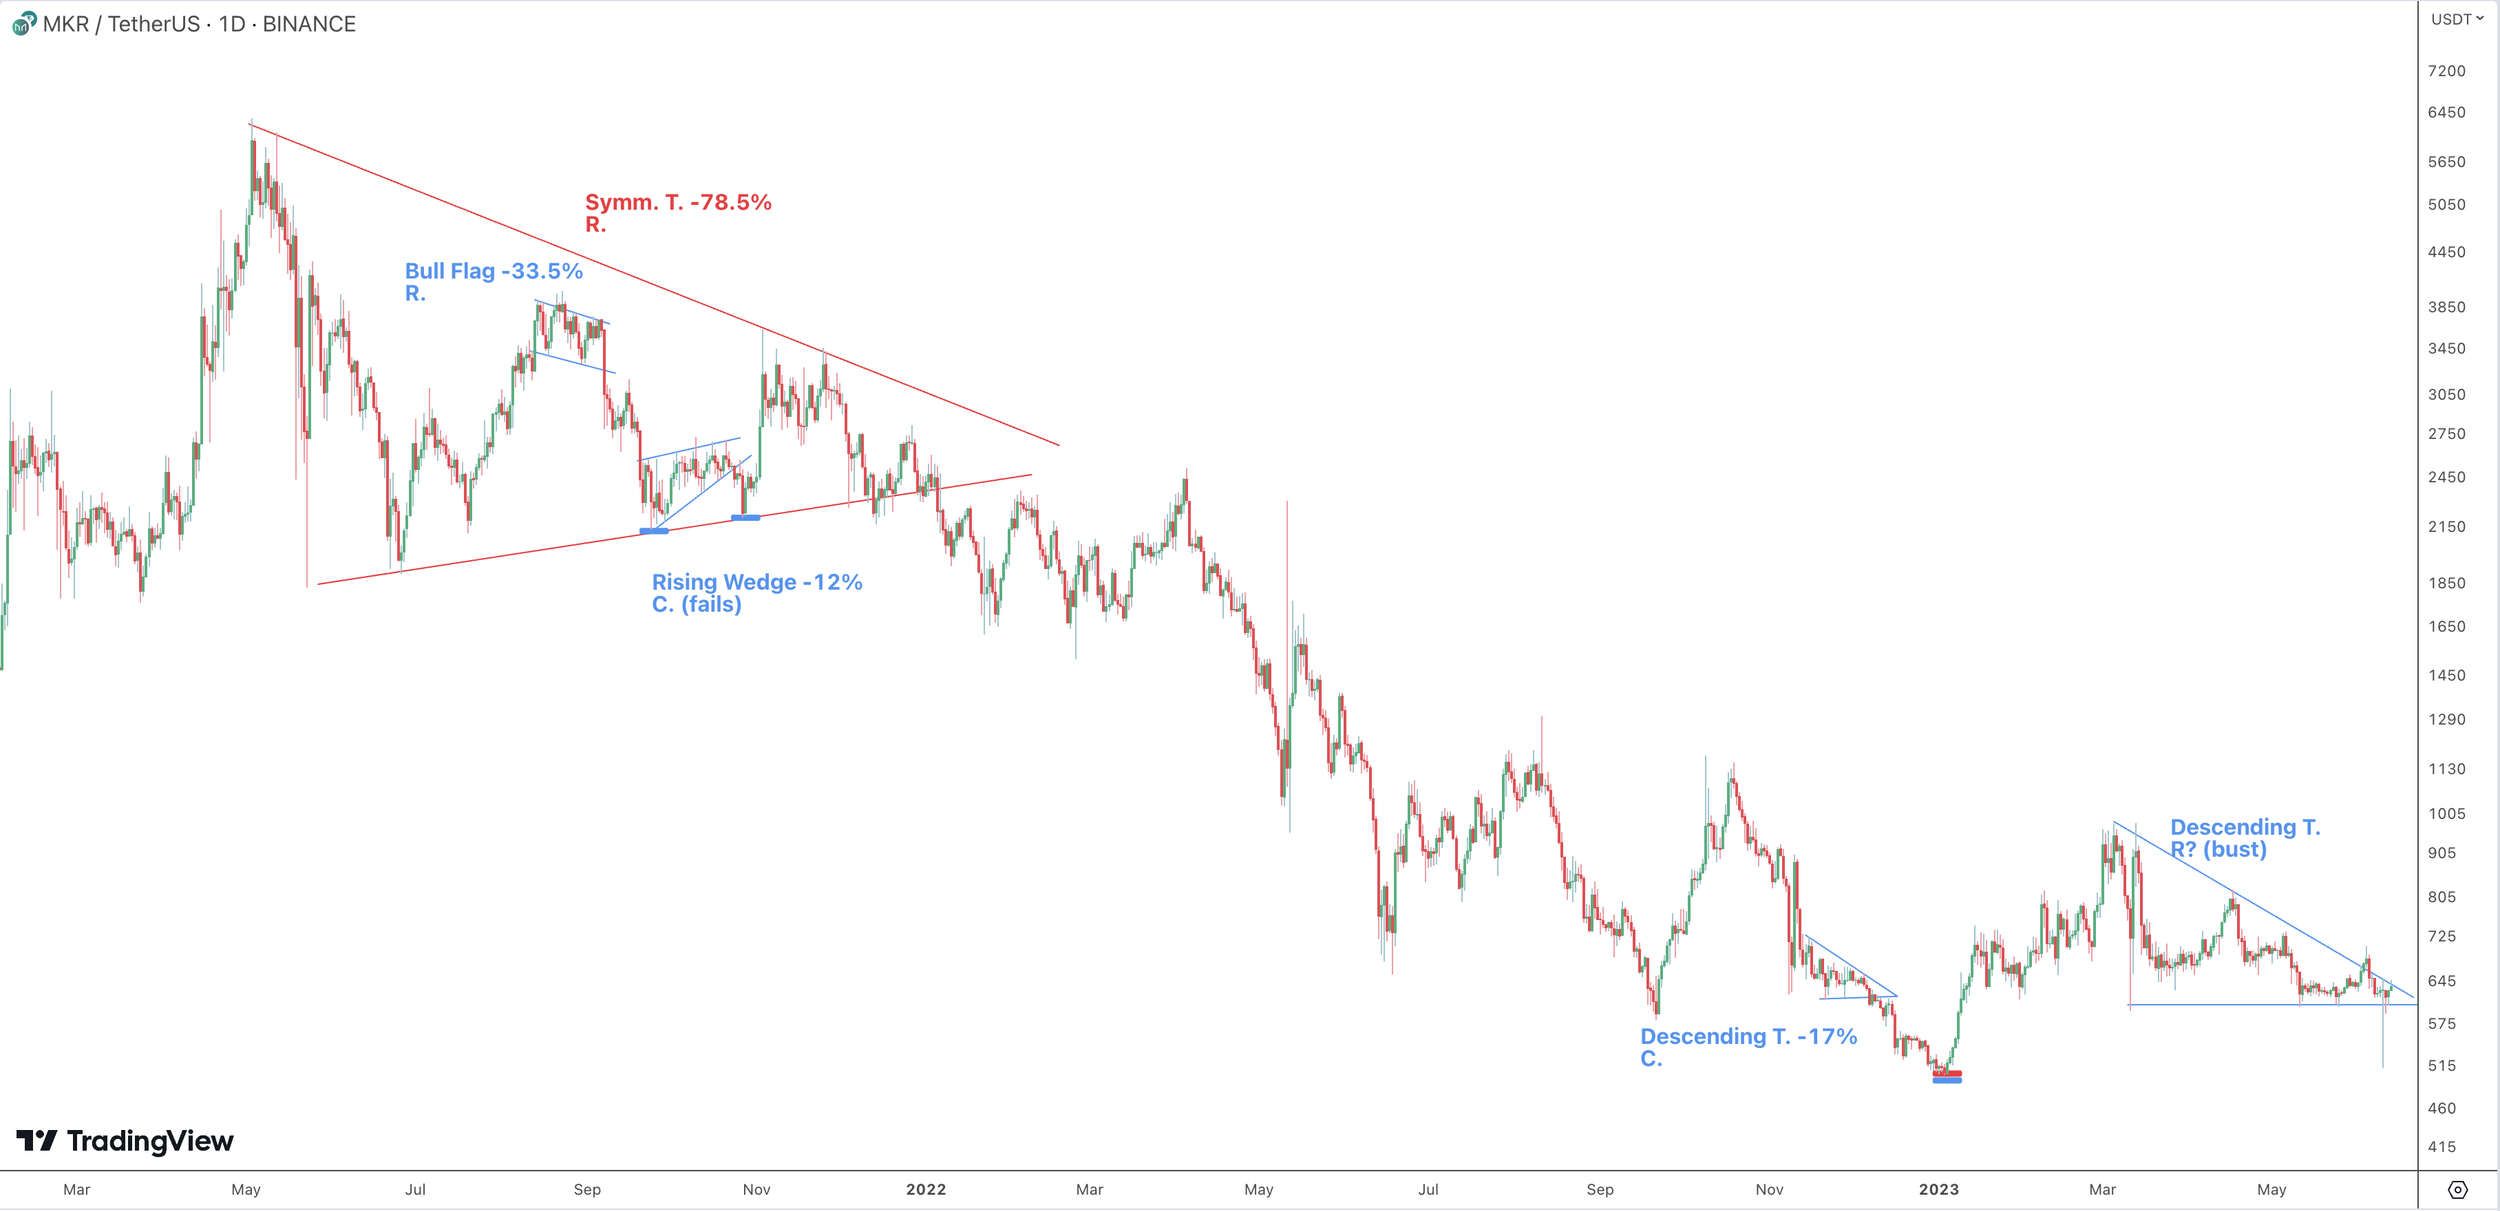
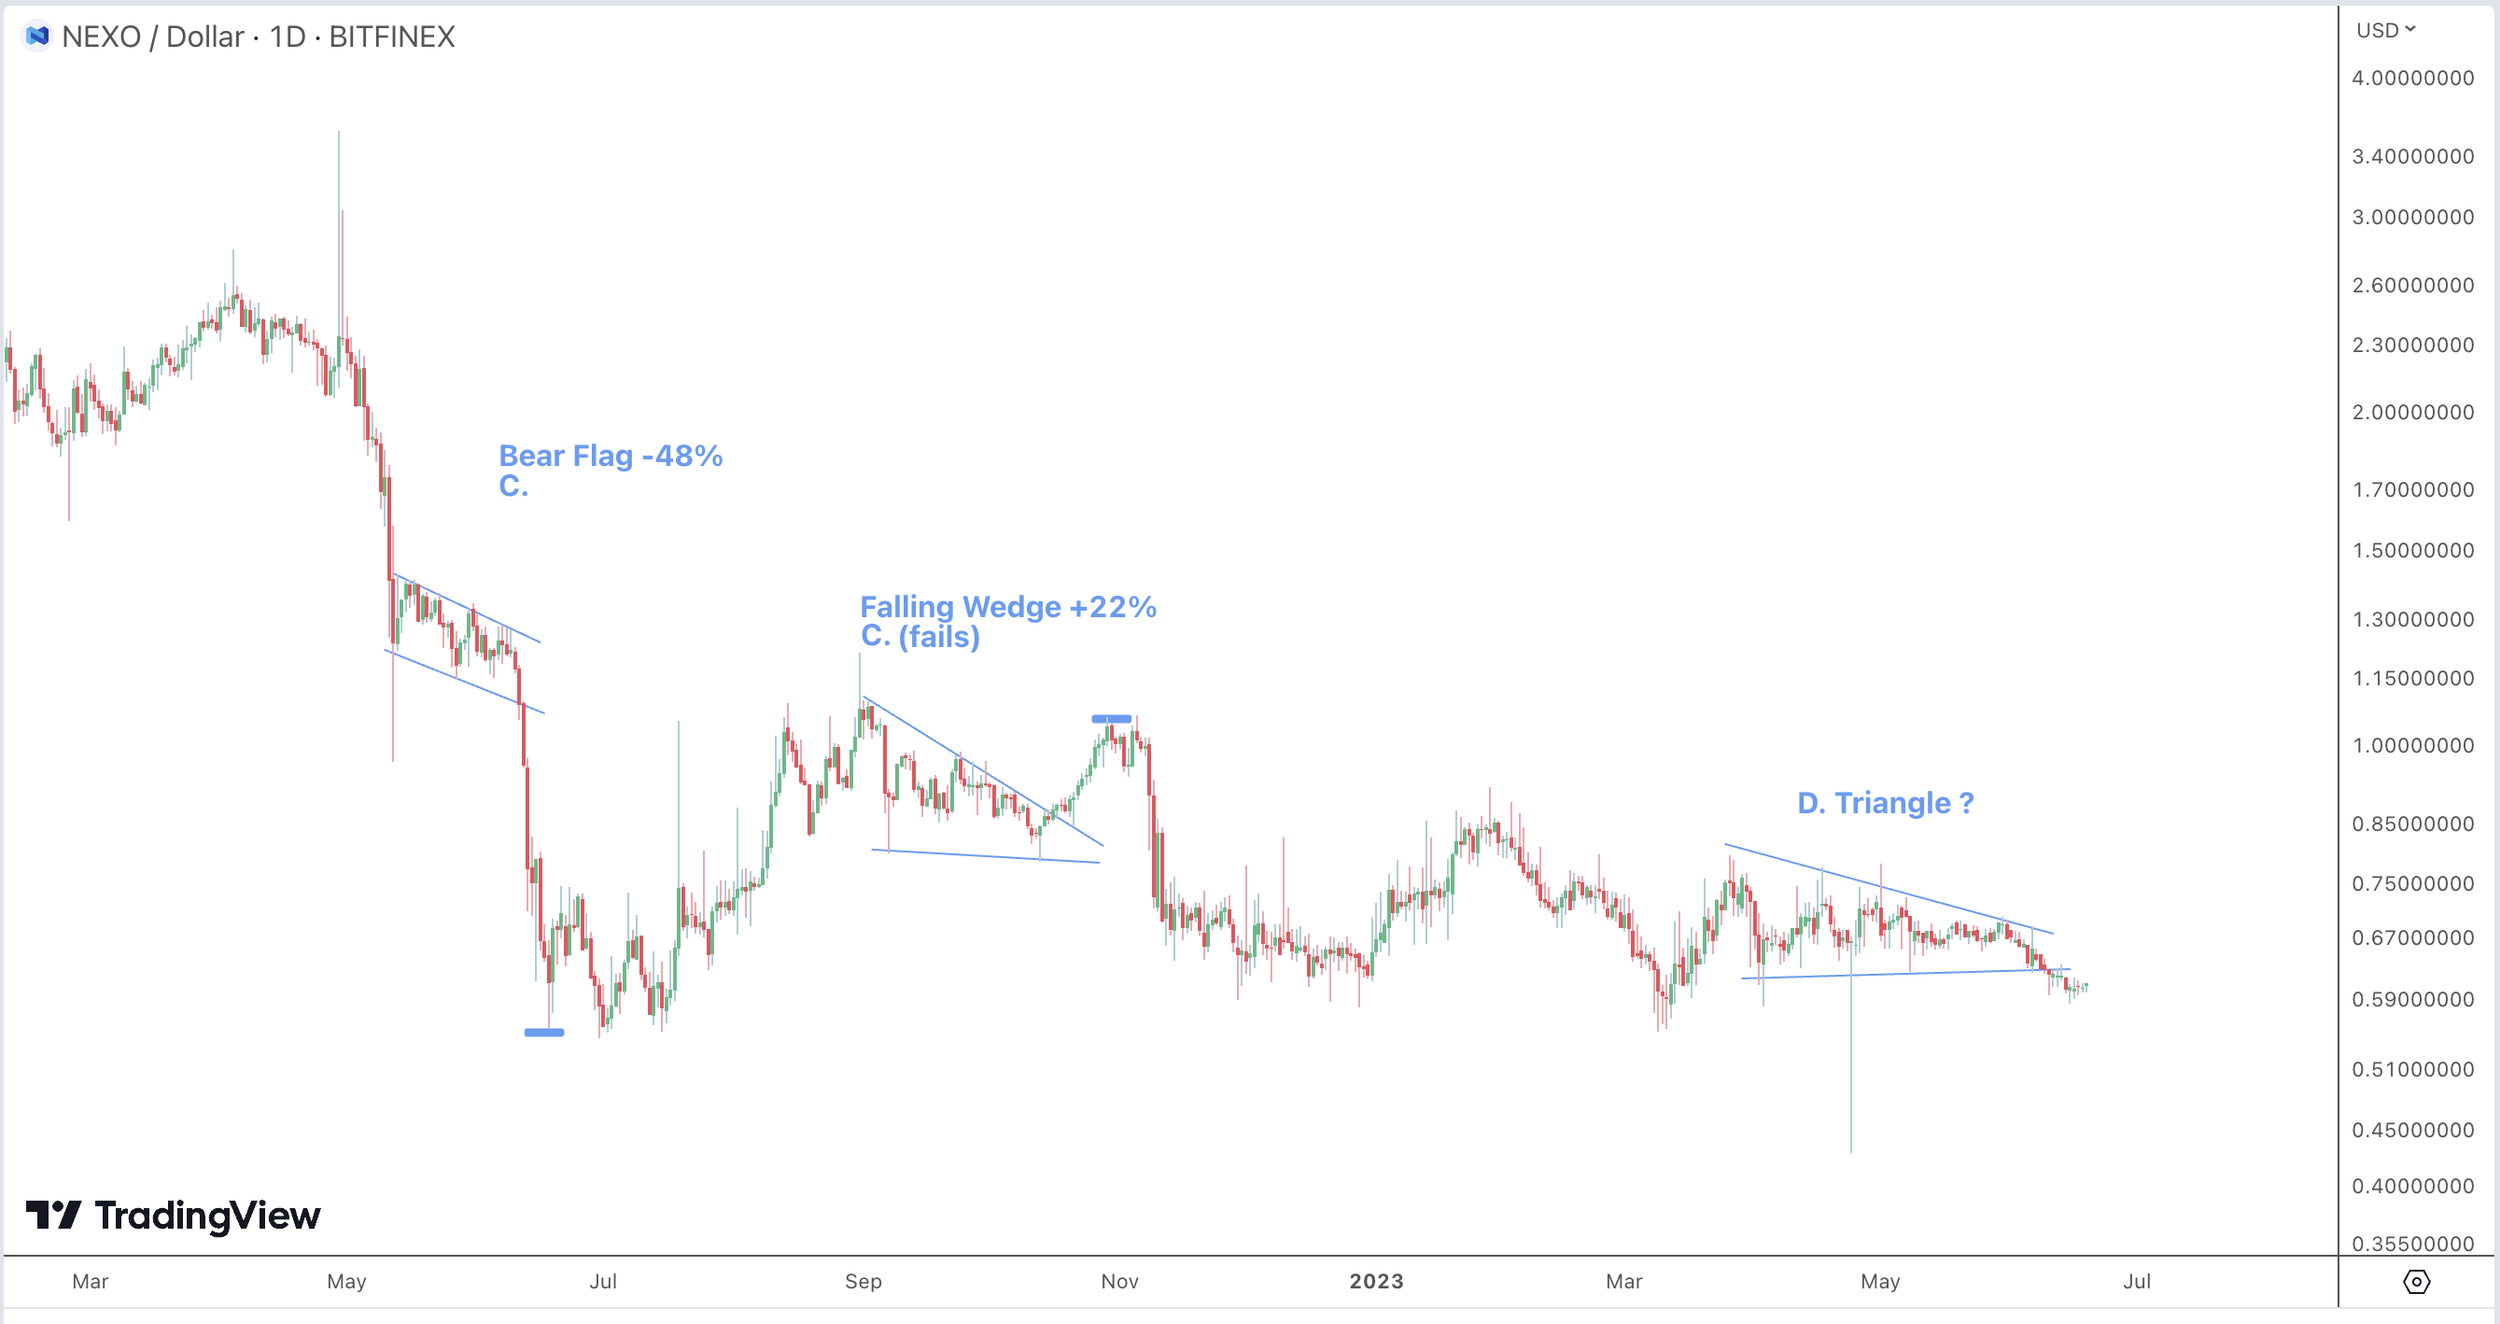
Descending Triangles are dominantly bearish; however, when they break to the upside - they rip!
Be careful discounting outliers and big gainers on this one! Particularly on USD(T) pairs. If that D. Triangle breaks upward, let her fly!
More patterns appeared in USD(T) traded pairs than BTC
Why? Check out my speculation involving Bitcoin’s impact on altcoins in the Chart Logic Handbook .


Market quotes and analysis are displayed with TradingView technology. TradingView offers tools and data for comprehensive market research: here you can track the latest events in the Economic calendar, watch live gold price or other assets on detailed charts, read fresh financial news, and share ideas with fellow traders.

CryptoRanker is LIVE!
Check out Chart Logic’s partner CryptoRanker.io where you can rank and review thousands of cryptos!